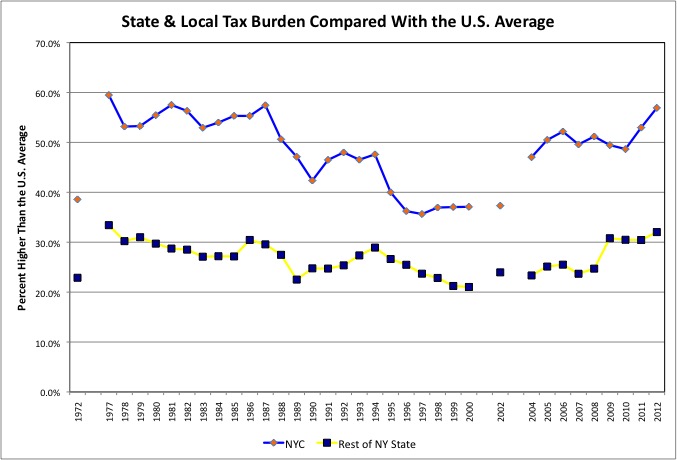
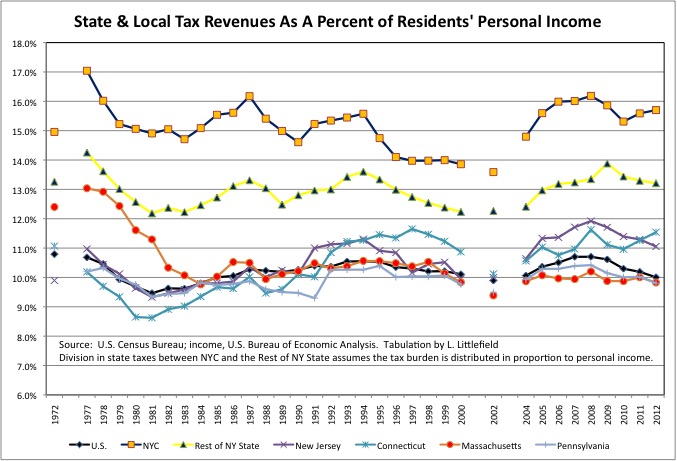
It should be no surprise to anyone that the state and local tax burden in high in New York State in general, and New York City in particular. But it may surprise most just how uniquely high that burden is, even compared with other places that otherwise might be considered to be similar. According to 2012 Census of Governments, state and local taxes equaled 15.7% of the income of NYC residents that year, compared with 13.2%, on average, for the rest of the state. The national average was just 10.0%. NYC’s state and local tax burden was thus 56.9% higher than the U.S. average that year, the largest gap since 1987 and the second highest since 1977, at least among the years available. Some believe that Mayor DeBlasio will be another Mayor Lindsay. But in 1972, during the Lindsay Administration, NYC’s state and local tax burden was just 38.6% higher than the U.S. average. It was much higher than that in NYC before DeBlasio even took office.
This is the first of a series of posts on my compilation of data from the 2012 Census of Governments from the U.S. Census Bureau. I explained this compilation, and linked to a series of spreadsheets with revenues and expenditures per $1,000 of personal income in a large number of categories for a large number of areas, in this post.
And suggested that open-minded readers might want to download the spreadsheets and look at the tables themselves before reading my take on the data. While I’m not sure what is happening on Room Eight, however, what WordPress tells me is that on Saying the Unsaid in New York lots of people are reading the post, but very few are downloading the spreadsheets. Perhaps this post and the rest will prompt some people to reconsider. A separate spreadsheet, with data for taxes alone, can be downloaded here.
Some states have high state taxes and low local taxes, and some the reverse. Some have high property taxes and no income taxes, and some have income taxes and lower property taxes. To properly evaluate the tax burden, one needs to look at the big picture. In FY 2012, according to Census Bureau data, the 10.0% of personal income in state and local taxes collected nationwide included a state tax burden of 5.8% of income and a local burden of 4.2% of income. In Vermont, however, the state tax burden was 9.9% of personal income but the local tax burden was just 1.6% of personal income. In adjacent New Hampshire the local tax burden was above the U.S. average at 4.6% of personal income but the state tax burden was just 3.3% of personal income.
Just four states had a state and local tax burden over 12.5% of personal income. Three were low-population states were most of the taxes are paid by oil and gas industry and other mineral producers, while residents and other businesses paid very little: Alaska, North Dakota, and Wyoming. One of these states, Alaska, actually sends its residents checks rather than a tax bill. The other high tax state, and the only real high tax state once income levels are adjusted for and oil and gas revenues are excluded, was New York.
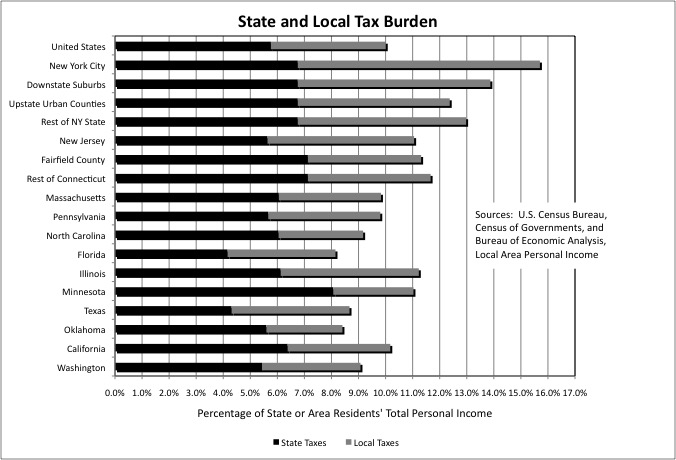 New York’s state and local tax burden averaged 14.3% of personal income. Assuming that the burden of state taxes is distributed in proportion to personal income (it isn’t – MTA taxes are only collected downstate but sometimes spent elsewhere), that burden was 15.7% for New York City, 13.9% for the Downstate Suburbs, 12.4% for Upstate urban counties, and 13.0% in the rest of the state. New York’s state tax burden, at 6.8% of personal income, is somewhat higher than the U.S. average of 5.8% of personal income. But its local tax burden, varying from 8.9% of income in New York City to 5.6% of income in the Upstate Urban counties, is much higher than the U.S. average of 4.2%. In New York City, in fact, the local tax burden was more double.
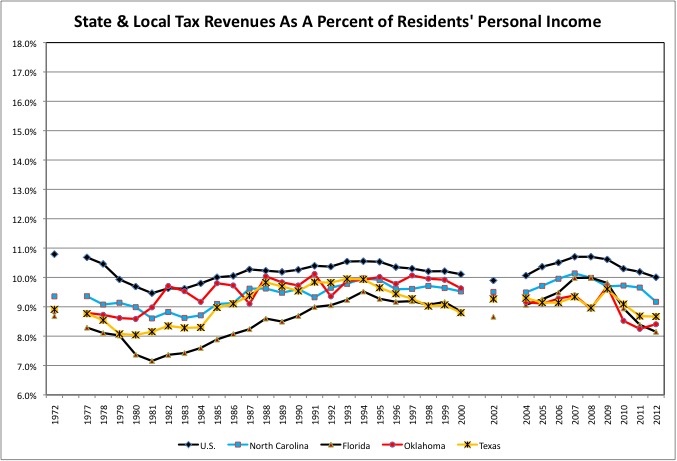
That the state and local tax burden was far higher in New York than in Texas, at 8.7% of personal income, or Florida, at 8.1% of personal income, is no surprise. But New York is also high compared with Massachusetts at 9.8% of income, California, at 10.2% of personal income, New Jersey, at 11.1% of personal income, Illinois at 11.2% of personal income, or Connecticut at 11.5% of income. In New Jersey, as elsewhere in the Northeast, an above-average share of the state and local tax burden is collected at the local level. In 2012 NJ’s state tax burden, at 5.6% of personal income, was below the U.S. average, but its local tax burden, at 5.4% of income, was relatively high.
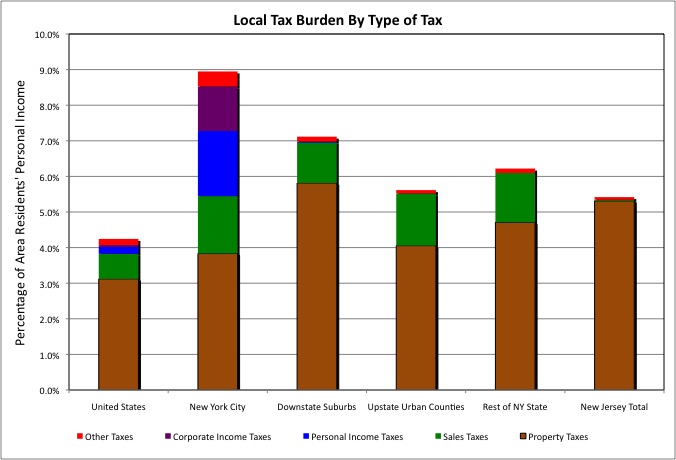 In general U.S. local governments mostly rely on property taxes and fees, but New York City’s property tax burden, at 3.8% of personal income, was only moderately higher than the U.S. average, at 3.1%. So New York City’s high tax burden is mostly due to taxes that it collects that other localities do not. These include a local income tax, and business income taxes. One might argue that like Alaska’s oil and gas revenues, city residents don’t actually pay the business income taxes, but even without including them NYC’s state and tax burden would have been 14.4% of its residents income, more than other parts of the state or pretty much about anywhere else. There are also substantial local sales taxes collected in New York City and elsewhere in New York State, while for most of the U.S. sales taxes are mostly paid to states.
In general, however, in other parts of New York State and New Jersey a high local tax burden overall means high property taxes. Outside New York City, only the poor city of Yonkers has a local income tax. Compared with that 3.1% U.S. average, property taxes absorbed 5.8% of personal income in the Downstate Suburbs, 4.1% in the Upstate Urban counties, 4.7% in the rest of New York State, and 5.3% in New Jersey – the highest of any state in the country. Some rural New York counties have property tax burdens in excess of 6.0% of their primary residents’ personal income, although in most of them second homeowners carry a share of the load In Sullivan County, New York, in the Catskills, for example, the property tax burden is high at 7.8% of the personal income of permanent residents, but 33.8% of the homes are second homes. For New York and New Jersey counties with extensive second home ownership you’ll find a “second home percent” column in the spreadsheet, right next to the property tax burden.
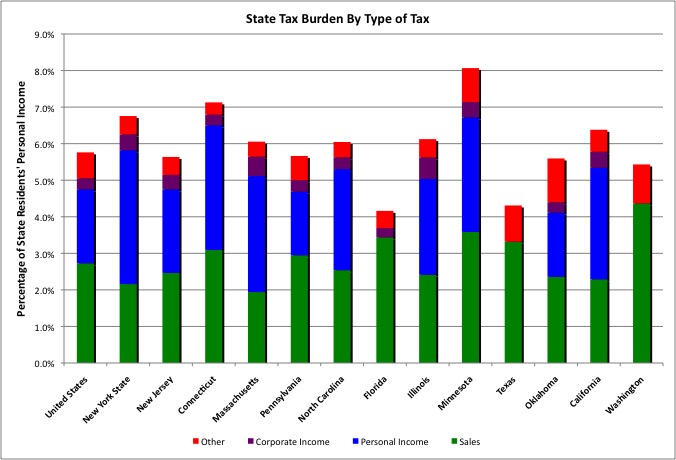 With several large states, notably Texas and Florida, not even having personal income taxes, sales taxes are the top funding source for U.S. state governments at 2.7% of personal income. New York State’s sales tax burden seems lower at 2.2% of income, but New York has high local sales taxes. State and local sales taxes combined equaled 3.4% of personal income in the U.S. and 3.6% of personal income in New York State. New Jersey’s sales taxes, in contrast, equaled just 2.3% of personal income. New York State’s personal income tax revenues equaled 3.7% of its residents’ personal income, the second highest behind state income tax burden behind Oregon (which has low sales tax revenues). For self-employed workers residing in the MTA service area, the MTA payroll tax is on top of that. NYC residents also have a local personal income tax and, for self employed people earning more than $100,000, the unincorporated business tax.
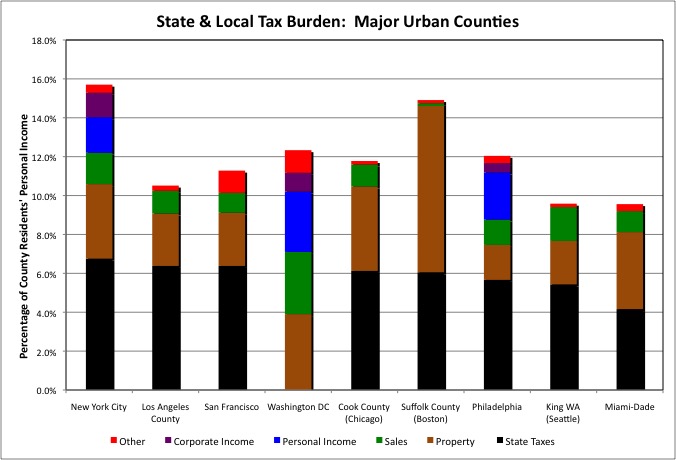
Cities are different, one might say, with more services and more needy people who need them. But New York City’s state and local tax burden is higher than that of the other major urban counties around the country. New York City’s tax burden of 15.7% of its residents’ personal income was much higher than the 10.5% for Los Angeles County. And while one might assert that Los Angeles County contains many suburban municipalities in addition to the city of Los Angeles, New York City, which swallowed five counties a century ago, contains many suburban areas within its borders as well – and Manhattan, the richest urban county in the country. The state and local tax burden was 11.3% of income in San Francisco, 12.3% in Washington DC (which has no state government), 11.8% in Cook County (which includes Chicago), 12.0% in Philadelphia County (co-terminus with the city of Philadelphia), 9.6% in King County WA (which includes Seattle), and 9.6% Miami-Dade.
The closest state and local tax burden to New York City? Suffolk County MA, which is mostly the city of Boston, at 14.9% of personal income. But that includes sky-high property taxes at 8.6% of county residents personal income. I believe that is because the large number of students the pulls average income down, while the large commercial property tax base pushes total property tax revenues up, not because the homeowners of the Southie are particularly burdened by property taxes. It’s like what Manhattan would be without the other boroughs. Meanwhile, only Washington and Philadelphia have substantial personal and business income taxes like New York, but Philadelphia’s property tax burden is only 1.8% of personal income.
For a report that focuses only on homeowners, and only on the largest city in each state, I recommend this one from the District of Columbia.
http://cfo.dc.gov/sites/default/files/dc/sites/ocfo/publication/attachments/2013%2051City%20Study%20FINAL.pdf
It shows that homeowners in different income levels are in fact often worse off in other cities than in New York. But only because New York City sticks it to renters and favors homeowners, as noted here.
https://larrylittlefield.wordpress.com/2015/03/06/taxes-generational-equity-new-york-state-and-new-york-city-in-2014/
That post also shows that the young end up paying more than the old in New York, with retired public employees particularly privileged with an exemption from all state and local income taxes.
Moreover, in any cities where homeowners do end up paying a higher share of their income in taxes than New York City homeowners, this is offset by lower rents and mortgage payments, because property is much cheaper. As it was in New York City in the 1970s, when the city’s state and local tax burden was last this high. There may have been no point in the city’s two most powerful special interests, the public employee unions and contractor organizations and the real estate industry, were able to suck so much out of the serfs combined.
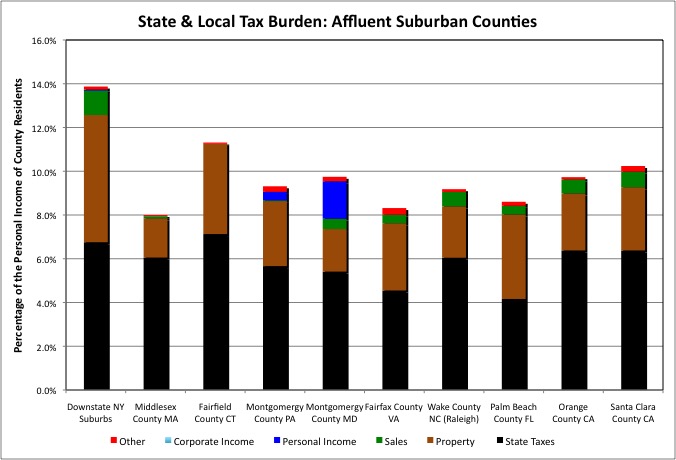 One might expect affluent suburban counties on the two coasts to have low state and local tax burdens relative to their residents’ high incomes, and that is true – aside from those in Downstate New York, which average 13.9% of personal income. Fairfield County in Connecticut is also high at 11.3% of personal income, but a sampling of others shows them to be near or below the U.S. average. Including those in “blue” states such as California, Massachusetts, Maryland and Pennsylvania. The overall tax burden is also lower in Northern New Jersey than it is in Downstate New York, though commuters from New Jersey to New York also end up paying New York State income taxes.
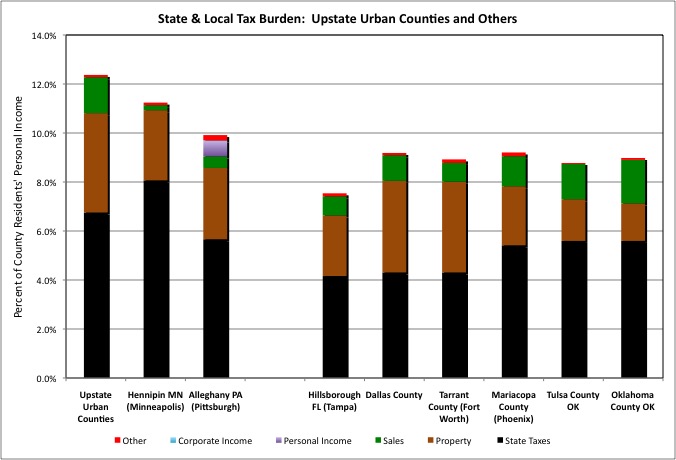 Collectively the Upstate Urban counties have the lowest state and local tax burden in New York at 12.4% of their residents’ personal income, but they compete for businesses and residents with far more prosaic places compared with the glittering metropolis and its environs. Imagine, for example, that Monroe County (Rochester) wanted to emulate the high tech manufacturing and advanced services boom seen in the Twin Cities.
http://www.metroplanning.org/news/article/7110
Monroe’s state and local tax burden was just 11.9% of personal income in 2012, good for New York, but that of Hennipin County MN, which includes Minneapolis, was lower at 11.2%. And not because of mass transit – the Twin Cities have more of it and is getting more still. Erie County, which includes Buffalo, has a state and local tax burden of 12.0% of personal income, also very low for this state (thanks to downstate money flowing up there). But Alleghany County PA, which includes another former steel town (Pittsburgh), has a state and local tax burden of just 9.9% of personal income. Urban counties in the South and Southwest that have been attracting manufacturing and distribution activity have lower tax burdens still. But it is eastern Pennsylvania, with its state and local tax burden at 9.8% of personal income, that has emerged as the production and distribution hub of the Northeast.
Do the services and benefits available in New York exceed those elsewhere, even in states such as California, Massachusetts and New Jersey, by enough to make up for these differences in taxes? And are taxes and services getting better or worse?
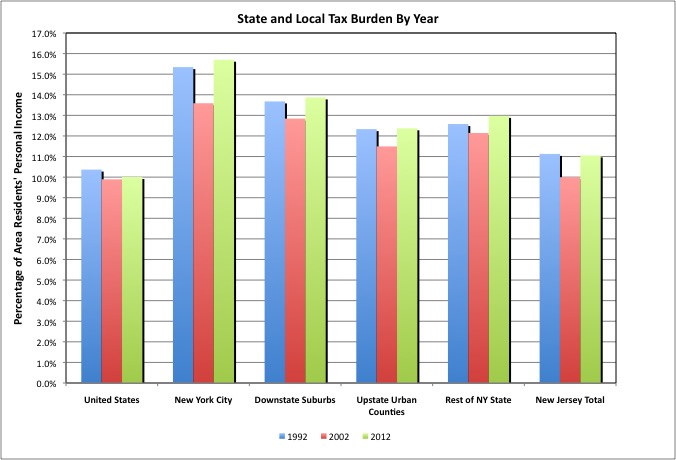 From a national average point of view the trend is getting somewhat worse. The overall U.S. state and local tax burden fell from 10.4% of personal income in 1992 to 9.9% of income in 2002, but it turns out that in many places taxes were being deferred rather than cut – by running up debts, underfunding (while in some cases retroactively increasing) public employee retirement benefits, and disinvesting in the infrastructure. When the consequences arrived the result, in many places, was service cuts rather than tax increases, but the tax burden still increased to 10.0% of income in 2012.
The swing was even greater in New York and New Jersey. In New York City taxes fell from 15.3% of income in 1992 to 13.6% of income in 2002 before rising to 15.7% of income in 2012. Taxes also fell and then increased to a higher level than before in other parts of New York State state. In New Jersey, the state and local tax burden fell from 11.1% of income in 1992 to 10.0% in 2002, before rising back to that same 11.1% of income in 2012.
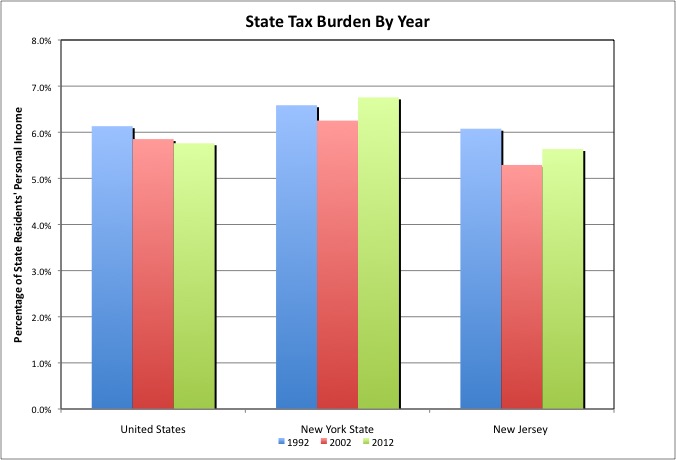 There was a shift, however, in the tax burden by level of government in New Jersey. The state tax burden there fell from 6.1% of personal income in 1992 to 5.3% of income in 2002 before rising to just 5.6% of income in 2012, still less than twenty years earlier. The U.S. tax burden has also shifted away from state government over the years. In New York State, where local taxes were high enough to begin with, the state tax burden increased from 6.6% of income in 1992 to 6.8% of income in 2012, after having fallen to 6.3% of income in 2002.
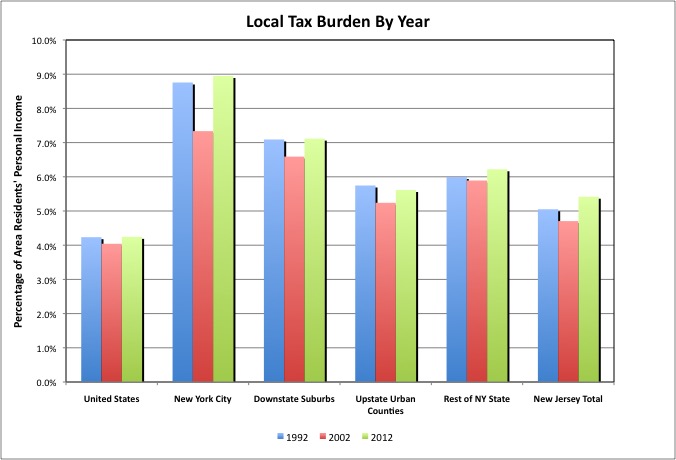
For both the U.S. and New York State, the local tax burden in 2012 was about where it was in 1992, but in New Jersey the local tax burden is much higher. It was 5.1% in 1992, 4.7% in 2002, and 5.4% in 2012 in NJ. As I’ll show, state school aid has plunged relative to the income of state residents in New Jersey, exclusive of pension funding and funding for districts the state has taken over.
In New York City, the plunge in the local tax burden from 1992 to 2002 was mainly due to a decrease in property tax revenues as a percent of city residents’ income, from 4.0% of income in 1992 to just 2.9% of income in 2002. That is partly because incomes increased strongly in the 1990s while property values, depressed by the real estate bust of the early 1990s, were relatively weak. And partly because any large company that managed to get a representative into Mayor Giuliani’s office and claim, credibly or not, that it wanted to move to New Jersey was told it didn’t have to pay taxes anymore. New York City property taxes increased to 3.8% of personal income in 2012, in part due to Mayor Bloomberg’s 18.0% property tax increase, and in part due to all the new development previously exempt under the 421-a program appearing on the tax rolls after a phase in.
As noted in the prior post, one can find revenue and spending by category over time for different parts of New York State, the U.S. and New Jersey (statewide) in this spreadsheet.
Census Local Gov Finance 1992-02-2012 NY-NJ
 To understand the fiscal disaster that many states are facing now one need only look to the very popular tax reductions and spending increase – one health care, on schools, on public employee pensions – over the past 20 years. Most parts of the U.S. don’t have the quality schools found in New Jersey, Massachusetts and Connecticut, or the extensive mass transit system of New Jersey, metro Philadelphia or metro Boston. And yet for substantial periods through the mid-2000s the total state and local tax burden of these states was generally near, or even below, the U.S. average. It wasn’t because they were more efficient of less corrupt. It was because they were selling the future on behalf of those cashing in and moving out. Now there are pension crises in each of these states. The Philadelphia and Boston rail transit systems are crumbling just as younger generations are increasingly choosing a life built around them.
The tax burden in New York City and the rest of New York State never got anywhere close to the national average. So powerful are the state’s special interests, however, that it could not afford the Pataki-Giuliani era tax reductions, which were really just tax deferrals, despite a substantial reduction in assistance to the poor. And with less money going to the poor, one has to wonder what New York gets for all those extra taxes compared with its neighbors. While New York State’s pension system is well-funded, New York City’s is in as deep a hole as New Jersey’s. And New York’s MTA faces a capital funding crisis as severe as Boston’s MBTA or Philadelphia’s SEPTA though it is in better repair, for now.
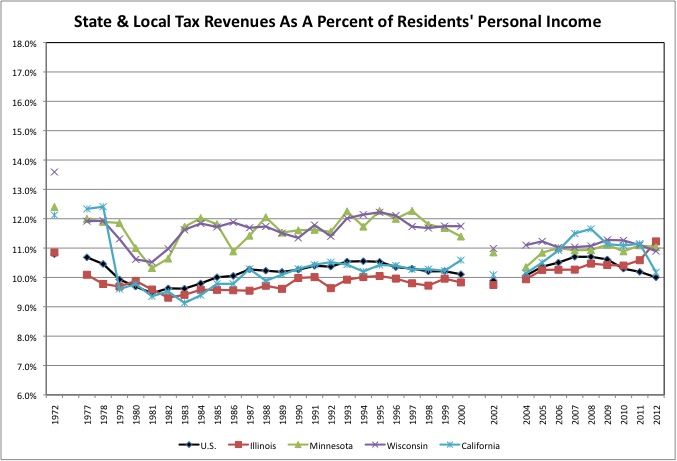 During the Generation Greed era politicians of other states also implemented the ever-popular “lots of spending, lots of corruption, and lower taxes, before cashing in and moving away” plan. In the Midwest, the state and local tax burden has been consistently higher than the U.S. average over the years in both Minnesota and Wisconsin, but Illinois had below average taxes during the 1980s, 1990s, and into the 2000s. And yet Illinois had decent schools too, outside of the city of Chicago, and an extensive mass transit system in metro Chicago where most of the state’s people live. And it had a substantial, and expensive, low-income population.
So how did Illinois achieve this low tax miracle? By being more efficient and less corrupt that other states? Not given that, as someone told me, Illinois murders have a lower percent chance of ending up in jail than Illinois Governors. They did it by selling the future. And now, as in New York City and New Jersey, it is the future. Illinois taxes jumped to a higher share of personal income than Minnesota and Wisconsin in 2012, and that state still faces a spiral of tax increases and service cuts.
People in California complain about taxes. They should check out New York. People in California can’t blame the state legislature, the way New Yorkers can. They voted for higher school spending and lower taxes directly in referenda. And in the city of San Francisco, the people had to approve the retroactive pension increases by referendum too (that progressive city has recently passed retroactive pension cuts and employee contribution increases by referendum, now tied up in court). The tax burden there tends to fall in tech bubbles, when income soars, and rise in tech busts, when income falls.
 When I first started tracking this data, I was struck by the fact that once taxes were divided by personal income, which adjusts for both the size of the area and the ability of its residents to pay, most states fell in a narrow range of between 9.0% and 12.0% of income. Only the few oil and gas revenue states and New York were higher. And only a couple of states, generally “Live Free in Booms, and Move To New York To Claim Benefits If You Lose Your Job in A Recession or Die” New Hampshire, and Tennessee, the Volunteer State where I suppose public employees are expected to volunteer, were lower. The higher tax states were those one would expect: those with better schools and public services. The lower tax states were those one would expect – mostly those that got a better deal from the federal government, with a higher share of their welfare and Medicaid costs covered.
In 2012, however, there were 13 states where the state and local tax burden, as a percent of area residents’ personal income, was below 9.0%. This is a big change.
For 30 years, the U.S. (and world) economy have been dependent on Americans spending more than they earned and not saving for retirement, as I noted here.
https://larrylittlefield.wordpress.com/2014/03/09/debt-and-inequality-go-together-rising-debt-is-the-cause-of-rising-inequality/
Rising debts inflated consumer spending, and thus state sales tax revenues, and housing prices, and thus local property values and taxes, relative to income residents had to support that consumer spending and housing cost. All this changed when the housing bubble burst in 2007. But rather than increase tax rates, or other taxes, to compensate, many Tea Party-inspired states allowed their tax revenue base to shrivel away instead. These states have also seen repeated cuts in public services.
I was once less cynical than I am now, and would have thought that there would have been some regression to the mean. That in the low tax states people would begin to question why they were being forced to settle for diminished public services and benefits. Instead, politicians in the low tax states are pushing for even more tax cuts, the consequences be damned. In Oklahoma and Kansas, Governors want to eliminate their state’s personal income tax. In Texas, the politicians have noticed that property taxes are high in that zero income tax state, a state that funds schools in poor areas by requiring wealthier areas to collect more property taxes and send them to the state for redistribution. So there is a state proposal in Texas to force localities to lower their property taxes. Illinois is no longer a low tax state, but it is facing bankruptcy. Its new Governor has nonetheless promised to have its mere 5.0% personal income tax rate, which was temporarily increased to that level, fall back to just 3.0%. (Compared with more than 10.0% for New York State and New York City combined).
And in New York, the one true high tax state? One would think that New York’s public employees would feel a bit sheepish about how much they are taking in, refrain from demanding more, and be extra motivated to make all those extra taxes worth it. Instead, New York’s serfs get service with a sneer from the leaders of New York’s public employee unions, who keep demanding even more while expecting to provide even less.
In each case instead of regression to the mean entitlement seems to feed entitlement, with the media providing an echo chamber to those who can hire the most flacks. But you can’t look at these numbers without concluding that one’s political attitudes with regard to state and local government should be a lot different in New York than they would be in most other places. Those other places are finding out, and will continue to find out, that in the wake of Generation Greed those who are not willing to pay for public services and benefits will not have them. Here in New York, however, we find that those who are willing to pay for public services and benefits may not get them either.