
In FY 2012 the State of New York spent $99.9 billion directly (excluding insurance trust expenditures), including $38.6 billion on Medicaid, and sent $56.7 billion in aid to local governments, including $26.6 billion in school aid. But it only collected $71.6 billion in state taxes. New York State’s local governments spent $170.5 billion directly and sent $10.6 billion back to the state, but only collected $80.2 billion in local taxes. For the states and, more importantly, for the local governments that do most of the work of government, taxes are just one component of their revenues. Money received from higher levels of government, and fees charged for services, amount to larger share of the total.http://mensclub24.ru/
This posts uses 2012 Census of Governments finance data to show how New York City, other parts of New York State and New Jersey compare with each other and with local governments elsewhere, with regard to intergovernmental revenues, fees for services, and miscellaneous revenues, and how this has changed over time.
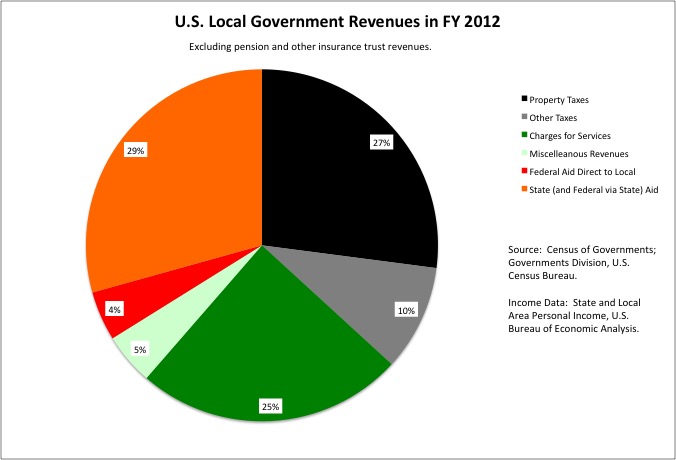
The data in the chart above excludes insurance trust revenues, such as contributions to and investment returns of public employee pension funds. Taxes accounted for 36.8% of U.S. local government revenues in FY 2012, or a little more than one third. As discussed in my prior post on state and local taxes,
https://larrylittlefield.wordpress.com/2015/04/14/taxes-2012-census-of-governments-finance-data/
property taxes are the primary tax collected at the local level.
Intergovernmental aid accounted for 33.9% of local government revenues. The federal government sends relatively little aid directly to local governments, even if local governments ultimately spend the money. In general federal money first passes through state governments, which impose their own rules about how it is to be used, and the states add their own tax dollars and pass it on.
Charges for public services, and miscellaneous revenues such as fines and forfeits, special assessments, property sales, rents and interest revenues, and donations, accounted for nearly as much in local government revenue as taxes. Together these “business” revenues accounted for 29.3% of local government revenues, with 24.6% for charges alone. Property taxes accounted for just 27.1% of local government revenues.
Starting with intergovernmental revenues, let’s get more specific about categories and see how New York, New Jersey and other places compare with the U.S. average.
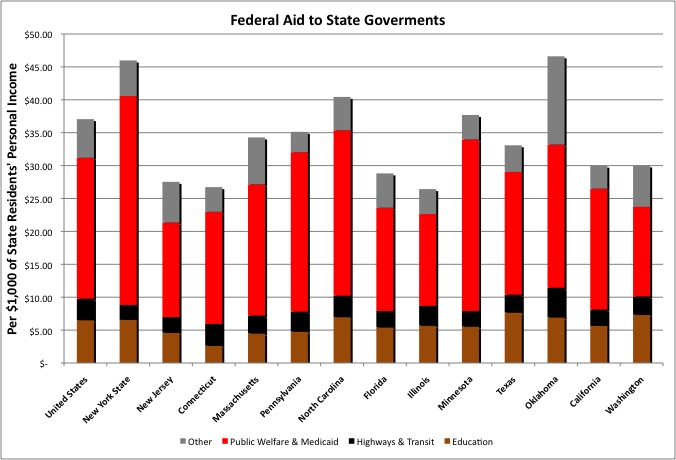
In fiscal 2012 federal aid to all U.S. states (and the District of Columbia) equaled 3.7% of the total personal income of all U.S. residents, or $37.06 per $1,000 of personal income, the measure that will be used going forward. Most of this was for health care public welfare programs including, most prominently, Medicaid. Aside from the Department of Defense, a large share of direct federal spending was on similar income security and health care programs, such as Social Security and Medicare. Thus the federal government has been described as an (social) insurance company that also has an army.
In the past former (now deceased) New York Senator Daniel Patrick Moynihan and the Northeast-Midwest Institute would release reports each year showing that northeastern and midwestern states paid more into the federal government than they got back in federal spending, while Sunbelt states got more out than they put in. In New York’s case this is because the federal tax burden is high here due to above average income, and direct federal spending on things like military bases and contracts is low. After repeated base closings, in fact, Fort Drum in the North Country is pretty much all New York has left. There is one category of federal spending, however, in which New York has been a net winner – federal aid to state and local governments.
For combined federal/state programs such as Medicaid, the federal government requires better off northeastern state such as New York, New Jersey and Massachusetts to cover a higher share of their total expenditures than poorer states such as Oklahoma. New York’s base federal Medicaid share is just 50 percent, compared with as much as 80 percent elsewhere. Because New York also has many poor people, however, and because its Medicaid program is so expensive, New York State’s aid from the federal government totaled $45.98 for every $1,000 of state residents’ personal income, well above the U.S. U.S. average of $37.06. Adjacent northeastern states received much less in federal aid as a percent of their residents’ personal income. New York, however, only gets more federal aid that average in the public welfare and Medicaid category, not others. And it has to spend more of its own tax revenue in matching funds to get that excess federal aid.
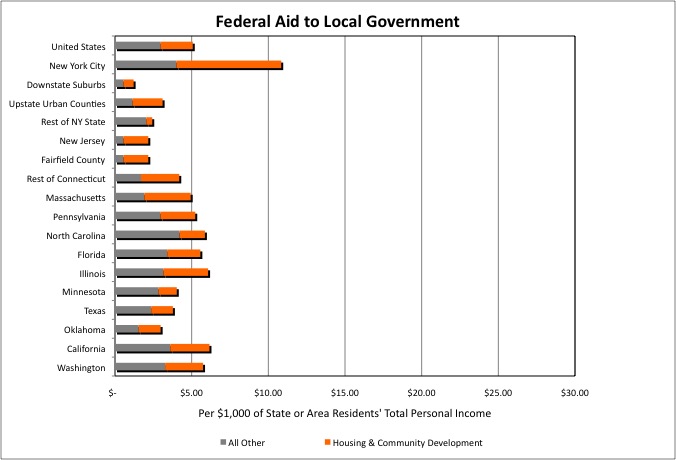
The largest component of federal aid that goes directly to local governments, rather than passing through the state, is for Housing and Community Development. New York City, with its large stock of public housing, receives a larger than average amount of federal aid in this category, and direct federal aid in general, compared with the personal income of its residents. Other parts of the state don’t fare as well. New York City has traditionally had a strong relationship with the federal government, and received better treatment from Washington than from Albany. Many a federal Secretary of Housing and Urban Development has come from the city, but few if any federal Secretaries of Transportation have come from New York State.
The federal housing aid, however, comes with strings. In the early 1980s the federal government decided that the country’s most troubled people, those the suburbs didn’t want, should be given priority in public housing, which was concentrated in central cities. And it has been cutting housing assistance to cities ever since.
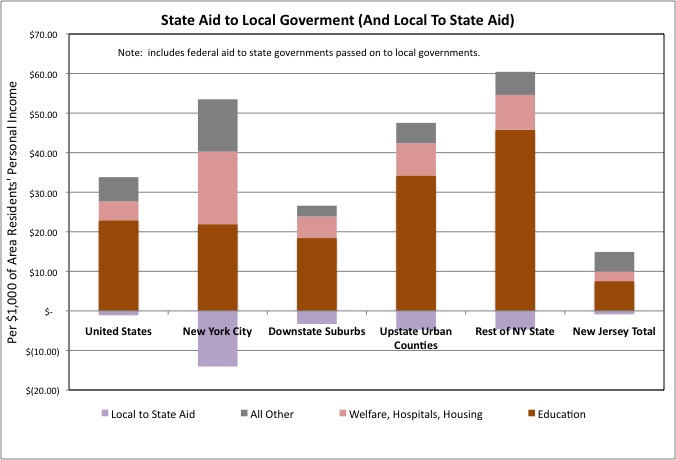
Most state to local aid is for elementary and secondary schools. School aid equaled $22.92 per $1,000 of personal income nationally in FY 2012, and $27.76 per $1,000 of personal income in New York – a higher amount statewide. New Jersey was much lower, although that state operates schools in several of its largest cities directly and is supposed to fund teacher pensions in lieu of providing school aid. Within New York State, school aid per $1,000 of personal income was above the U.S. average in less well off Upstate New York, below average (but not by much) in the affluent Downstate Suburbs, and about average in New York City.
New York State sent New York City $18.32 per $1,000 of its residents’ personal income in federal and state aid for welfare, social services, hospitals and housing in FY 2012, many times the $4.73 average for the U.S. as a whole or other parts of the state. Nationally, since many state governments administrate their public welfare and social services programs directly, there is relatively little state aid to local governments in those categories. Welfare and social services are New York City and county administered in New York State, rather that state administered, and the poor recipients are concentrated in NYC.
More uniquely, New York State requires local governments to contribute to its state-run Medicaid program, and requires New York City to pay a higher percentage of its total Medicaid expenditures than other parts of the state. As a result New York City’s aid payments to New York State equaled $14.06 per $1,000 of personal income in FY 2012, compared with a U.S. average of just $1.13. By itself, in fact, New York City accounted for 42.7% of all local government to state government payments in the United States in FY 2012, and 70.7% of such payments in the Welfare and Medicaid (all for the latter) category. (The city also sent money to the state-run MTA, among other payments). Taken together, New York’s local governments accounted for more than two-thirds of U.S. local to state aid payments, and 96.7% in the Welfare and Medicaid category.
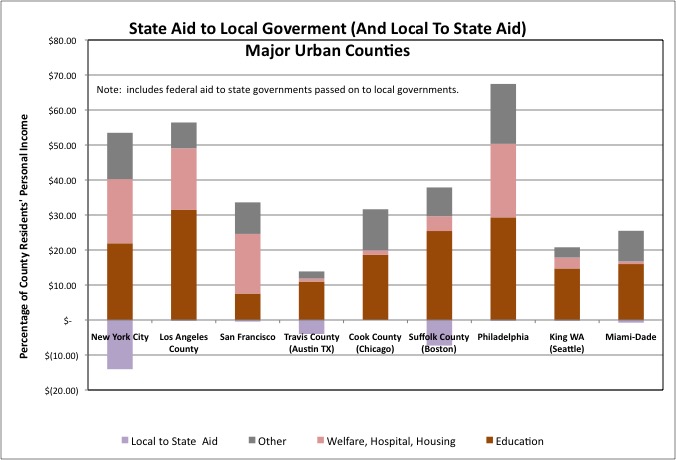
Extensive low income populations are common in the major U.S. urban counties, and where programs for those populations are locally administered state to local aid in the welfare, hospitals and housing categories is generally substantial (since that state aid includes the federal aid paid to the states). Los Angeles County in California is an example. As expected those major urban counties that are somewhat poorer than New York City get more state aid in the public welfare category per $1,000 of their residents personal income, while those that are somewhat richer get less. Cook County (Chicago) gets relatively little state aid, both in this category and overall, in part because the state government administrates public welfare and social services programs in Illinois.
Texas is another place in the U.S. where local government to state government aid is extensive. In this case, it is for education. Because state taxes are so low in that state, the state government seeks to provide a minimum quality of education in poor districts by forcing more affluent school districts, such as those in Travis County (which includes Austin) to collect extra property taxes. These are sent to the state and redistributed. Needless to say this is not popular in the contributing school districts.
http://impactnews.com/austin-metro/education-leaders-call-for-changes-to-state-funding-system-a/
Texas also uses local to state aid to fund public higher education. As noted in the prior post property taxes are high in Texas. Of course the overall state and local tax burden is very low in Texas, and very high in New York.
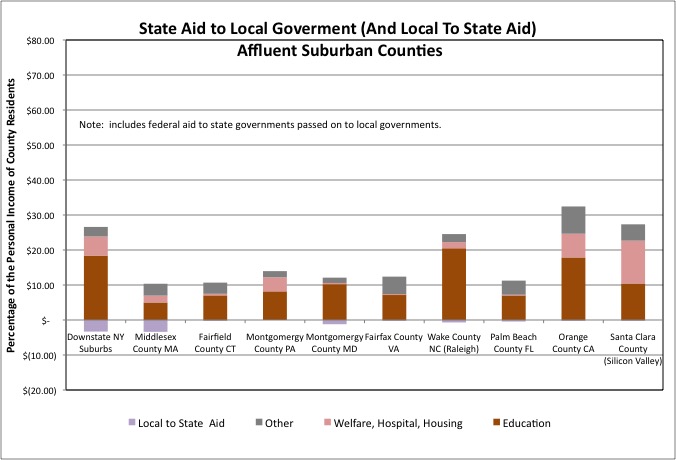
Affluent suburban counties typically get less state aid overall, because state school aid is sent disproportionately to poorer school districts, and housing the poor can afford is zoned out of suburban areas, limiting their public welfare spending. New York’s Downstate Suburbs are an exception, because public welfare programs are locally administered here, and because New York’s school spending and state school aid are so high overall. California is another exception, with locally administered social services and school spending that, although not that high on average, is primarily funded by state taxes. New York’s STAR program sends school aid disproportionately to the affluent Downstate Suburbs.
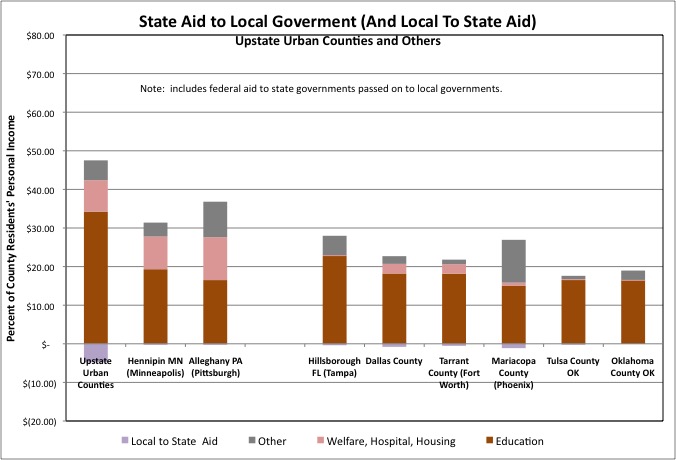
New York’s Upstate Urban counties get more state aid, per $1,000 of their residents’ personal income, than other old, cold, but in some ways more successful former industrial centers such as Minneapolis and Pittsburgh. And far more state aid than the Sunbelt urban counties with more successful industrial and back-office economic bases, those economic bases Upstate New York might seek to compete for. Unlike most other Rustbelt industrial centers Upstate New York has a “rich uncle downstate,” and can thus afford a high level of local government spending that is in part a quality service provider and in part a high-end welfare program. One would think this would provide a stronger foundation than other areas have. While state aid funded by downstate taxes funds a lot of this, however, the higher local taxes that also go along with that high local government spending Upstate may discourage private sector activity. And the flip side of more state government-funded redistribution within New York State is less federal assistance and spending Upstate than poor states receive.
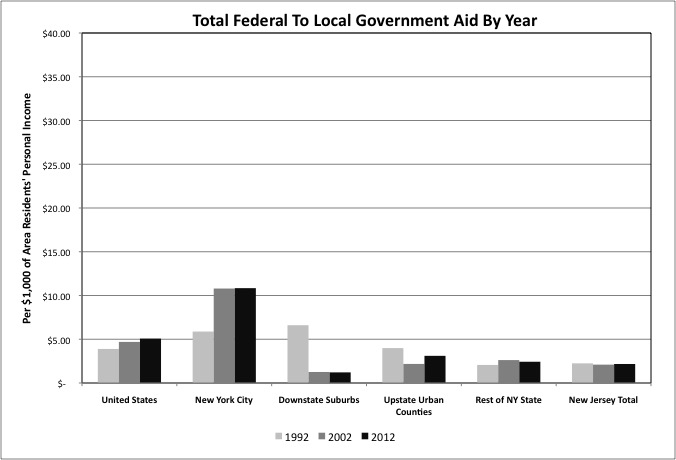
With the soaring cost of services for senior citizens and interest on the rising national debt, discretionary federal spending – and federal aid to state and localities aside from Medicaid and other health are – has been squeezed. Even so direct federal to local government aid was somewhat higher in FY 2012, per $1,000 of personal income, than in 2002 and 1992 in the U.S. as a whole. New York City has done particularly well with regard to federal to local government aid, though thanks to an X factor other places may not want to copy. The disasters of 9/11 and Superstorm Sandy. I have no idea what was going on in the Downstate Suburbs in 1992, but my guess it that it had something to do with anti-welfare (except for people like us) former New York Senator Alphonse D’Amato.
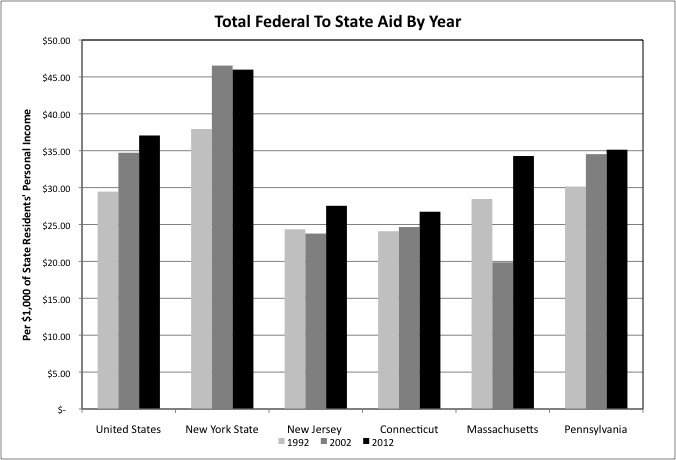
In the far larger category of federal to state aid, payments to New York State soared per $1,000 of state residents’ personal income from 1992 to 2002, but then fell back. While many Governors feel squeezed by falling federal aid in most categories, including for transportation, total federal to state aid has continued to rise overall, thanks to more Medicaid and other health care funding.
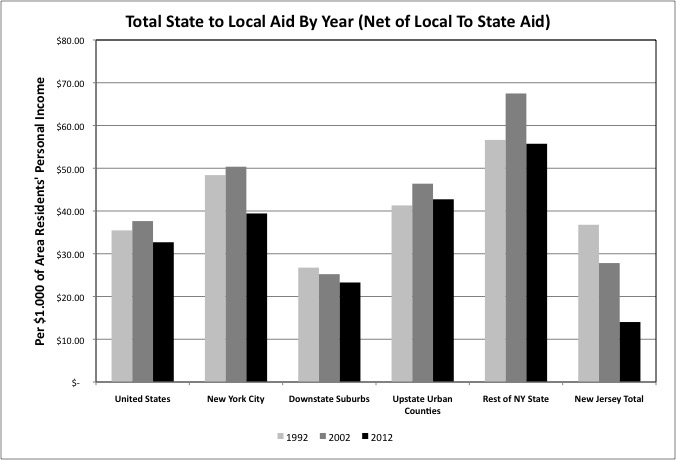
Because states can’t print their own money, state fiscal crises have hit harder – particularly in New Jersey where state to local aid has virtually disappeared. In New York State falling welfare spending has reduced state to local aid to New York City and poorer rural New York. Compared with 1992 the state has cut off tax-funded capital aid to the MTA, and eliminated unrestricted general assistance to New York City. The Downstate Suburbs and Upstate Urban Counties have seen a smaller decrease in state to local aid, as a share of their residents’ personal income.
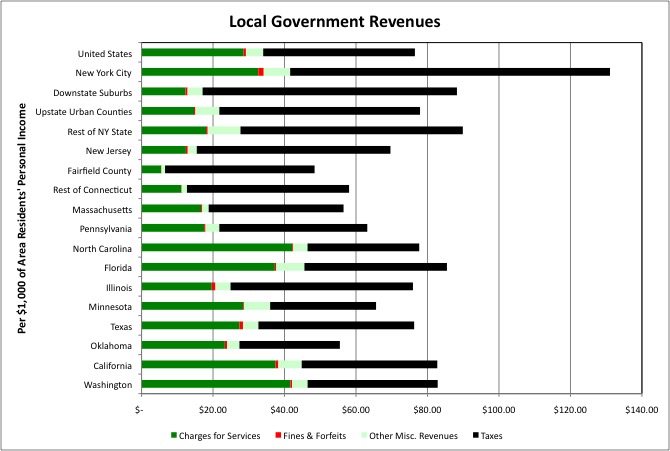
Those in favor of “running the government like a business” will likely be pleased that such a large share of local government revenues are something like business revenues – charges for services and miscellaneous revenues. While New York City’s local tax burden was double the national average as a share of its resident’s personal income, however, its fee and miscellaneous revenue was only slightly higher than the U.S. average. In general charges for services are low, relative to personal income, in the Northeast, including other parts of New York State. Those relocating to low-tax states such as Florida, North Carolina and Texas may find that they have to pay charges, perhaps high ones, for services funded by taxes in the Northeast. Or pay privately for services funded by homeowners associations or contracted individually.
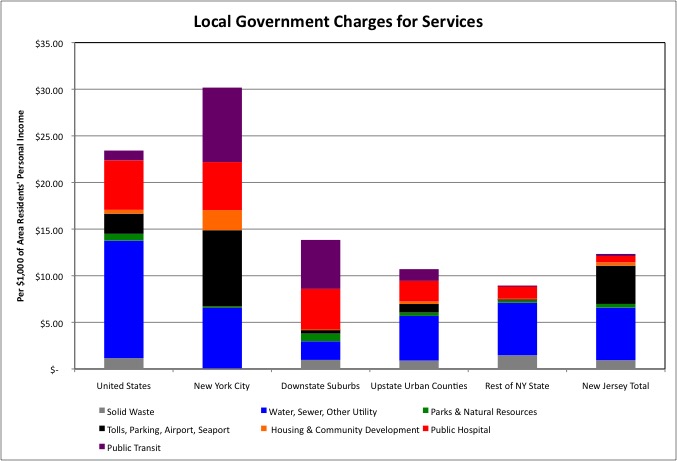
New York City’s “charges for services” revenue is high per $1,000 of its residents’ income in large part because it runs so many enterprises. These include a large mass transit system that, although part of the state-run MTA in reality, is counted as NYC local government by the Census Bureau (for historical reasons). About 600,000 NYC residents live in public housing, and their rent payments are also counted here. Via the Port Authority, NYC local government also includes two airports, with all those airport fees. Because the city is divided by larger waterways and has many major bridges and tunnels, those run by the Port Authority and the Triboro Bridge and Tunnel Authority, NYC local governments also have extensive toll revenues.
On the other hand, while NYC has a large public hospital system, it is mostly funded by Medicaid and other government payments, not by charges to paying customers. Even though most parts of the U.S. don’t have public hospitals at all, NYC’s public hospital charges for services were only about average per $1,000 of its residents’ personal income. For some reason the city itself has decided to provide its teachers and other employees with a health care voucher system rather than having their health care provided by the Health and Hospitals Corporation. Thus taking potential charges for services revenues from public hospitals and giving it to the private hospitals.
While NYC has a water and sewer system for all its residents, that system is very affordable. Across the country some other areas have public electric and gas utilities in addition to water and sewer, increasing their public utility revenues per $1,000 of personal income. NYC’s parks are recreation fees are a low share of its residents’ personal income, compared with the U.S. average. NYC, unlike many other places, does not charge its residents for solid waste collection. Many other areas, in fact, do not provide public trash collection at all, and simply require residents to hire their own private carters, as NYC does for commercial businesses.
Despite extensive mass transit in the NYC suburbs, and Westchester Medical Center and Nassau Medical Center, total fee income is relatively low overall in the Downstate Suburbs, as it is elsewhere in New York State and New Jersey. In some parts of these areas, however, there is no public water supply – water is either from private wells or a private water company (more common in New Jersey).
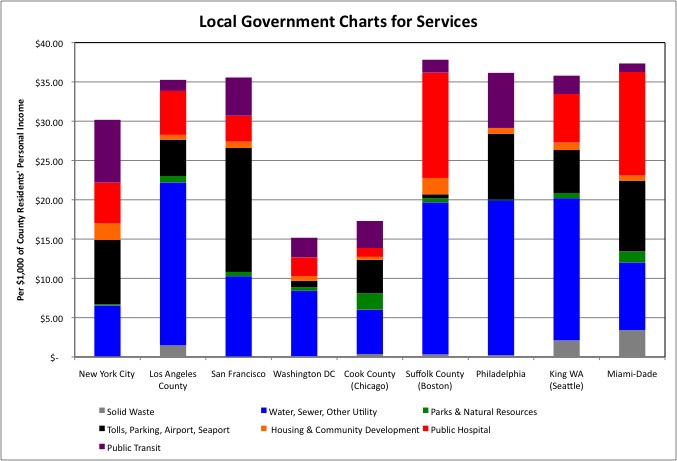
Having a large variety of enterprises with extensive fees is characteristic of major urban counties throughout the U.S. In San Francisco and Los Angeles, the public water utility also provides electricity. Philadelphia runs a public natural gas utility, which some have proposed that it sell to deal with a budget crisis. Many major urban counties have extensive mass transit systems, and the chart might underestimate how much city residents spend on them, because metro area fees are divided by metro area personal income for metro-wide transit agencies.
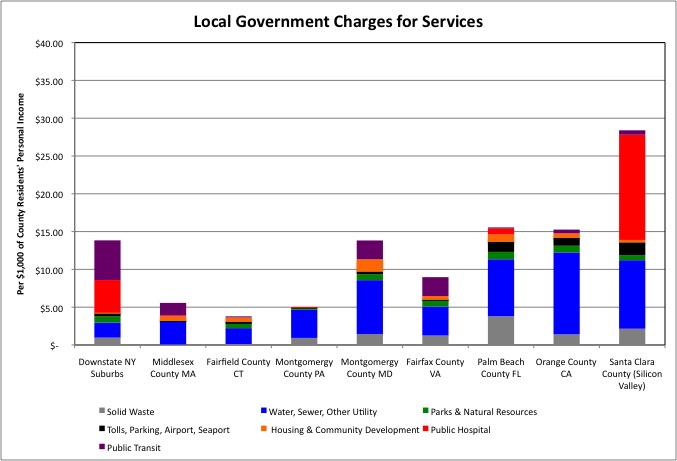
Affluent suburban counties typically have much less public housing and public transit, and are less likely to have public hospitals, than urban areas, and thus collect less in charges for these services. In some areas there is no public water and sewer. Suburban counties, however, are more likely to finance their park and recreation facilities with charges, and generally charge for solid waste collection if they provide the service at all. Water and sewer service tends to be more costly, as a percentage of personal income, in the Sunbelt than in the water-rich Northeast.
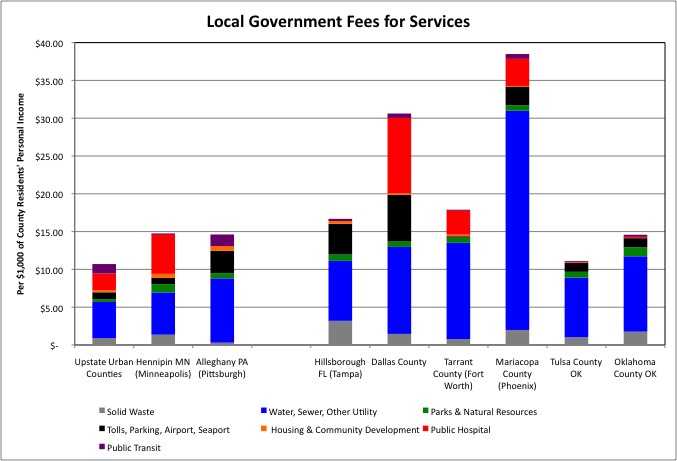
While the Upstate Urban counties have a higher tax burden as a percent of area residents’ personal income than most other Rustbelt and Sunbelt urban counties, local government “charges for services” income is lower there. Water costs are likely to become a growing issue in the west if the current climate situation persists there.
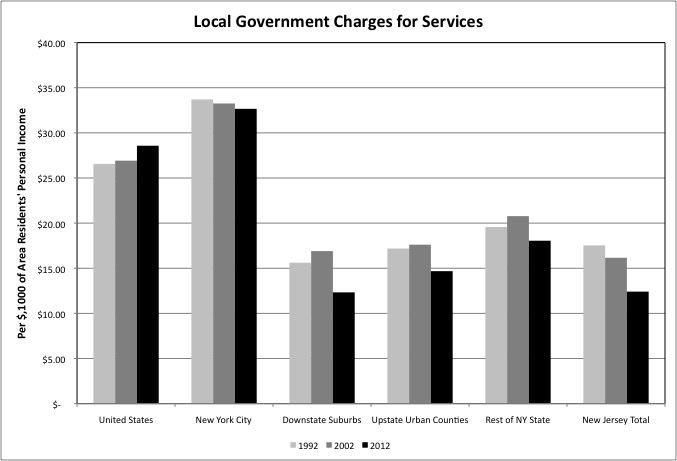
After 20 years of Republican Mayors in a Democratic city, we’ve had ongoing whining about fee increases. The data, however, indicates that NYC fee revenues fell slightly as a percentage of NYC residents’ personal income over the past 20 years, while rising nationally – particularly from FY 2002 to FY 2012. So perhaps that has just been political grandstanding, not supported by the facts. Of course given rising income inequality fees may in fact have become an increasing burden on the non-wealthy. Fare revenues for NYC mass transit, which plunged adjusted for inflation from 1992 to 2002 (with the introduction of the Metrocard and its discounts and free transfers) but has been rising since, may still be a bargain for the affluent, but an increasing burden on those earning the minimum wage.
Fee revenues also fell in other parts of New York State and New Jersey, as a percent of the personal income of those living there. In particular tolls have were held constant for years, after the mid-1990s – at the same time that taxes were being cut.
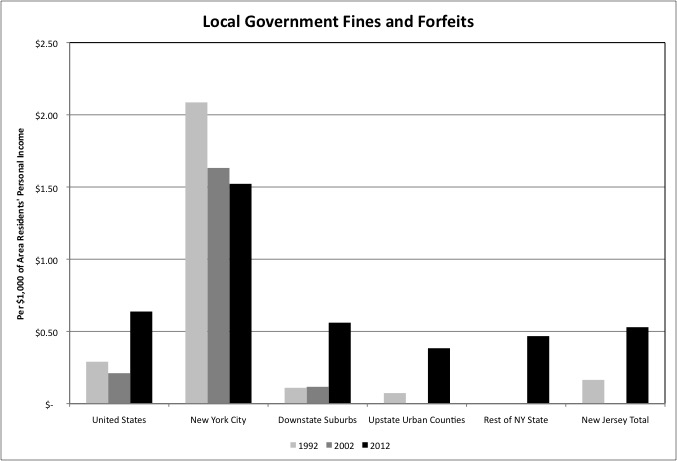
The same may be said of fine and forfeit revenues, which are above average in New York City as a percentage of city residents personal income, but have been falling. According to the Independent Budget Office, parking tickets accounted for $518 million of the $830 million expected to be collected in FY 2014.
http://ibo.nyc.ny.us/cgi-park/?p=733
Because NYC allows people to park on the street for free, more people decide to own and drive motor vehicles than the city can in reality accommodate. The result is illegal parking, and fines. If, on the other hand, the city were to charge people to store their vehicles on public streets overnight, and limit permits to do so to vehicles registered and insured in the area, the result might be fewer cars, less driving, more “charges for services” revenues — and less in fine revenues. In FY 2012 NYC collected 40 cents in parking fee revenues per $1,000 in personal income, above the 18 cents for the U.S. as a whole and about the same as Los Angeles County, but less than San Francisco ($1.84), Washington DC (79 cents), Miami-Dade (85 cents), Suffolk County (49 cents), Hennipin County (Minneapolis) (77 cents), Allegany County (Pittsburgh) (71 cents), and Philadelphia ($3.60). In a very New York-like move Chicago no longer gets parking revenues, as these are paid to Wall Street in exchange for a one-time payment the city spent a few years ago.
http://articles.chicagotribune.com/2013-06-02/opinion/ct-edit-meters-20130602_1_chicago-parking-meters-llc-chicago-city-council-aldermen
Just as a large share of the MTA’s future revenues were also spent in the past, because those future revenues are pledged to pay off debts.
While New York City has decided to collect fines rather than fees for the use of its street space for parking, the NYPD has made the opposite choice with regard to marijuana. Although possession of small amounts of this drug was decriminalized decades ago, the city’s police officers have been less likely to hit violators with tickets – thus increasing fee revenues. And more likely to arrest them, under the bounty system. Arrests just before the end of a shift lead to overtime, and higher pay. In the last year before retirement, each of those arrests could end up costing the city $thousands in higher pension payments over decades of retirement.
In aging and increasingly poor suburbs, the impact of the growing number of fines, with increased penalties for late payments, on poor people moving in has become a national issue. Nationally, and in parts of New York State outside New York City, fine and forfeit revenues have in fact been rising as a percentage of local residents’ personal income. Fine revenues have soared in the Downstate NY Suburbs, though they remain far lower as a percent of personal income than in New York City – because parking is more readily available. The lack of data for FY 2002 for some areas is likely an error, with fine revenues lumped in with other miscellaneous revenues at the time.
The total burden of fines should not be exaggerated. Even in NYC, fine and forfeit revenues only totaled $1.50 per $1,000 of city residents’ personal income. And for those who don’t have cars, or don’t park them legally, fine payments are likely far lower than that.
In future posts on individual local government services, the percentage funded by intergovernmental aid and charges for services rather than local taxes will be indicated. The next post, however, will be an overview of state and local spending in general.