
All across the country, despite an economy that has been officially out of recession for half a decade and record stock prices, Americans are being subjected to one round of state and local government tax increases and/or public service and benefit cuts after another. In many cases the pay and benefits of younger and future public employees has been slashed, and in a few cases even existing employees and retirees have also been hit with reductions in retirement benefits. The reason is the soaring cost of public employee pensions, but that cost should not be soaring at all.
Most public employees are promised a set of retirement benefits when they are hired, in exchange for choosing a public service career, and those benefits are supposed to be paid for gradually over the years when each employee is working. At first the politicians and public employees unions blamed the post 2000 and 2008 stock market crashes, following stock market bubbles, for the harm they were imposing the rest of us. But now that the zero interest rate policies of the Federal Reserve have inflated another bubble, they are silent. The fact is U.S. state and local governments are facing a public employee pension disaster not because of the ups and downs of the stock market, but because of thefts by older generations through retroactive pension increases, spiking and fraud, and taxpayer underfunding of the pensions public employees had been promised to begin with, which is the equivalent of wage theft. The extent of the problem, and the distribution of guilt between public employee unions and past taxpayers, varies from state to state. This post will use Census of Governments data to show who has robbed the future from younger generations, to what extent, with regard to public employee pension.
This is the final post in long series on state and local government finances using Census of Governments data. The analysis shows what happens when the interests and politicians negotiating in secret in statehouses and city halls, making deals that other people and younger generations don’t even know about and yet will be forced to pay for, are all in those deals.
Politicians and interest groups issue press releases all the time, and these form the basis of 99 percent of media reports on state and local government. No one, however, issues a press release when public employee pensions are retroactively increased. No one issues a press release when public employee pensions are underfunded, if the unions get something for those cashing in and moving out as part of the deal. No one issues a press release when a worker receives a very late career promotion, or is credited with working 100 hours a week in the year before retirement, spiking their pension. No one issues a press release when hundreds and hundreds of workers retire with more lucrative disability pensions immediately after having claimed to work 100 hours per week for a year.
There are all kinds of people who had a moral obligation to make sure that what has happened did not happen. Union leaders should have made sure pension promises were properly funded. City and state comptrollers and public actuaries should have protected taxpayers from retroactive pension increases, by forcing those pursuing them to admit publicly, for all to see, what the consequences would be. Governors and state legislators should have considered ordinary taxpayers and public service recipients, not just lobbyists for the already retirement-privileged, when additional pension benefits were secretly requested in exchange for political support. Or, in other states, those seeking lower taxes should have been told that a tax cut associated with underfunded pensions was really a tax deferral, and the politicians should have cared about someone other than those seeking to cash in and move out with as much loot as possible.
This is not a case of “mistakes were made.” We were robbed and lied to, and lied to years after we were robbed long after the getaway had been made. For years, perhaps decades, ordinary people never even knew what had happened. Just a few years ago everyone on the inside was claiming there was no problem, even as they dug the hole deeper to avoid confronting the cost of what they had done for the 20 years before that. And pension actuaries and public comptrollers went along with the lies, in exchange for paychecks and support for re-election and higher office. Pension funds that were supposedly 100 percent funded are now 70, 60, or 50 percent funded. How? The lying continues to this day, particularly here in NYC.
This post follows up on my first post on the Sold Out Future Ranking, which is here and should be read first.
A very large spreadsheet with the data used in this analysis, a series of tables and charts is, linked from that post. It didn’t fit on Room Eight, but if you follow the link to “Saying the Unsaid in New York” you can get it. It includes tables with data on all 50 states and the District of Columbia, along with NYC and the Rest of NY State separately. And data for all available years from 1972 to 2012. Far more than I could hope to summarize here, but here it goes.
As I noted in the post linked above, financial advisors traditionally recommend that those about to retire accumulate enough in savings so that they can live off 4.0% of the initial asset accumulation in the first year, withdrawing a similar amount thereafter. Although in this low interest rate, low return environment, some believe that more assets and spending less than 4.0% annually are required. I also believe that state and local government public employee pension funds should have AT LEAST enough in assets that annual pension benefit payments equal just 4.0% of those assets. Even though the actuaries, and city and state comptroller and legislators, that signed off on all the retroactive pension increases and pension underfunding in the past would probably deny this. Given the situation they have left us in, do you believe them or me?
Public employee pension funds ought to have enough money to pay ALL of the future benefits of those already retired, MOST of the benefits of those soon to retire, and SOME of the benefits of those far from retirement, from the current year to the day they die. Politicians, public employee unions and apologists often argue that a lower level of pension funding is required for the public funds because state and local government pension funds are perpetual, and what isn’t paid for now can be made up later. That is just an excuse to steal from younger generations for forcing them to pay older generations’ taxes as well as their own.
In reality public employee pensions need even more funding than the private sector 4.0% rule would imply, because public employees stop working so young and are retired for so many more years. Decades more, in some cases. For NYC teachers, retroactively awarded full pensions after just 25 years of work at age 55 (after having been promised 30/62 when they were hired), that is one year in retirement for each year worked. For NYC police officers and firefighters, permitted to retire as young as age 40 after just 20 years of work, that could be two years retired for each year of work. Can this even be called “retirement,” which is a few years of leisure after many years of contributing? It is more like slavery-lite, with those who pay for it as the slaves. And that many years of leisure costs far more than the 4.0% rule would allow.
Moreover, the 4.0% rule might make sense for mature pension plans, where the ratio of working to retired beneficiaries fully reflects how few years or work and how many years retired are being promised. But it does not make sense for fast growing pension plans in fast growth states and areas. There a state or local government might have a very small number of retired public employees today, because in a less populated past it once had very few active public employees, and thus a relatively low level of pension benefits paid out. But it might also have many active public employees, because its population has grown, and thus many retired public employees tomorrow. It needs to build up enough assets for those future retirees, despite a low level of current pension benefits.
One state that has avoided a pension crisis, at least so far, is North Carolina. In 2000 its public employee pension benefits paid were just 3.2% of its public employee pension assets. But taxpayers paid into the pension plans nearly one dollar for every dollar those plans paid in benefits. And that state’s public employees contributed nearly as much of their own money to the pension plans as taxpayers had put in. Why were they putting so much money into the pension plans, and building up so much in assets, relative to pension benefit payments at the time? Because in North Carolina they knew they weren’t paying in for the small number of existing retirees. They were paying for the larger number of future retirees who were working at the time. And they acted responsibly. Many fast growth states and areas have been in the same position. They needed their pension benefit payments to average less than 4.0% of their accumulated assets.
Finally, having pension benefits equal 4.0% of pension assets may be a good situation for average years, but not for years in which a stock market bubble temporarily inflates the value of those assets, as I explained here.
https://larrylittlefield.wordpress.com/2013/11/29/pensions-the-nature-of-the-lie/
Just because stock prices have bubbled up doesn’t mean pension funding can be cut, or benefits can be retroactively increased, because those will eventually fall back to normal. Besides, if one sells off stock and bonds to pay pension benefits today, regardless of how high a price is received, what assets will be used to pay the pension benefits of future retirees tomorrow? Public employee pension plans may sell some assets to buy others, but in reality they should never be net sellers unless the number of retired public employees is going to go down in the future. The assets have to keep increasing.
What is needed to pay pension benefits is income, not unrealized paper gains. But just as most stocks toddy don’t have enough earnings, or pay enough in dividends, to support current inflated stock prices, so most pension plans don’t have enough cash investment income to pay benefits. Take the NYC Teacher pension plan, according to its latest Comprehensive Annual Report, page 2.8.
https://trsnyc.org/WebContent/publications/cafr.pdf
That pension plan paid $3.8 billion in benefits in FY 2014, but only had $1.6 billion in interest and dividend income – enough to pay for just 42.0% of the benefits. And that is a fair estimate of how well funded that pension plan was. It also had $8.0 billion increase in the paper value of its investments, but so what? That’s just on paper, and if U.S. interest rates ever rise above zero that paper increase – and that of many years before and after – will disappear.
For all these reasons, the 4.0% rule is a conservative one with regard to public employee pensions, in the current financial environment and given how rich public employee pensions are. In many states, however, public employee pension funds are being drained far faster than that.
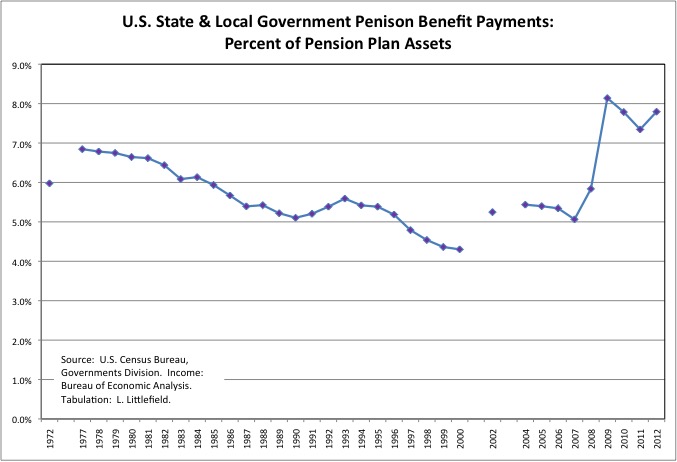
Nationwide, in fact, pension benefit payments have never been less than 4.3% of public employee pension fund assets for all the years that the Census Bureau has data on state and local government pension plans. And benefit payments were only below 5.0% of those assets during the late 1990s stock market bubble. This shows the long-term overpromising and underfunding that has led to today’s pension crisis across the country.
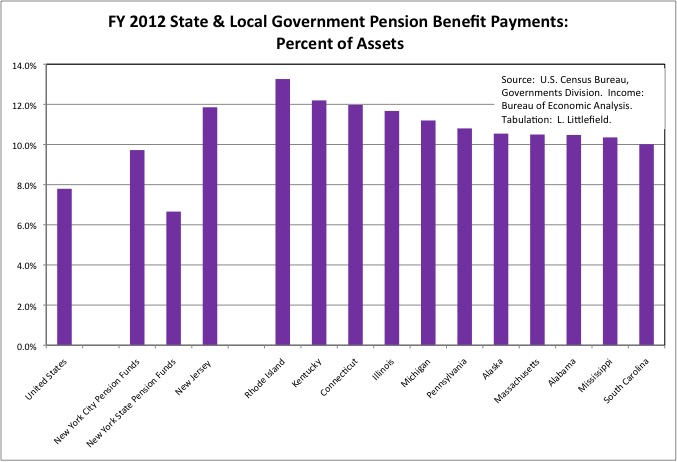
Worst off is Rhode Island, where FY 2012 benefit payments equaled 13.3% of pension assets that year. There was, therefore, only enough money in that state’s public pension funds for just 7.5 more years of benefit payments at the FY 2012 level, and rules on the books that have cause pension benefit payments to increase each year thereafter. Next worst off was Kentucky, with benefit payments equal to 12.2% of pension fund assets, followed by Connecticut at 12.0%, New Jersey at 11.9%, Illinois at 11.7%, Michigan at 11.2%, Pennsylvania at 10.8%, Alaska, Massachusetts and Alabama at 10.5%, Mississippi at 10.4%, and South Carolina at 10.0%.
If New York City, which has its own public employee pension funds, were a separate state, it would have nearly made the worst 10 in FY 2012, with pension benefit payments at 9.7% of assets. NYC was even worse off relative to other states a few years ago, but its taxpayers have been crushed to keep the level of underfunding from getting much worse. NYC also has a larger share of its pension plan assets invested in stocks, so the re-inflating of the stock market bubble from 2009 to the present made its pension funds seem better funded than they are. In 2009, pension benefit payments had equaled 11.8% of NYC pension plan assets.
Meanwhile, in FY 2012 the pension benefit payments of the NY State pension plans, which also cover local governments in the portion of New York State outside New York City, equaled 6.7% of pension plan assets, lower than most states but worse than the 6.4% in FY 2011. The State of New York and local governments elsewhere have been intentionally underfunding the New York State pension plans, allowing taxpayer contributions to be “borrowed” from the fund and paid back later. Perhaps during the next recession, when that burden would be even more crushing but more Generation Greed members would have made it to Florida.
In FY 2012 no state had enough in their state and local government pension plan assets for benefit payments to equal just 4.0% of those assets, but the District of Columbia did. There pension assets equaled just 3.5% of assets, perhaps because the federal government forced a Financial Control Board on the District in 1995 to ensure local politicians could not steal from the future (and then request a federal bailout). And the District’s finances were run responsibly as a result.
http://www.nytimes.com/1995/04/08/us/congress-creates-board-to-oversee-washington-dc.html
Among the best off states are Wisconsin, where FY 2012 pension benefit payments equaled just 5.4% of state and local pension fund assets that year, and North Carolina at 5.7%. Wisconsin is a slow growth state, so its strong position is the result of responsible past policies rather than rapid population growth temporarily covering up pension underfunding.
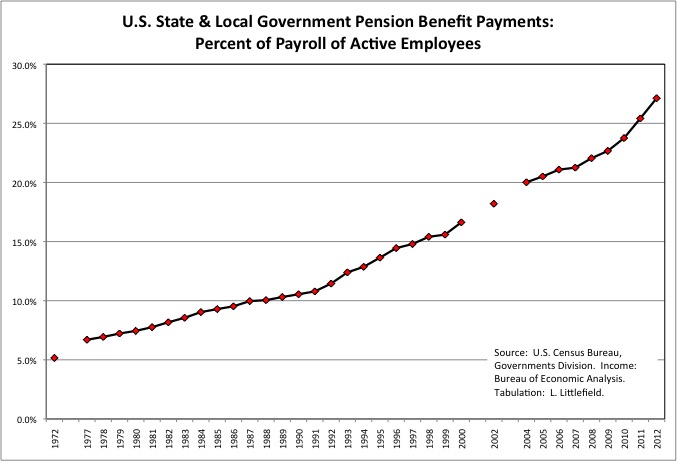
Back in 1972 there were relatively few retired public employees relative to the number working, but more money should have been set aside for the larger number of future retirees. Nationwide, state and local government pension benefit payments soared from just 5.2% of total state and local government wages and salaries that year to 27.1% in FY 2012. And that percentage continues to increase, as more workers retire on richer terms, and money spent on active workers continues to be cut to pay for pension and retiree health benefits.
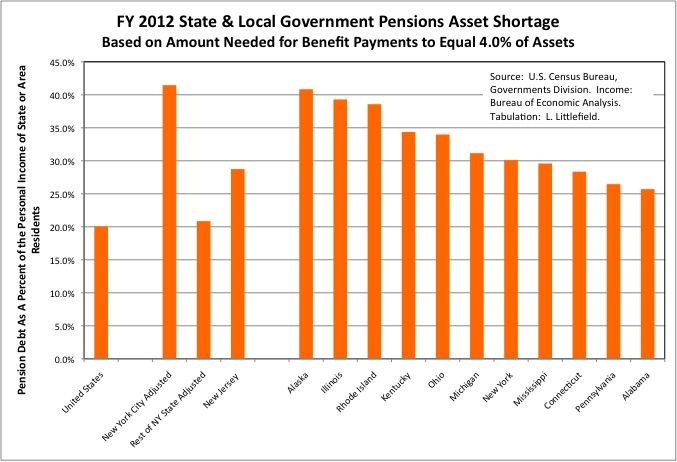
It isn’t just how underfunded a state’s pension public employee pension funds are, but also how much personal income state residents have to pay taxes to get out of the hole. While South Carolina’s public employee pension funds may be severely underfunded, but public employees are a smaller share of the overall economy there than in many other states. Thus the off the books “pension debt” — the additional state and local government pension assets that would be required to got that state’s pension assets high enough so benefit payments equaled just 4.0% of those assets – equaled 23.1% of all South Carolina residents’ personal income in FY 2012. Bad, but not much worse than the U.S. average of 20.2%.
If the City of New York, with its huge number of well-off retired public employees, were a separate state, its off the books “pension debt” would equal 41.5% of the personal income of all city residents, or $197 billion. That would have been worst of off 50 states. It is as if each household in the city had a mortgage equal to more than 40.0% of its personal income, including both cash income and non-wage benefits, that it had to pay for – in extra taxes with no public services in return. If your household’s income is $100,000 and you live in New York City, you owe $41,500 for pension contributions that should have been paid in the past but were not. In addition to the pension contributions you owe for the benefits today’s workers are earning right now.
The rest of New York State’s “pension debt” equaled 20.9% of the personal income of the state residents living outside NYC, or slightly worse than average. That was a total of $121 billion.
The actual worst off state for pension debt was Alaska, where the state and local government pension asset shortage equaled 40.8% of state residents’ personal income in FY 2012. The rest of the worst off were, in order, Illinois at 39.3%, Rhode Island at 38.6%, Kentucky at 34.4%, Ohio at 34.0%, Michigan at 31.2%, Mississippi at 29.6%, Connecticut at 28.4%, Pennsylvania at 26.5%, and Alabama and 25.7%. The list of states where pension crisis have been admitted to has gradually expanded over the years, but I haven’t heard Alabama and Mississippi mentioned. This simple comparison shows that such an admission is sure to come.
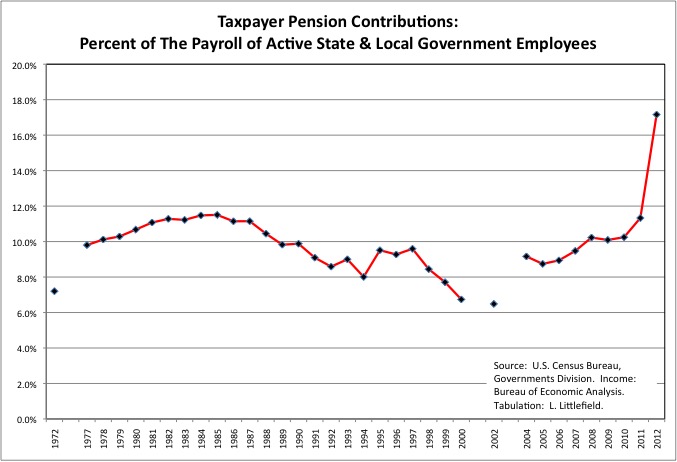
As the disaster has unfolded, state and local taxpayers have had to drastically increase the amount of money they pay into public employee pension funds, cutting the money paid to active workers providing public services today. Taxpayer pension funding had fallen relative to the state and local government payroll during the late 1990s stock market bubble, a time when in many places public employee pensions were retroactively increased as well. Nationwide, in FY 2002 taxpayer pension contributions fell to just 6.5% of active state and local government employee wages and salaries, far below the long-term average of 9.9%. After nearly a decade of sweeping the problem under the rug, however, taxpayer pension contributions jumped to a massive 17.2% of state and local government wages and salaries in FY 2012. The result has been tax increases and public services cuts across the country.
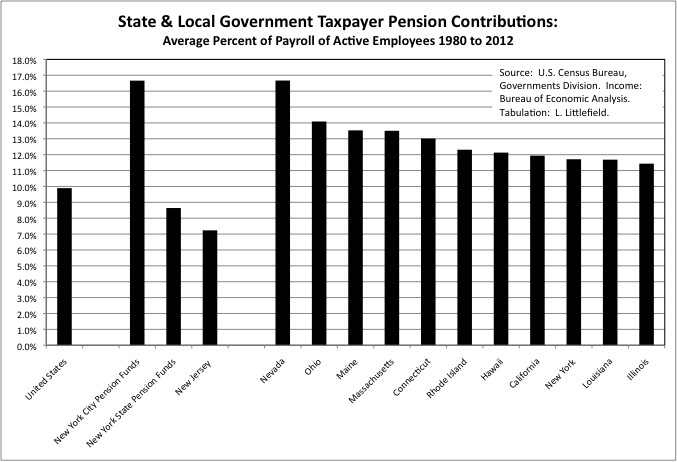
Now it’s one thing for a state or city’s taxpayers to suddenly face a huge pension bill after decades of shorting their pension promises. It’s another for taxpayers to pay enough to provide public employees with far richer retirement benefits than most of them will receive, and still find themselves on the hook for $billions more. That is the situation current and future residents of the New York City find themselves in. NYC taxpayer pension contributions averaged 16.7% of the wages and salaries of active public employees from 1980 to 2012. Only Nevada taxpayers kicked in more. But in Nevada public employees do not get Social Security.
That is true of many public employees in many states. In New York City, on the other hand, taxpayers kicked in an additional 6.2% of payroll for all its public employees to get Social Security, over and above the 16.7% of payroll for pensions. More than anywhere else. Far more.
Other states where taxpayers have contributed much more than average to public employee pension funds, on average, over the years from FY 1980 to FY 2012 are Ohio, at 14.1% of payroll, Maine at 13.5%, Massachusetts at 13.5%, Connecticut at 13.0%, Rhode Island at 12.3%, Hawaii at 12.1%, California at 11.9%, Louisiana at 11.7%, and Illinois at 11.4%. In some of these states, notably Illinois, taxpayers paid a great deal for public employee pensions but did not always have to pay for Social Security, which many those retirees do not and will not get. That is a big difference from New York City.
Where did taxpayers pay less for public employee pensions over the years? The average taxpayer contribution for New York State pension funds, which also cover local government employees in the portion of the state outside New York City, equaled just 8.6% of payroll from FY 1980 to FY 2012, while New Jersey’s average was just 7.2%. Other notably low states include Texas at 6.8% of payroll on average, New Hampshire at 4.1%, Kansas at 4.9%, and Arizona at 5.5%.
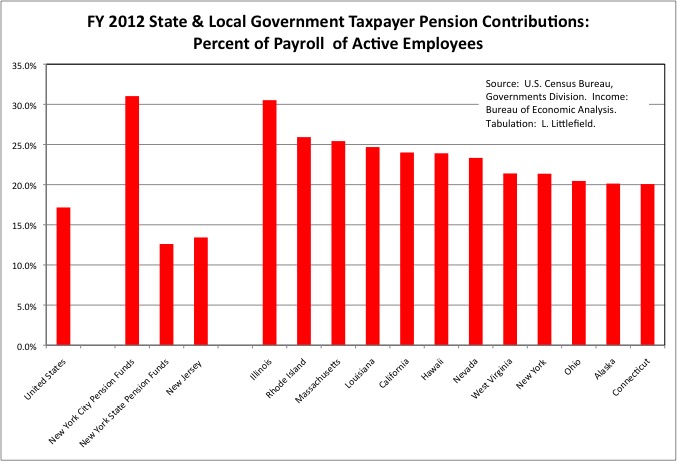
Many of the states where taxpayers paid the most in the past are also among the states where taxpayers have been forced to increase their pension contributions the most over the past few years. New York City’s taxpayer pension contributions soared to 31.0% of public employee wages and salaries in FY 2012. Compare with that with your employer’s contribution to your 401K. If NYC were a separate state that would have been the most among states. Despite their own pension funding problems, the New York State pension plans were below average, with taxpayer pension contributions at 12.6% of public employee wages and salaries in FY 2012. And despite a full-on pension funding disaster New Jersey’s taxpayer pension contributions were also below average at 13.4% of payroll that year.
The states were taxpayers were paying the most into pension plans as a percent of state and local government payroll, and thus getting the least for the tax dollar in public services, were (in order) Illinois at 30.5%, or nearly as much as NYC, Rhode Island at 25.9%, Massachusetts at 25.4%, Louisiana at 24.7%, California at 24.4%, Hawaii at 23.9%, Nevada at 23.3%, West Virginia at 21.4%, Ohio at 20.5%, Alaska at 20.1%, and Connecticut at 20.1%.
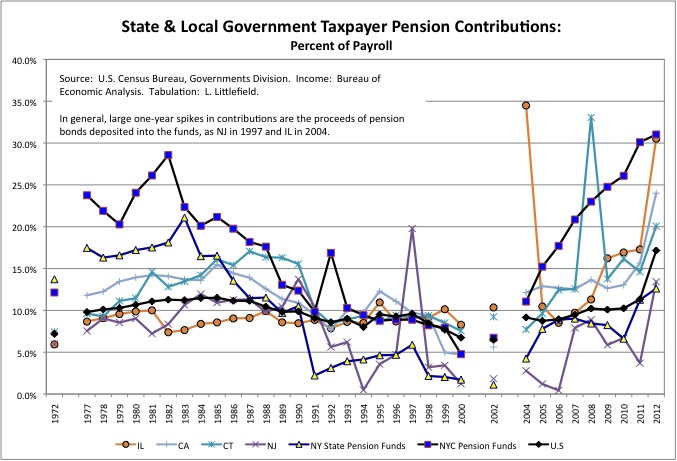
New York City taxpayers are being hit hard now despite consistently putting more into the city’s public employee pension funds as percent of public employee wages and salaries than the U.S. average, taxpayers paying for the New York State pension funds (which also cover local government employees in the part of NY State outside NYC), or New Jersey taxpayers. Or, for that matter, Illinois, California or Connecticut taxpayers. NYC did cut its taxpayer pension contributions for a few years around the year 2000, as part of the irresponsible Mayor Giuliani for Senate, State Comptroller McCall for Governor, and Governor Pataki for President pension deals that also drastically increased pension benefits. Whatever NYC taxpayers should have put in 15 years ago, however, they have long since paid back many times over.
In fact, NYC’s taxpayer pension contributions were higher in FY 2012 than they had been back at the prior peak in the early 1980s, or in 1977 when soaring pension payments and interest on debts caused NYC public services to collapse. Only soaring tax revenues due to a bubble economy are postponing a repeat of that collapse right now. Even as it is, however, the city and state have no money for a new MTA capital plan for the maintenance of the metropolitan area transit system. And it will get much worse when the latest bubble deflates.
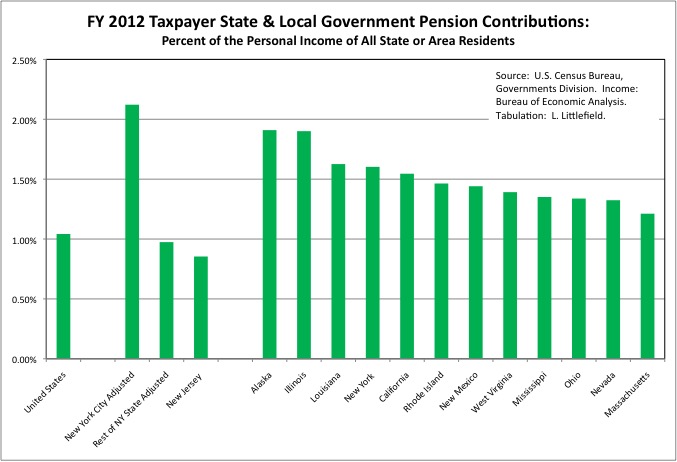
Hey, but at least New York City residents are rich, so all those taxpayer pension contributions are a small percent of their own incomes, right? Wrong. In FY 2012 taxpayer contributions to NYC pension funds, plus the city’s share of state contributions to state pension funds, equaled 2.12% of city residents’ total personal income. That was more than double the U.S. average of 1.04%, the average for New Jersey at 0.85%, and the average for the Rest of New York State at 0.97%. New York City would have been the worst among states by that measure in FY 2012 if it were a separate state. The majority of NYC residents are likely paying for of their incomes for public employee pensions (in taxes or services forgone) than they are saving for their own retirement.
Among states proper, Alaska is the one where state and local government taxpayer contributions absorbed the highest share of state residents’ personal income in FY 2012. But although that state’s tax collections are sky-high relative to its residents personal income, as discussed previously most of those taxes are on oil extraction, while state residents pay very little. In reality the state where state residents were most burdened by taxpayer contributions to public employee pension funds in FY 2012 was Illinois, at 1.9% of that state residents’ personal income, a burden that is set to soar even more. Next was Louisiana at 1.63%, California at 1.55%, New Mexico at 1.44%, West Virginia at 1.39%, Mississippi at 1.35%, Ohio at 1.34%, Nevada at 1.32%, and Massachusetts at 1.21%.
New Jersey politicians are apparently unwilling to force taxpayers to pay in even as much of their incomes in taxes for pensions at the U.S. average. Confronted with the tax increases and service cuts that would be required, that state continues to refuse to fully fund its public employee pensions. Connecticut taxpayers were only putting in an average amount as a share of their incomes in FY 2012, despite one of the biggest underfunding problems in the country, but may now be forced to pay much more to get out of the hole.
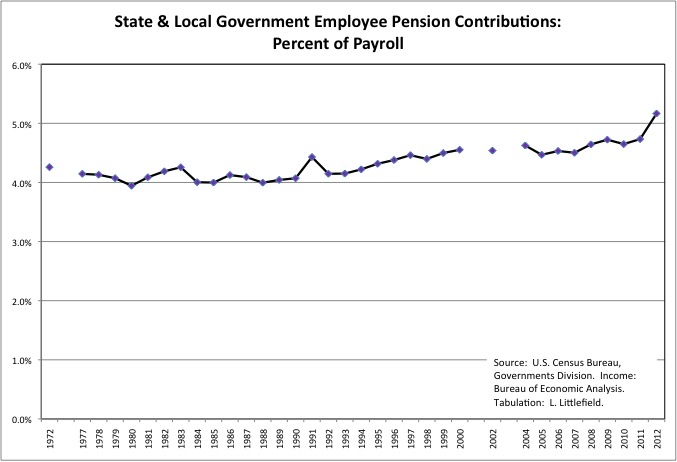
So how much have state and local government employees contributed to their own pensions? Nationally, the average for the years from FY 1980 to FY 2012 had been 4.4% of their wages and salaries, but in recent years as the pension crisis has been revealed the employees – particularly new public employees – have been forced to pay in more. From just 4.0% of payroll in 1990s, before the era of pension underfunding and retroactive pension increases began, employee pension contributions increased to 5.2% of wages and salaries in FY 2012.
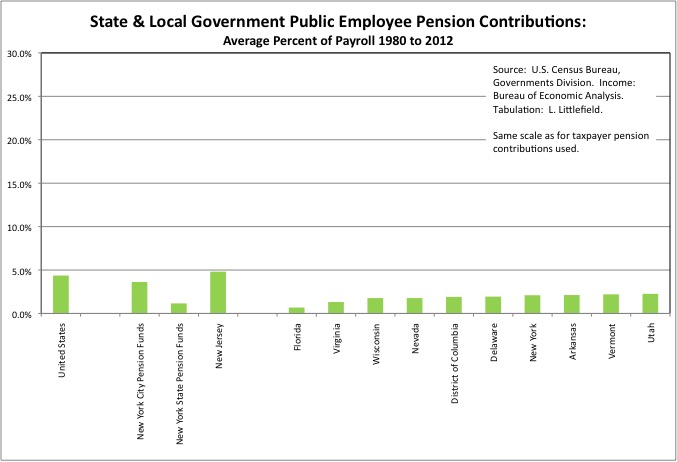
While New Jersey taxpayers have put in less than average in pension contributions, New Jersey’s public employees have put in more than average, at 4.8% of payroll on average from FY 1980 to FY 2012. Even there, however, public employee pension contributions are less than taxpayer pension contributions for the period.
NYC public employees contributed 3.6% of their pay to their own pensions according to Census Bureau data, but this is misleading. For one thing, for decades NYC taxpayers paid for what was reported as the “employee” contributions to the NYC police and fire pension funds. For another, under a 1995 deal members of the general NYC pension fund (NYCERS) were allowed to retire years earlier after “buying” additional pension benefits at 1.85% of their pay: the added years of retirement cost the city far more than that in added pension payments and retiree health care than the extra money the employees had contributed. Finally, a large, one-time contribution to NYCERS in 1991, presumably the proceeds of a pension bond, were recorded by the Bureau as an employee contribution. It was correctly recorded for the NYC Teacher pension fund as a taxpayer contribution. In reality, NYC public employees, aside from those in Tier V and VI, have paid less for their own pensions than those just about anywhere.
In the NY State pension system, employee pension contributions equaled just 1.2% of payroll on average from FY 1980 to FY 2012, which would have been the second lowest among states behind Florida. Other states where public employees don’t contribute very much of their pay for their own pensions include Virginia (1.3%), Wisconsin (1.8%), Nevada (1.8%), the District of Columbia (1.9%), Delaware (1.9%), Arkansas (2.1%), Vermont (2.2%) and Utah (2.3%). Most of these states nonetheless have relatively well-funded pension funds, because of more reasonable pension benefits, fewer or no retroactive pension increases, and less disability and other pension fraud.
On the other hand, in many of the states with big pension underfunding crises public employees have contributed a great deal of their own pay to the pension plans over the FY 1980 to FY 2012 period. These include number one Ohio at 9.0%, New Mexico at 7.5%, Massachusetts at 7.1%, Illinois at 7.0%, and Rhode Island at 7.1%, Kentucky at 6.2%, Louisiana at 6.1%, and California at 6.0%. In these states taxpayer underfunding and/or retroactive pension increases must be the source of the problem. Bear in mind, however, that in some of these states, some or all of the employees may not have to pay their 6.2% Social Security taxes (but also will not get Social Security). And in some cases what is reported as employee contributions may actually be paid by taxpayers, as in NYC. That also happens a great deal in California. If the taxpayers are paying, why not just call those pension contributions taxpayer contributions? Because the unions want to be able to say, in response to any criticism, that their pensioners paid for their own pensions, even though they didn’t.
As a final factor in how public employee pension funds got so deep in the hole, how high are benefit payments? In my compilation of Census Bureau public employee pension data for FY 1992, 2002, and 2012,
https://larrylittlefield.wordpress.com/2014/06/22/public-employee-pensions-in-2012-2002-and-1993-census-bureau-data/
I showed that the New York City pension funds had just 1.27 active workers earning benefits for each retiree being paid benefits. Taking all state and local pension funds in each state together Michigan (0.89) and Alaska (0.91) each had more retirees than active workers, but otherwise only Rhode Island (1.13) and Pennsylvania (1.20) had more retirement and less work than New York City.
The additional measure we have via the Census of Governments finance data is pension benefit payments as a percent of the wages and salaries of active public employees.
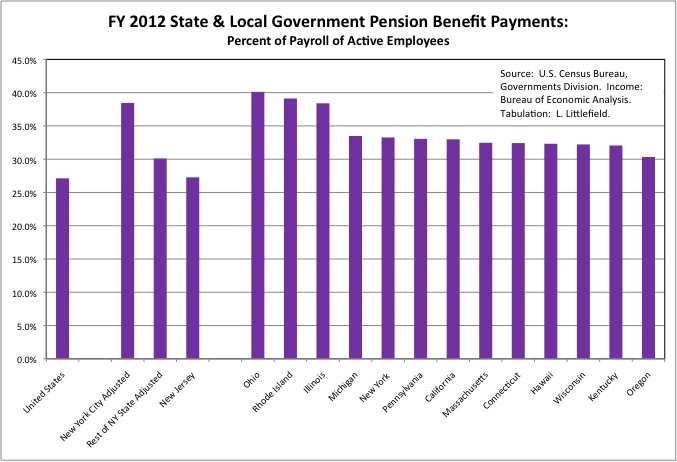
In FY 2012 the pension benefits of retired NYC public employees equaled 38.5% of the payroll of active NYC public employees, which would have been third highest behind Ohio (40.1%) and Rhode Island (39.1%). Other states where pension benefit payments are very high relative to payroll for public employees still on the job are Illinois (38.4%), Pennsylvania (33.1%), California (33.0%), Massachusetts (32.5%), and Connecticut (32.4%). The ratio for the New York State pension plans was 30.1%, which would have been the 12th most costly.
To put these figures in perspective, if every public employee worked long enough to become vested with a full pension, at two years worked for each year in retirement, with an average pension benefit payment equal to half (50.0%) of the average pay of workers on the job, then pension benefit payments would equal 25.0% of payroll. Few private sector workers have an employer-funded retirement plan that is anywhere near that costly and lucrative. But public employees in these states have pensions that are far more lucrative and costly. Though in some of them, remember, some or all of them don’t get Social Security.
The ratio for New Jersey was 27.3%, about the same as the U.S. average of 27.1%. So New Jersey public employees have contributed more of their payroll over the years to their pension funds than the U.S. average, for pensions that are about as costly as the U.S. average for public employees, and yet New Jersey’s public employee pension plans are going under due to taxpayer underfunding. Whereas in New York City is taxpayers who are virtually blameless and the unions and the politicians they control who get the blame.
What a difference. You see a radically different distribution of the pension guilt on the two sides of the Hudson River. Not coincidently, for decades New Jersey had far lower tax burden as a percent of its residents’ personal income, and far better public services (including schools), than New York City, which has twice been pillaged by the unions via retroactive pension increases. New Jersey doesn’t want to face reality and give those advantages up. Yet things are likely to get even worse, much worse, for New York City residents as well. Meanwhile, the New Jersey taxpayers that benefitted in the past, and the NYC public employees that are cashing in their retroactive pension increases and moving out, are heading for Florida in droves.
This pension disaster is just getting started. People won’t really know where they stand until the next stock market downtown exposes the lie of double counting average future investment returns from inflated stock and bond values, by eliminating the inflated stock and bond values. When elected officials are willing to stop sweeping the pension funding disaster under the rug, or become unable to keep doing so, state and local government and politics become about who will lose what to pay for past pensions, and nothing else. And to the extent that politicians are talking about anything else right now, or making and promises or increasing benefits and services in any way whatsoever, it is just misdirection and the theft of even more from the future and those who will live in it. The truth is, we are broke.
What is worse, just as the federal debt is on top of state and local government debt, federal underfunding of Social Security – which is virtually the only retirement income most private sector workers will receive – is on top of state and local government pension underfunding, as I showed here.
https://larrylittlefield.wordpress.com/2015/01/10/reprised-social-security-the-generational-betrayal/
The ordinary people of New York City, and the young adults who have moved here, deserve better. They have been willing to shoulder something close to the nation’s highest tax burden. They have accepted less in services and benefits so more of this money could go to the nation’s highest taxpayer pension contributions. And they are not among those who have voted Republican at the national level, and thus in favor of federal tax cuts and more unfunded benefits for today’s seniors, all funded by debts. And yet they are no better off thanks the nation’s most unjust, entitled and rapacious public employee unions, and apparently something close to its most unjust politicians (Illinois politicians are giving them a good run for the money). In fact, their future is the most sold out in the U.S., a country where the future has been diminished in general by the self-dealing of Generation Greed.
https://larrylittlefield.wordpress.com/2014/08/10/generational-equity-and-the-legacy-of-todays-politicians-update/