
As I noted in this post,
https://larrylittlefield.wordpress.com/2015/07/20/census-bureau-education-finance-data-fy-2013/
when I compare per student public school spending with the U.S. average, I adjust the figures for NYC, other parts of Downstate NYC and New Jersey downward to adjust for the higher average wage level here. Because if private sector workers are earning more here, that drives up the local cost of living, and NYC teachers and other public employees also have to earn more than the U.S. average to keep up. The figure I use for adjustment excludes the overpaid Financial Activities sector, which is not part of any real labor market. The adjustment, however, has been shrinking. While New York’s public sector workers continue to get better off, mostly in the form of retroactive pension increases for those cashing in and moving out, the private sector workers who have to pay for this have been getting relatively worse off. Merely alluded to in the post on public school finance data for FY 2013, I decided this trend deserved a post of its own.
According to Employment and Wages data from the Bureau of Labor Statistics, the mean payroll per private sector worker for those working in Downstate NY (NYC plus Westchester, Rockland, Putnam, Nassau and Suffolk), with the Finance Activities sector excluded, was 24.0% higher than the U.S. average in 2001 (and 25.1% above average in 2007), but just 21.6% above average in 2014.
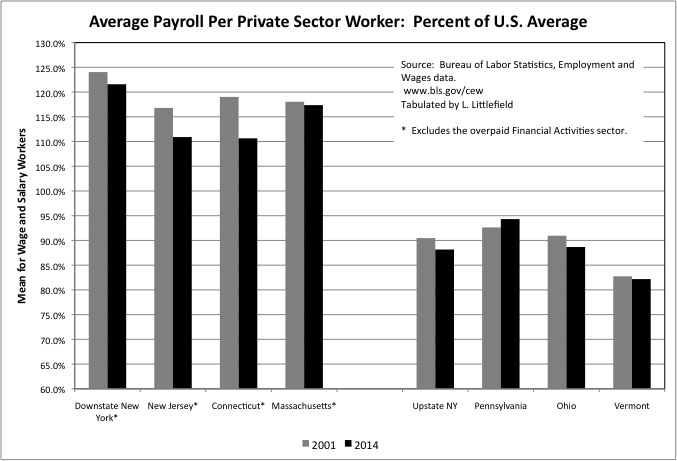
That is a big drop, but other parts of the tri-state saw larger drops relative to the U.S. average. In New Jersey, mean payroll per private sector worker excluding finance fell from 16.8% above average in 2001 to 10.9% above average in 2014. In Connecticut the decrease was from 19.0% above average to 10.6% above average. Note that this is data by place of work – many residents of New Jersey and Connecticut hold the higher paid jobs in Downstate NY, most of which are in Manhattan.
Upstate New York hasn’t been a high wage area for a long time, but it is even lower wage than in the past. There the payroll per private sector worker was 9.5% below the U.S. average in 2001, but 11.8% below the U.S. average in 2014.
The period from 2001 to 2014, moreover, was hardly a great one for average wages and salaries in the U.S. as a whole.
For Downstate New York, however, these figures understate the dwindling advantage, and growing disadvantage, of the area’s private sector workers. Because wage and salary employees are the lucky ones. A soaring share of the labor force, particularly among those in younger generations, are not even considered employees. The are self employed, freelancers, and contract laborers without benefits, without unemployment insurance, and forced to pay both halves of the payroll tax.
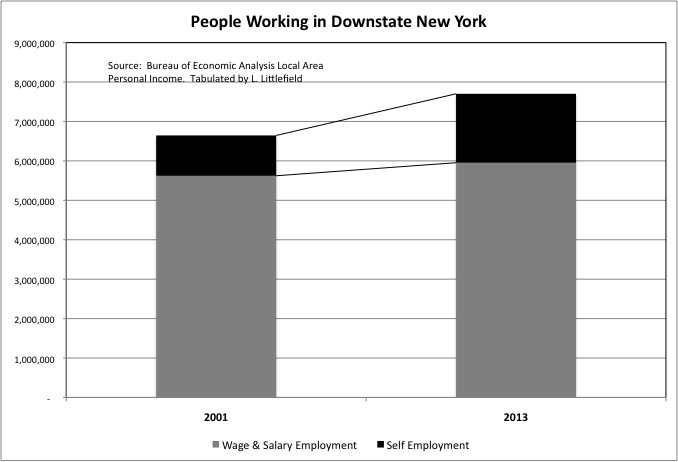
The self-employed accounted for 15.4% of those working in Downstate New York in 2001, but by 2013 this figure had soared to 22.7%. But it is much higher among younger generations, and in the places where young workers are concentrated. The self-employed, for example, account for 34.7% of those working in Brooklyn and 31.0% of those employed in Queens.
At once time the self-employed were doctors and lawyers with their own practices, partners in financial and consulting firms, or at least the proprietors of their own small businesses. Today they are more likely to be simply laborers.
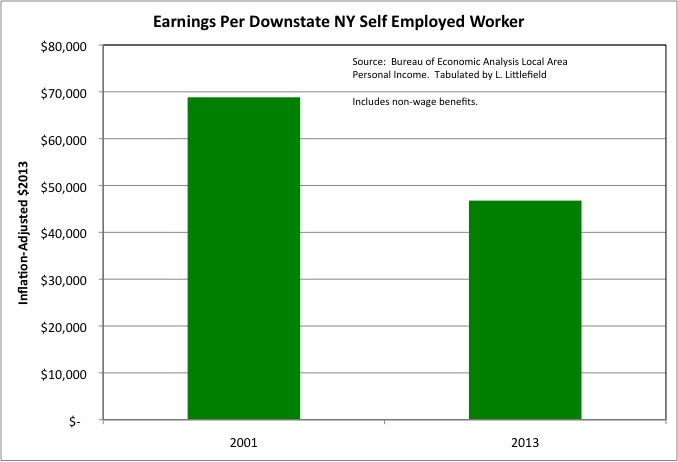
Which is why in Downstate New York, after adjustment for inflation self-employment income per self-employed worker fell from $68,837 in 2001 to $46,777 in 2013. There was, in fact, a decrease even without an adjustment for inflation.
Concentrated in a few places such as NYC and Los Angeles a decade ago, the trend of making middle, moderate and low-wage workers “independent contractors” without benefits is now spreading across the country.
Even worse off than the self-employed with on-the-books income, and thus captured by Bureau of Economic Analysis data, are the interns, working for nothing for a period of time in the hopes of getting a job (or at least a self-employment check) later. These are the people who have to come up with more in tax dollars, or cope with cuts in public services, to pay for the rising cost of public employees.
In New York City, moreover, these less well off young private sector workers tend not to benefit from public housing, rent regulated housing, Mitchell-Lama housing, or owner-occupied housing purchased years ago at lower prices and benefitting from a lower property tax rate. So they are the ones squeezed by New York City’s soaring market rate rents. In this trend, as well, the rest of the country, though behind NYC, is starting to catch up. According to the Wall Street Journal
http://www.wsj.com/articles/rising-rents-outpace-wages-in-wide-swaths-of-the-u-s-1438117026
“The cost of renting a home is rising faster than wages across wide swaths of the country, a problem that has become especially acute in the past year, putting a big squeeze on many household budgets. The situation is particularly noticeable in long-pricey areas across the West and in big cities like New York, where the average household pays more than 40% of its gross income for rent, according to online real-estate database Zillow. But rising prices also have spilled over into cities like Denver, Atlanta and Nashville. Much of the problem is attributable to simple supply and demand. The job market has improved and millennials are entering the labor pool in force, boosting household formation. But in a structural shift for the real-estate market, new households are much more likely to be renters than buyers.”
Those in younger generations know they are poorer, and they can’t afford the operating and commuter costs of Generation Greed’s costly far-flung McMansions and SUVs. (Generation Greed couldn’t afford them either, but is seeking ways to make those coming after pay). So they try to adjust by living with less, packing into smaller spaces in closer locations. But as I noted here
https://larrylittlefield.wordpress.com/2014/11/23/the-new-urban-crisis/
there aren’t enough economically viable urban locations to go around. And many cities and streetcar suburbs are burdened with high taxes and inferior public services as a result of debts and pension obligations left behind by those who cashed in and moved out. Including NYC.
So the real estate industry and the public sector special interests keep squeezing New York City’s serfs on the cost of living side, even as employers keep squeezing the wage and benefit side, with no end is sight. They are insatiable, with empathy, and incapable even of enlightened, low-term self-interest – which takes other people’s interests into account if only to prevent a backlash. Only their control of the politicians and the media prevents the serfs from realizing what is going on, and the backlash from occurring.
So why is there no fiscal crisis in New York City? Because of another bubble on Wall Street.
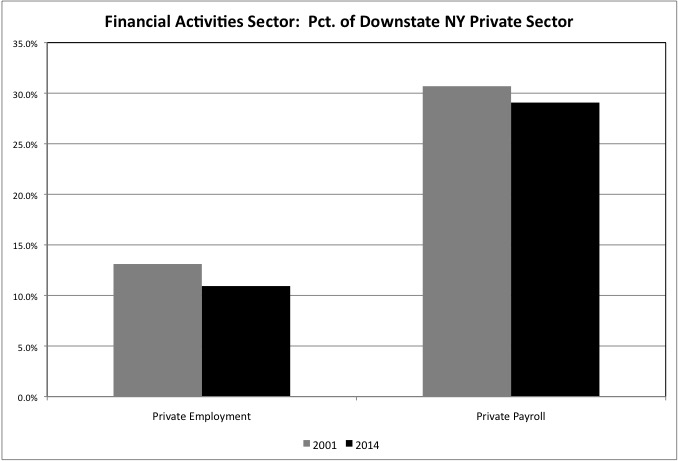
The Financial Activities sector is less and less important to the city’s economy. It accounted for 10.9% of private sector wage and salary workers in Downstate NY in 2014, down from 13.1% in 2000. And, as mentioned, many who hold those jobs in NY are residents of NJ and Connecticut. At the same time, however, this sector is nearly as important as before for the city and state tax base. It accounted for 29.1% of private sector payroll in 2014, down only slightly from the 30.7% in the year 2001.
Yet another bubble is allowing Wall Street to rip off the world, and that is limiting the damage from the way the political/union class ripping off the serfs. For now. It is only when asset prices correct back to normal that the reality will be exposed.