
All of the many available measures of employment show a stunning increase in the number of people working in New York City during the past 15 years, far reversing all the jobs lost in the 1970s. One of the least cited measures is employment based on the now-defunct Census of Population long form and American Community Survey, which among other things ask workers where they work. This data is generally tabulated based on where people live, but when tabulated by place of work it is the most accurate measure of employment at the local level. Administrative records and surveys of organizations often place the employment for multiple establishments at a single location, either the headquarters or even an accountant’s office. Government agencies are particularly bad at reporting where their employees are. And most measures of private sector employment only include wage and salary employees, whereas a rising share of the workforce is self-employed – particularly in New York City.
Place of work data from surveys of households, as reported by the workers themselves, shows that the number working in New York City fell from more than 3.5 million in 1970 to slightly over 3.3 million in 1980. After increasing by more than 410,000 during the 1980s, to more than 3.7 million in 1990, the number of people working in the city increased little during the 1990s, as the deep early 1990s recession nearly offset the substantial late 1990s boom. By 2010, however, the number of people working in New York City had soared to 4.25 million, an increase of nearly 500,000 since 2000, and it has likely continued to soar since.
A summary of this data may be found in this spreadsheet.
It should be noted that the “2010” data from the American Community Survey is actually the average for the five years from 2006 to 2010. The annual ACS sample size is too small to provide census tract level data based on the survey from just one year. The next release will be 2007 to 2011. Think of it as a five-year moving average. But I’ll use “2010” as the data year for short. In the prior census years, more questions were included in the Census of Population, in a long form that was sent to one in six households.
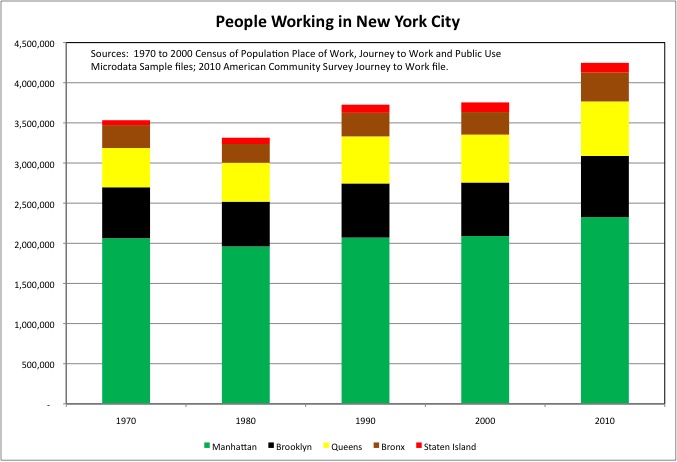
The data show that as of 2010 more than half of those working in New York City are (and previously were) working in Manhattan, and the number working in Manhattan increased by 364,200 (18.6%) from 1980 to 2010 after falling 102,280 (5.0%) from 1970 to 1980. The 2010 total of 2.34 million, as measured by this data source, includes both employees and the self-employed. It includes those who both live and work in Manhattan, those who commute in, and also those who mostly work elsewhere but who were in Manhattan on business during the Census/American Community Survey week. The question, posed to workers, is “where did you work” and this data source generally shows small numbers of people from around the country working in Manhattan.
Employment gains have been faster elsewhere in New York City. The number of people working on Staten Island doubled from 1970 to 2010, from about 60,700 to 121,900, including an increase from 1970 to 1980, a time that the number of people working elsewhere in the city was falling. But this borough added very few jobs from 2000 to 2010. Most other data sources show far less employment on Staten Island, since many of those working on The Rock are either city employees of agencies with headquarters elsewhere, or are elf-employed small business owners. Both of these groups are captured by this data source, and accurately assigned to Staten Island.
The number of people working in Queens fell very little from 1970 to 1980, and as a result is it up 188,942 jobs (38.7%) from 1970 to 2010. That is nearly as large an increase over 40 years as Manhattan in an absolute sense, and far more as a percent. In 2010 about 677,500 people worked in Queens.
The big turnaround, however, was in the Bronx and Brooklyn. The number of people working in the Bronx fell by about 51,800 jobs (18.1%) from 1970 to 1980, but increased by about 125,200 (53.5%) from 1980 to 2010. The 2010 total was about 360,000.
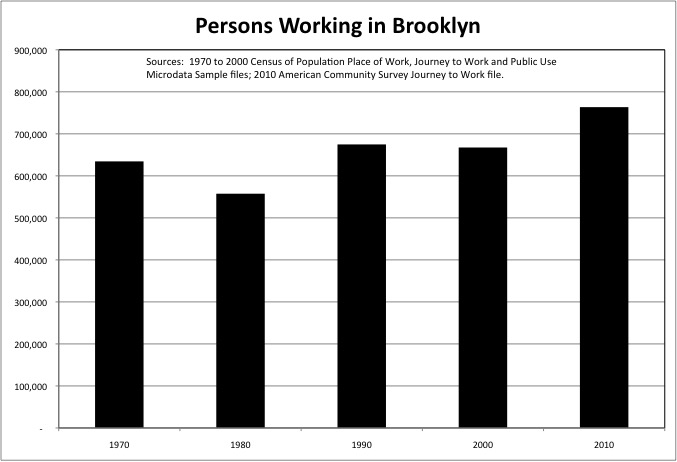
The number of people working in Brooklyn fell by 76,900 (12.1%) from 1970 to 1980, and then increased by about 206,000 (37.0%) from 1980 to 2010. About 763,600 people worked in Brooklyn that year.
I wondered where in Brooklyn the number of people working was going up. During the 1960s and 1970s Brooklyn’s factories closed en-masse, the Navy Yard was closed by the federal government and turned over the City of New York, and the metro area seaport relocated to New Jersey, leading to a large decrease in employment in the borough’s industrial areas. Downtown Brooklyn lost a number of major stores and entertainment venues during that period. Are these previous areas of concentrated employment re-filling? Or are the additional workers spread out in a borough where self-employment has been soaring, perhaps reflecting people working at home or down at the local coffee shop?
One of the advantages of household-based Place of Work data is that it provides at least somewhat useful information at the very local level, where some of the largest places of work are likely to be the local school, police precinct, and stores on the local “main street,” with many self-employed and government workers. One of my daughters set up the blog “Saying the Unsaid in New York” for me; and I asked the other one to provide maps of Brooklyn employment using data I provided. The first map shows the density of people (per acre) working in Brooklyn by Census Tract in 2010.
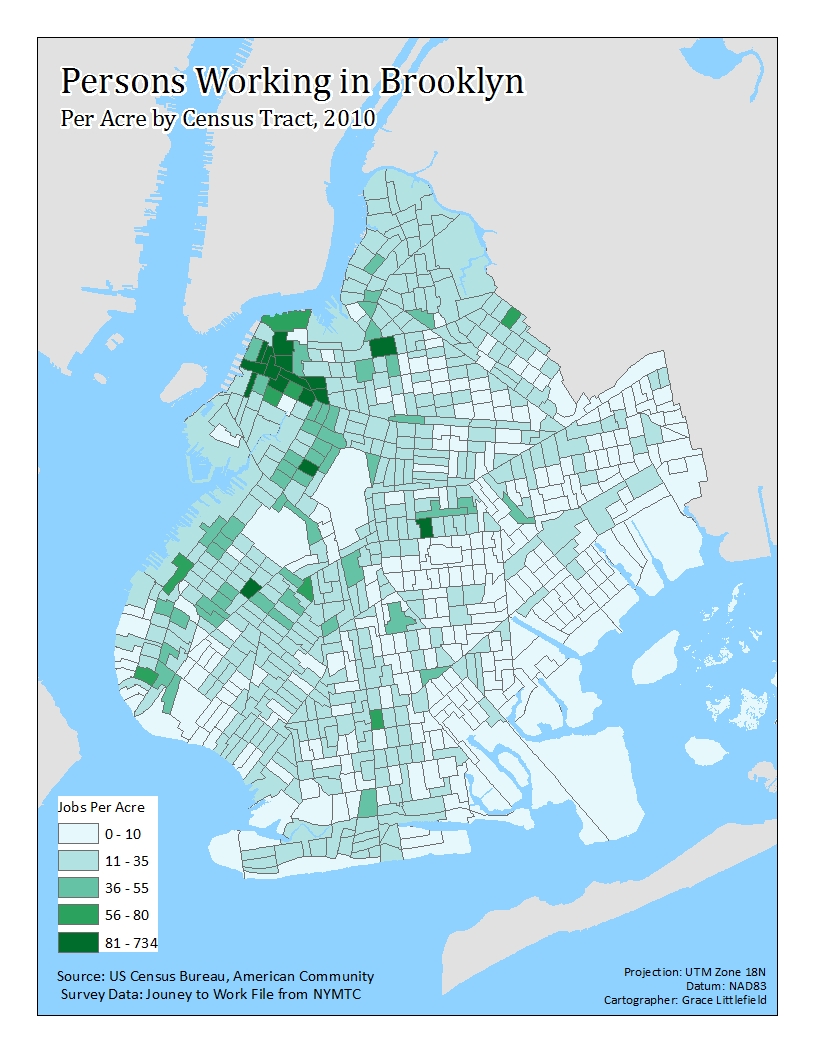
Census tracts indicated by each of the five shades on the map account for approximately one-fifth of the total employment in the borough. The map shows a large concentration of employment in Downtown Brooklyn and Fulton Ferry, at several major hospital complexes such as Methodist, Maimonides, and Downstate Medical Center, and in parts of Sunset Park. It also shows a large concentration of employment off Flushing Avenue southeast of the Brooklyn Navy Yard.
Most of the borough’s industrial areas, however, have no more people working per acre than the most active commercial-residential areas, such as those in Park Slope. And fewer than the even more active commercial/residential areas in parts of Bay Ridge and Borough Park. The densest employment in Sunset Park is in the Census Trace that includes Lutheran Hospital. Low worker density industrial areas, according to the data I was able to get, include the booming Navy Yard itself, which apparently has many workers spread over many acres.
Although one wonders about the 14,030 people the data shows to be working in the census tract southeast of the Navy Yard. And the mere 3,685 people the data shows to be working in the Navy Yard. It is possible that this is an error in the source data, particularly given the changes in employment indicated by the data, as discussed below. Or it is possible that this area’s dense workforce and growth is driven by the same factors as in many tracts of Borough Park.
Aside from the industrial areas note above, the data implies that industrial employers, using more and more space relative to the number of workers, have no more job density than mixed-use developments with commercial/workshops on the ground floor, and perhaps people working at home upstairs. That is because industrial employers, other than small-scale, high-value producers, are unwilling to occupy floors other than the ground floor because of the time and cost of moving goods and materials up and down elevators.
The waterfront and Newtown Creek areas of booming North Brooklyn, in particular, have fewer jobs per acre than I expected. Despite the pre-existing industrial activity, and booming mixed-use development. Apparently far more young people are riding the L train to work in Manhattan than are working locally. Along the East River many industrial employers, such as the Domino Sugar Plant, are gone, but even along Newtown Creek worker density is low.
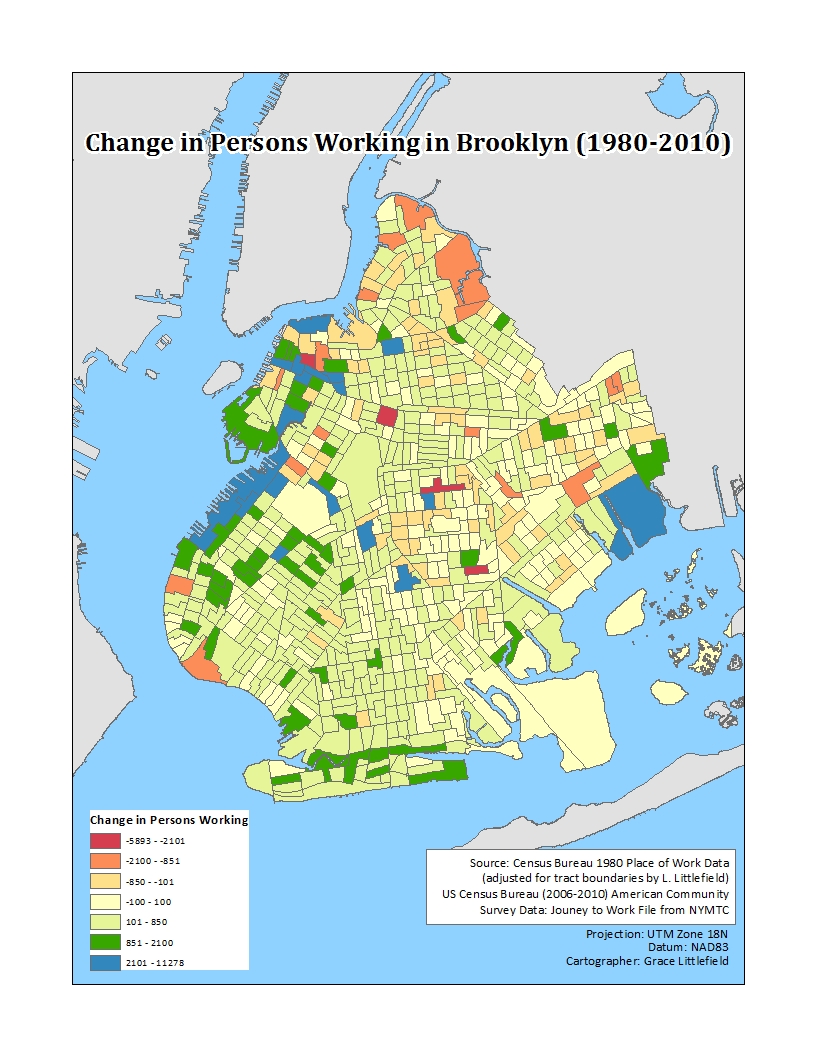
If people working in Brooklyn in 2010 were geographically concentrated, so were the increases in the number of people working in each area since 1980. The census tracts identified in Blue, and those in the two shades of green, each accounted for about one-third of the increase in people working in Brooklyn, among those tracts with significant increases. Because the margin of error can be large for data at this very local level, I assigned all the tracts where employment increased or decreased by 100 or fewer workers to the same color, indicating that there was no significant change. While the light green tracts show one-third of the increase in those working locally was spread around the borough, the dark green and blue tracts show two thirds of the increase was highly concentrated.
Among the areas adding the most workers were the southern half of Downtown Brooklyn, south of Fulton Street, and Fulton Ferry/Dumbo. Also adding large numbers of jobs are tracts near the Gowanus Canal, in Red Hood, in Sunset Park, along the Belt Parkway and Coney Island Creek near Coney Island, and the tract that includes the new Gateway Shopping Center in Spring Creek. Finally, two tracts southeast of the Navy Yard added quite a few jobs according to this data, something of a surprise at least to me. All of these could be considered cases of downtown and industrial areas re-filling. On the other hand the Navy Yard itself, according to this data, had slightly fewer people working there in 2010 than in 1980. This could be an error. Or perhaps most of the people working for businesses located inside the Navy Yard actually work elsewhere, “on site,” as do most construction workers.
There are also some residential/commercial areas that experienced significant job gains, however. One of them is the local “main street” of my neighborhood, Prospect Park West in Windsor Terrace. The Census Tract, tract 169, runs from 8th Avenue to 10th Avenue between Bartell Prichard Square and the Prospect Expressway.
Having lived in this area for 30 years, I can try to explain why that is based on the anecdotal evidence. When we moved here there were very few eating and drinking places on the street, or elsewhere between 8th Avenue and 10th Avenue. Just Farrell’s Bar, McBear’s bar, a pizza place, a Chinese takeout, a small soft ice cream shop that was only open in summer (the proprietors relocated to Florida in winter) and a single location with restaurants that kept failing for lack of patronage. Another restaurant, Circles, was outside the tract on the other side of the square. Most of the storefronts were occupied by small stores that opened late and closed early, with a few people – often family members – working. And many of the storefronts southwest of Prospect Avenue, or on the side streets, were vacant.
Today there are a significant number of eating and drinking places, most open for lunch and dinner and many open for breakfast as well. Apparently all those shifts create a large number of jobs, many of which are presumably part time, in a relatively small space. For example the Krupa store, a newsstand and stationary store where my children bought school supplies, is now an eating and drinking place open from 7 am to 11 pm.
http://www.krupagrocery.com
The only person I ever saw working in there before was Ms. Krupa.
Perhaps similar trends are at work in other census tracts with significant job gains. For example the large tract southeast of Prospect Park that includes parts of the Church Avenue, Cortelyou Road and Coney Island Avenue commercial corridors.
There was also a big jump in employment in the mixed industrial/residential/institutional area on the other side of the Prospect Expressway. Why? Well for one thing the Diocese of Brooklyn and Queens now uses one building for an office, and a beer garden opened up. I guess that greatly increased the number of people working in the area as well.
Based on press reports, however, I would have expected far greater employment gains in Williamsburg, Greenpoint, and Bushwick. After all, the last time I worked at New York City Transit local politicians demanded that weekend signal work on the L-Canarsie line be suspended at great cost during December. Supposedly so people from Manhattan could go over to Brooklyn to do their holiday shopping.
The data show, however, that Williamsburg and Greenpoint census tracts have a mix of modest increases in the number of people working there, and modest decreases – along with the more significant decreases in some of the waterfront tracts. Including those along the Newtown Creek where there has been no displacement of existing industry by residential or other activities.
There are two census tracts in Bushwick with large increases in the number of people working there. But one of those appears to be Wycoff Hospital. And in fact the expansion of some hospitals, and the closure of others, appears to be a significant factor in where people work in Brooklyn. Fewer work in the census tract where Kings County Hospital and the Kingsborough Psychiatric Center are located, but more work across the street in the track that includes Downstate Medical Center. More work in the census tract that include Methodist Hospital, and fewer in the tract that once included Long Island College Hospital.
There is one mystery: why are many fewer people working in the portion of Downtown Brooklyn located north of Fulton Street? Since 1980 the City of New York has subsidized the construction of Metrotech, to attract the back offices of Manhattan-based firms that had been shifting to the suburbs or New Jersey, and the development of an employment-dense hotel. A development boom, mostly residential, has followed. And yet the data indicates a substantial decrease in the number of people working there. Why?
Back offices, for one thing, are not the huge generators of “pink collar” jobs that they once were. Those jobs that couldn’t be automated out of existence by information technology have been outsourced, not just to the suburbs or New Jersey but also to places such as Tampa, Florida and even India. Take Census Tract 7 in Lower Manhattan, which includes the planned terminus of the never-built Second Avenue Subway. In 1970 about 143,600 people worked there, processing paper for the nearby banking and financial headquarters and stock exchange. In 2010 the number working there was just 76,420, little more than half as many.
Downtown Brooklyn once held the local headquarters of major utilities such as Brooklyn Union Gas and Con Edison, a few community banks, and many government agencies, mostly in social services but also including New York City Transit. Much of this is gone or downsized, with fewer city employees overall and perhaps more located in operational sites across the borough. The Brooklyn Medicaid office is now located on the campus of Kings County Hospital and in three other locations, for example. In 2010, moreover, the northern portion of Downtown Brooklyn had many holes in the ground and empty buildings. Cranes and rising concrete now occupy many of those sites. So perhaps the decrease in people working north of Fulton Street in Downtown Brooklyn represents a transition, with an increase to follow that will be similar to the increase south of Fulton Street.
What, you may ask, about the rest of the boroughs? Unfortunately merging the 1970 to 2000 data I already had with the 2010 data I was able to get is not easy. Census tract boundaries can change with each new Census of Population, but the Department of City Planning had always pushed the U.S. Census Bureau to keep census tract boundaries the same. Apparently in the prior Census the dam broke and a whole bunch of changes were made, as indicated in this document.
Census Tract Boundary Changes NYC
Where tract boundaries changed, assigning the old data to the new tracts is a lot of work, and I only got as far as Brooklyn – with Queens looming large. In some cases, two or more old tracts have been merged into one big new one. That only involves adding the data from the old tracts up. But in other cases old tracts have been divided into two or more others. All one can do then is to assume that the percentage of total people working in the new tracts in each year from 1970 to 2000 was the same as in 2010, and use 2010 percentages to allocate the workers from those prior years.
After one big project on my own time, with the Census of Governments, I’m apparently a little too spent for another one for a while. If anyone wants to take a crack at the other boroughs, all the data is here in this spreadsheet.
As it is I’m grateful to the New York Metropolitan Transportation Council for providing me with the 2010 data. It took a long time to find it. The Census Bureau is apparently doing even less household-based data compilation by place of work than in the past. I was able to find the number of people working in each county and place in the U.S. in 2010 here.
http://www.census.gov/population/metro/data/other.html
The data available shows that up in Delaware County, New York where were 27 people working in the village of Downsville and 53 in the village of Andes. It seems that the federal government is providing quite detailed place of work data for suburban and rural areas with many localities and “Census Designated Place.” New York City, however, counts as just one place. The most detail available is for its five constituent counties. For Brooklyn, therefore, the most detail the Census Bureau provided was the 760,000-plus people working in Kings County as a whole.
With some effort I was able to connect with the person at the Bureau that tabulated the data linked above, and asked if it could also be tabulated by New York City census tract. He said he’d love to do it for me, but he didn’t have time. Not that he didn’t have time to do the tabulation. That, he said, would take less an hour, perhaps far less. He didn’t have time to go through all the bureaucracy to get permission to do the tabulation, which would take six months of memos and meetings. As a former public employee, I know exactly what he was talking about.