
There are places in this country, generally rural areas, where people don’t get very much from state and local government other than schools, state police, and a road. Instead of public water and sewer, they have private wells and cesspools. Instead of municipal garbage pickup and disposal, they have to take their trash to the dump or pay someone else to do it. Instead of public libraries and parks, they have their own books and backyards. And, as in most of the country, there is no mass transit, no roads that are safe to bicycle or walk, not even many shared rides. Drive your own vehicle or be stranded.
New York City is, at least or based on its state and local tax burden and charges for services ought to be, the complete opposite of this. It has municipal water, sewer, solid waste pick-up, and mass transit. Highly developed at a high density, with most people having small or no private yards, city residents rely on public parks and related facilities for exercise and recreation. And the city has a network of public libraries, most within walking distance, even as most information shifts to the internet. One would, therefore, expect New York City’s public employment in these categories to be higher than the U.S. average. But how much higher? And is this fair value compared with what people could purchase themselves?
I continue to plod through the March 2014 state and local government employment and payroll data from the U.S. Census Bureau, providing a comparison with March 2002. The first post in the series, with a linked spreadsheet with the source data and tables, is one again here.
Two years ago I compiled and wrote about the much more geographically detailed state and local government employment and payroll data from the 2012 Census of Governments. That series included posts with a more detailed, long-term analysis of employment and payroll for infrastructure…
Infrastructure: Census of Governments Employment and Payroll Data
And parks, libraries and sanitation.
Parks, Libraries and Sanitation: 2012 Census of Governments Employment and Payroll Data
If you read those and downloaded the spreadsheet, there isn’t much new two years later. But new data is out, and it includes the last budget year of the Bloomberg Administration in NYC. So a comparison with the last budget of the Giuliani Administration, still in effect in March 2002, follows.
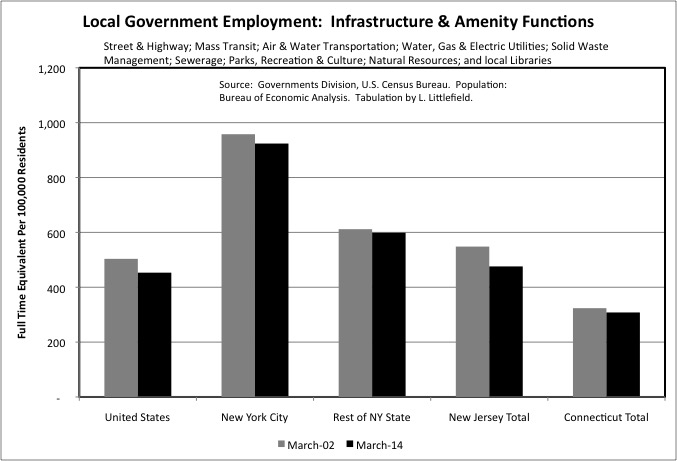
The data shows that adding them up New York City in fact had far more full time equivalent local government infrastructure and amenity employment per 100,000 residents in March 2014 than the U.S average, other parts of New York State, and adjacent states. The NYC total for that year was 924 employed per 100,000 residents, about double the U.S. average of 453. The Rest of New York State was also above average at 599, New Jersey was close to the average at 476, and Connecticut was far below average at 303, at least at the local government level. In all these areas local government employment fell in the infrastructure and amenity functions, relative to population, from March 2002 to March 2014. As noted previously, soaring public employee retirement costs and shrinking private sector incomes – and thus state and local government taxes – are the reasons. With public employees costing more relative to what private sector workers earn, the private sector workers can afford fewer public sector workers.
As noted, the one type of public infrastructure everyone has is a road or street. Densely populated New York City, however, has less road or street space per 100,000 residents than just about anywhere else in the country. According to NYC’s Department of Transportation, the city has “6,000 miles of streets and highways” add “12,000 miles of sidewalk.
http://www.nyc.gov/html/dot/html/about/about.shtml
That, however, is only 3.7 feet of street length and 7.4 feet of sidewalk length per person. Based on the U.S. Department of Transportation…
https://www.fhwa.dot.gov/policyinformation/statistics/2010/hm220.cfm
The U.S. average was 67.3 feet of highway and street per person. In addition to that greater length streets are wider elsewhere, on average, than they are in NYC. They are wider in areas developed following the widespread use of the private automobile. As for the sidewalks, although they are city property – and although the number of people walking down my block is many times the number driving down it in a day – the city does not maintain them. It requires property owners to maintain them, over and above the property taxes they pay. Ask my neighbors, many of whom were hit with sidewalk violations just last week.
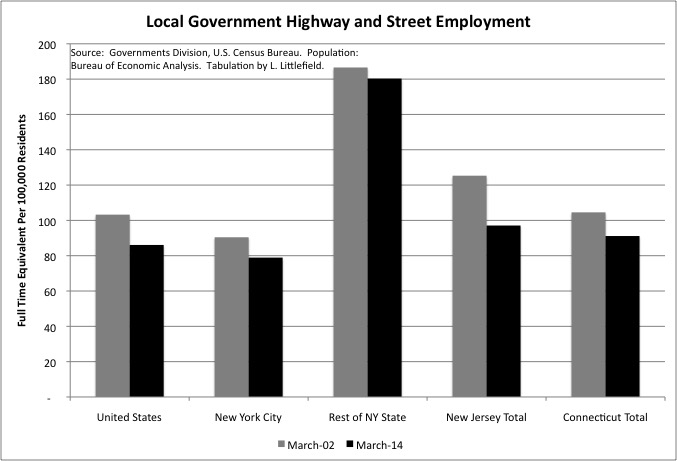
Although New York City has less street space to maintain, it had nearly has many full time equivalent local government Highways and Street employees as the U.S. average in March 2014, at 79 for NYC and 86 for the U.S. Among the factors pushing up employment in NYC are the Staten Island Ferry, which is counted in this category, far more traffic signal infrastructure in NYC than in most places, and many large bridges and tunnels with additional maintenance required, tolls and toll collectors. I counted half of the Highways employment of the Port Authority of New York and New Jersey as being New York City local government employment, and half as New Jersey.
The Rest of NY State was nearly double the U.S. average in Highways and Street employment at 180 employed per 100,000 residents, while New Jersey and Connecticut were above average but only modestly so at 97 and 91. As more detailed Census of Governments data showed, Upstate New York has particularly high local government employment in this function. Perhaps the climate, with heavy winter weather common in March, is part of the reason, although a comparison with Minnesota or Michigan could show otherwise.
There were substantial decreases in employment per 100,000 residents in this category from March 2002 to March 2014 in every area analyzed, though the decrease in the Rest of New York State was very small at 187 down to 180. In some parts of the country, what had been paved roads are being turned into dirt and gravel roads due to a lack of money and personnel for maintenance.
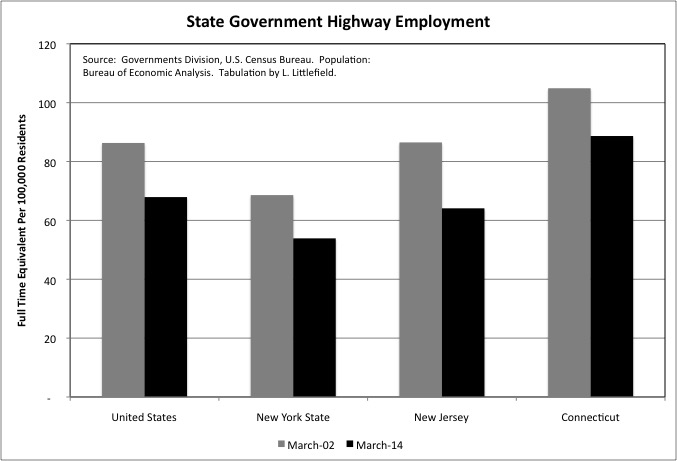
One reason local government Highways and Street employment is high in New York is that the state has local governments maintain some state roads, especially in NYC. New York’s state government street and highway employment, at 54 per 100,000 residents, was somewhat below the U.S. average of 68 in March 2014. That 54, moreover, was down from 69 in March 2002. Similar decreases were recorded for the U.S. and for New Jersey, which fell to 64. Connecticut, which had relatively low local government street and highway employment per 100,000 residents, had relatively high state government employment in the category at 89 in March 2014. Consistent with that small state’s pattern of having more government activity carried out and counted at the state level.
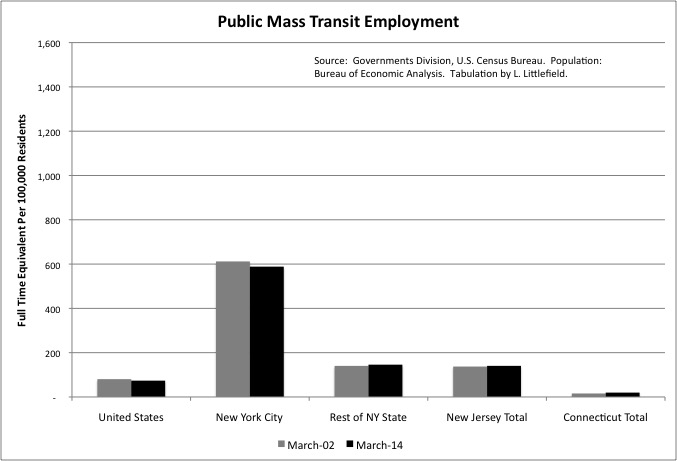
As expected, New York City had far more local government Mass Transit employment, at 588 full time equivalent employees per 100,000 residents, than the U.S. average at 74. Not only do subway and commuter railroad tracks in NYC take the place of additional highway miles in the rest of the country, but also the maintenance of the operation of the subways and buses themselves takes the place of the purchase, operation and maintenance of private motor vehicles elsewhere. In March 2014 the Rest of New York State and New Jersey had about twice as much Mass Transit employment per 100,000 residents as the U.S. average, while Connecticut was lower. (New Jersey Transit also provides extensive bus transportation through contacts with private bus companies).
In the U.S. and, in particular in NYC, moreover, mass transit employment fell per 100,000 residents from March 2002 to March 2014. Even though most of the city’s recent population growth, and planning for additional growth based on Bloomberg and DeBlasio-era zoning policies, is in areas served by the subway, and even though subway ridership is soaring. In the Rest of New York State, New Jersey, and Connecticut, mass transit employment increased relative to population. Transit austerity and service shrinkage relative to population, severe in many parts of the country in the wake of the Great Recession, has been limited to New York City in metropolitan New York.
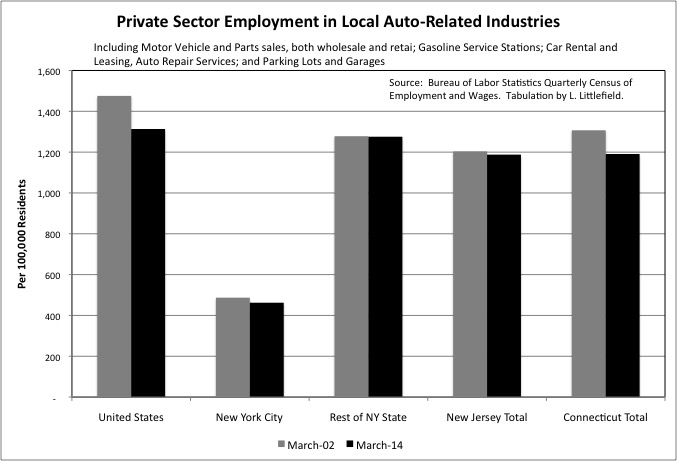
NYC residents pay for far more local government mass transit employment than the U.S. average, but also they support far fewer than average private sector jobs related to the purchase, maintenance and fueling of private motor vehicles. Private employment in these “auto-related” industries totaled 1,313 per 100,000 residents in the U.S. in 2014, down from 1,475 in 2002. The bankruptcy of GM and Chrysler and resulting dealership closings, more reliable cars that require fewer repairs, and more efficient gas stations that sell more fuel per pump, have taken their toll on employment in these industries. New York City’s private employment in the auto-related industries, at 462 per 100,000 residents in 2014, was little more than one-third the U.S. average, but it had fallen far less from 2002. The Rest of New York State, New Jersey and Connecticut were only slightly below the U.S. average at 1,275, 1,118, and 1,191. Their auto-related employment decrease was also small compared with 2002.
One advantage of having an automobile industry and mass automobile ownership, according to (obsolete) economic development theory, is the development of a sophisticated interlinked economy due to extensive “backward” and “forward” linkages. The employment tabulated above is an example of the “forward” linkages of automobile production — in sales, fueling, maintenance and repair. The “backward” linkages include the production of motor vehicle parts, and to make the parts raw and finished materials, along with oil production, refining and distribution for the fuel. All of this creates a vast network of firms, employees, money and, of course, lobbyists.
On the other hand, the production of motor vehicles and all its backward linkages can take place anywhere, rather than in the place where the motor vehicles are used, and thus represent a leakage of consumer spending power out of a metro area economy. In contrast most of the cost of commuting by train, bus or bicycle stays in the metro area economy, as it goes to those who work at local transit agencies and bike shops. This leads to a multiplier effect as that money is spent in the local consumer economy instead of Detroit, Japan, Germany, Mexico, or Saudi Arabia. The savings from mass transit users and bicyclists spending less on transportation in total may also be spent within the metro area, today or (after being saved) in the future.
There are two other forms of passenger transportation I didn’t include in this tabulation. Data on private mass transit employment is, for many places, suppressed by the BLS for disclosure reasons — because there are too few firms located in any one place. And most of those who work in the for-hire motor vehicle industry in New York City are self-employed, not employees, and thus not counted in employment data. It was reported in the press that around 100,000 people have for-hire driving licenses for New York City, far above the number of local government mass transit workers in the city.
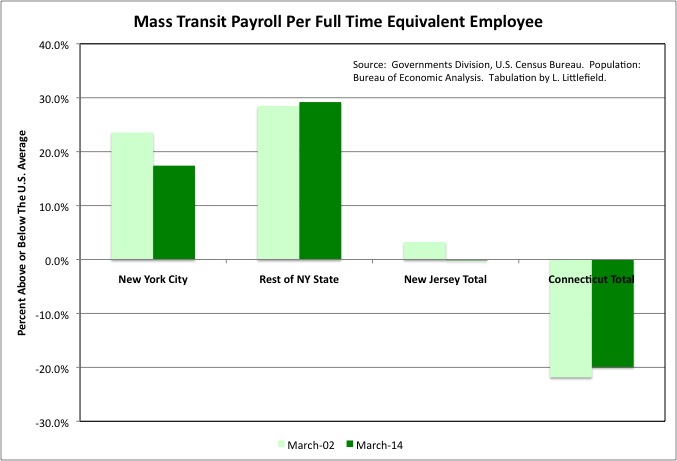
The downside of local government transit employment, on the other hand, is that local transit agencies are highly unionized, politically powerful, monopolistic rent seekers, and thus can generally provide less in exchange for more. Nationally, as for other public services, rising salaries and soaring retirement benefits, relative to the incomes of the generally poorer people who use mass transit, have caused transit service to be squeezed. In New York City, on the other hand, the mean payroll full time equivalent worker in mass transit fell from 23.5% above the U.S. average in March 2002 to 17.4% above the U.S. average in March 2014, in theory offsetting some of the soaring retirement costs. At New York City Transit, however, transit workers received retroactive pay increases in May 2014 that increased what they in reality they had been paid in March 2014.
http://www.nydailynews.com/news/politics/transit-workers-approve-contract-new-raises-article-1.1798120
So it’s wait until next year to find out what NYC transit service actually costs.
New Jersey Transit workers also worked on expired contracts, in the aftermath of the recession and soaring pension costs. And their pay per employee fell to just the U.S. average in March 2014, in a state where the average private sector pay and cost of living are still higher (though falling in the case of pay).
In the Rest of New York State, on the other hand, mass transit pay is extremely high and did not fall at all compared with the U.S. average from March 2002 to March 2014. Basically, New York City transit riders and workers are not only being sacrificed to pay for soaring public employee retirement costs in the city, but also to pay for featherbedding and soaring retirement costs in the suburbs and Upstate. In particular, the recent Long Island Railroad contract maintained all the expensive scams in that agency going back decades, in order to avoid a strike. Subway riders are essentially being used a cash cows to fund suburban graft, perhaps on the grounds that suburban graft is already killing Long Island as it is.
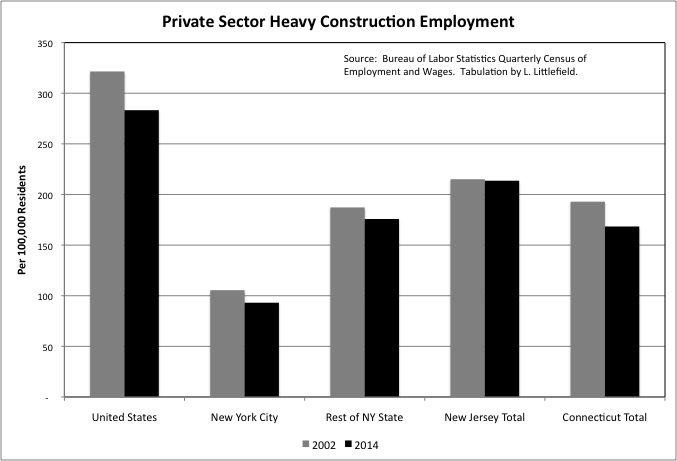
To a large degree, the construction and reconstruction of streets, roads, bridge, and transit lines, along with water, sewer and other infrastructure, is actually carried out by private sector workers in the Heavy Construction industry. Local government workers often just support or supervise these efforts. Despite New York City’s extensive infrastructure, however, its private employment in this industry was just 93 per 100,000 residents in 2014, about one-third the U.S. average of 283.
Private employment in this industry was about twice as high as in NYC in the Rest of New York State, New Jersey, and Connecticut, and is possible that workers recorded at their employer’s headquarters outside the city were actually working in NYC. Private Heavy Construction employment in the Rest of New York State, New Jersey and Connecticut, however, was also far below the U.S. average. And there is no evidence to suggest that higher productivity is offsetting the lower Heavy Construction employment levels in metro New York – quite the reverse. So low employment reflects lower than average investment.
Moreover, private Heavy Construction employment fell per 100,000 residents from 2002 to 2014 in the U.S., NYC, the Rest of New York State and Connecticut. It was unchanged in New Jersey. Despite rock bottom interest rates and a huge cutback in residential construction, state and local governments have been unable to borrow to expand their infrastructure. Because they are already deep in debt after borrowing to hide their fiscal and pensions difficulties over the past 15 years. Private sector firms in industries such as electric and gas utilities, railroads and telecommunications firms also seem to be more interested in merging to reduce competition than in investing to improve their networks. Another example of how low interest rates intended to spur the economy have been used for financial engineering instead.
It is because so much of their work is contracted out that I will not be writing about local government employment in the Water Utility, Sewerage, Air Transportation and Water Transportation (seaport) functions. Government activity in these functions does show up in public finance data, and analyses of these functions were included in my 2015 government finance post using Census of Governments data.
Infrastructure: Census of Governments Data
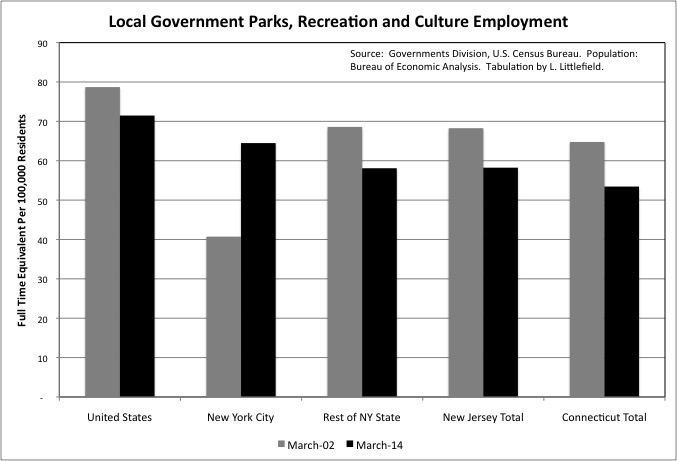
Although New York City residents are far more reliant on public Parks, Recreation and Culture facilities than the U.S. average, the city’s local government employment in this category plunged during the 1970s fiscal crisis and had not recovered as of March 2002. Then NYC had only 41 full time equivalent local government workers per 100,000 residents, little more than half the U.S. average of 79. The Rest of New York State, New Jersey, and Connecticut were somewhat lower than the U.S. average at 69, 68 and 65 respectively.
Like most local government employment, the U.S. average for this function fell from March 2002 to March 2014. New York City’s local government Parks, Recreation and Culture employment, on the other hand, increased to 64 per 100,000 residents. That is still below the U.S. average of 71, but is now higher than the Rest of New York State, New Jersey, and Connecticut at 58, 58 and 53 respectively. This represents a major policy shift of the Bloomberg Administration in NYC.
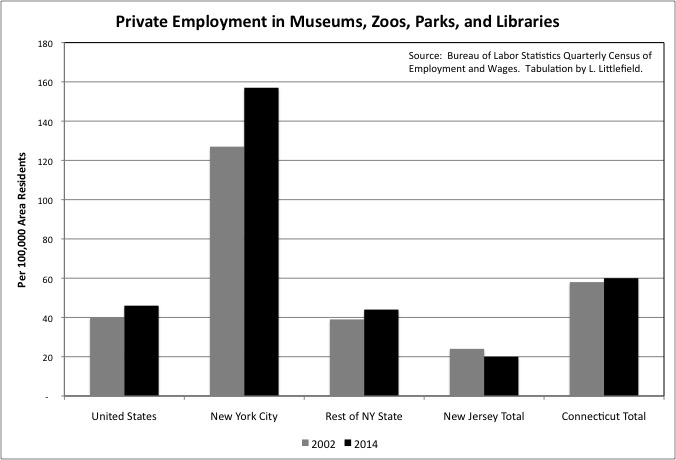
New York City has massive employment in the private Museums, Zoos, Parks and Libraries industry. New York City’s zoos, botanic gardens, and libraries have long been run by non-profit organizations, although these receive city funding. Most new parks added in the Bloomberg Administration are similarly operated by non-profits. And New York City’s museum infrastructure is huge. Adding it up, New York City had 157 private sector workers in this industry per 100,000 residents in 2014, up from 147 in 2002 and three times the U.S. average of 46. The rest of New York State, New Jersey, and Connecticut were closer to the U.S. average.
These private jobs depend on public funding, private donations, and fees for admission and memberships. Some times I worry that New York City is experiencing a cultural bubble, with not enough public money, charity money, and consumer demand to support all the employment and ambitions of the growing number of organizations. I have never heard this brought up by anyone else. But plutocrats are happy to donate money of buildings with their names on it, and the City of New York loves to fund “capital” expenditures with borrowed money, money that today’s politicians don’t have to make today’s older residents pay back. Somebody, however, is going to have to support the 15,744 private NYC jobs in the Museums, Zoos, Parks and Libraries industry during the next recession.
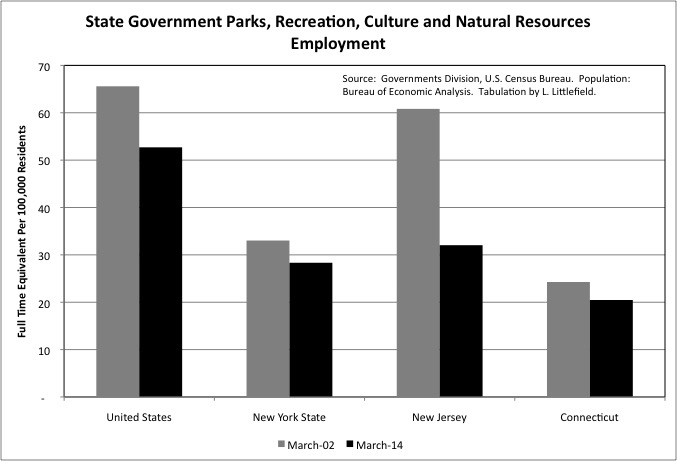
I switched the scale for state Parks, Recreation, Culture employment plus Natural Resources employment, because it servers a different role than local government Parks, Recreation and Culture employment. Despite New York’s extensive state park system, and extensive state park and campground infrastructure managed by the Department of Environmental Protection, its state employment in these categories is been below the U.S. average per 100,000 residents. New York State’s employment drop from March 2002 to March 2014, however, was not as steep as the U.S. average, let alone New Jersey.
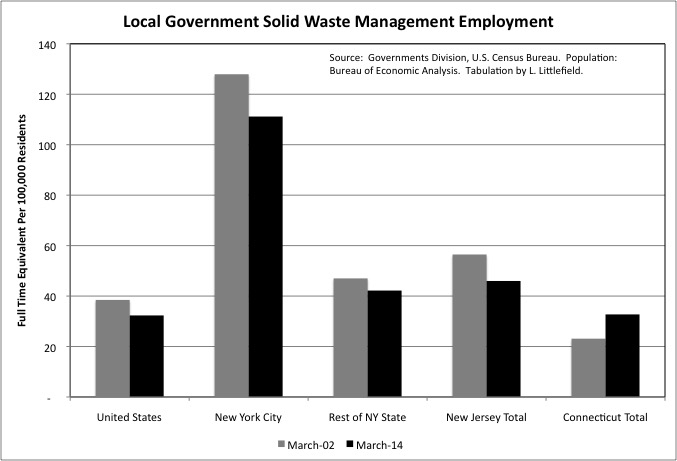
Local governments can either have their own employees pick up the trash, contract with private companies to do it, or merely require the people to arrange for trash disposal on their own. Because New York City has its own municipal solid waste collection, its Solid Waste employment per 100,000 residents, at 111, was far above the U.S. average of 32, the Rest of New York State at 42, New Jersey at 46, and Connecticut at 33. In New York City, Solid Waste Management employment fell from 128 per 100,000 residents in March 2002 to 111 in March 2014, as employment fell and the population rose. One reason, I believe, is the shift from having public employees move the collected trash to the Fresh Kills Landfill to having private companies ship it out of the city.
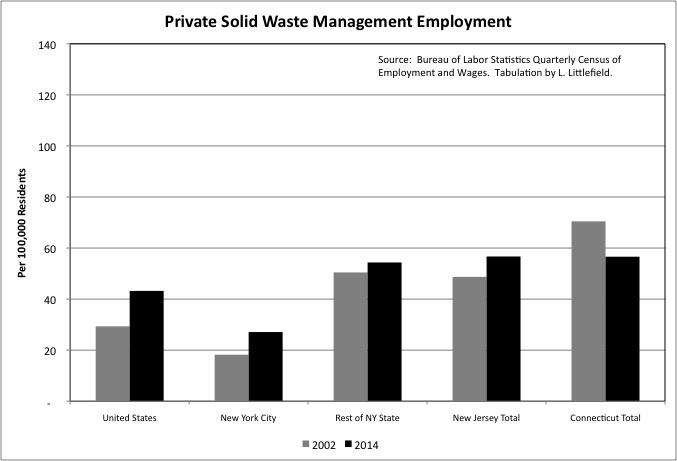
As I the case for New York City’s high public Hospitals employment, low private sector employment in the Solid Waste Collection industry does not offset its high public employment. New York City had 27 employed in this industry per 100,000 residents in 2014, lower than the U.S. average of 43 but not be nearly enough to offset the city’s higher local government employment in the category. The Rest of New York State was about average in private Solid Waste Collection employment per 100,000 residents, with New Jersey higher and Connecticut lower.
Bear in mind that it isn’t just how much solid waste has to be collected, but also how far the collectors have to go to get it. With very few feet of street per person, New York City’s Solid Waste collection points are far closer together than just about anyplace else in the country. This ought to allow NYC’s trash to be picked up with fewer workers rather than more.
And while New York City also has a large daytime non-resident population to serve, businesses do not benefit from municipal solid waste collection in the city. They have to hire their own private carters instead. Similarly, while commuters and tourists also use the parks in and around the Manhattan Central Business District, businesses are made to pay extra for those as well through Business Improvement Districts.
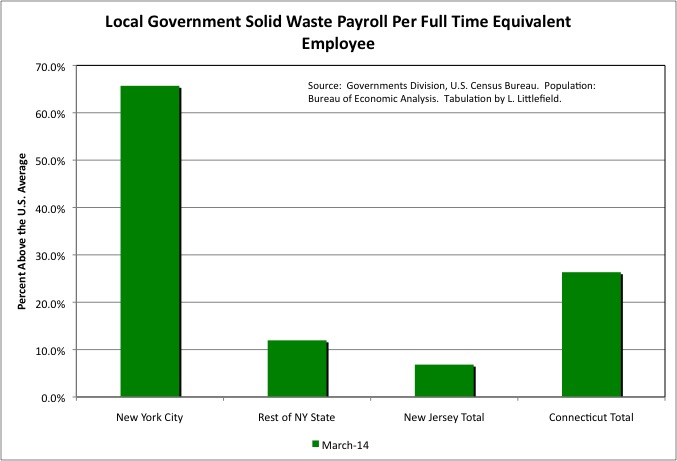
New York City not only has many more local government Solid Waste Management employees than average, but they are also paid more compared with similar local government workers elsewhere. The March 2002 figure is not meaningful, because it was inflated by post-9/11 overtime, but in March 2014 the payroll per full time equivalent local government Solid Waste Management employee in New York City was 65.7% higher than the U.S. average. Including the overpaid Finance and Insurance sector, the average private sector worker in Downstate New York earned just 27.9% more than the U.S. average.
Moreover, NYC’s average sanitation pay was in reality even higher, as like other city employees the city’s sanitation workers were working on contracts that had expired 2 ½ years earlier. They subsequently received retroactive raises for work done in March 2014. So not until the May 2016 data may we find how much NYC local government workers Solid Waste Management workers are actually getting relative to similar workers in the U.S. as a whole.
The relatively high pay of NYC Department of Sanitation workers is longstanding, but during the Bloomberg Administration these workers also gained the right – by state law and over the City of New York’s objections – to live in the suburbs, in places with lower total tax burdens and better public services. Today residents of the suburbs can take just about any local government job in New York City. But governments in the suburbs have the right to limit local government jobs to their own residents, excluding New York City residents. With state legislators from the suburbs generally in favor of their city worker constituents providing NYC residents with as little in services as possible in exchange for as much money as possible. Even if, especially if, they are Republicans. Or Democrats.
Given that the Rest of New York State is a mix of the high wage, high cost Downstate Suburbs and low wage, low cost, Upstate New York, the fact that the payroll per local government Solid Waste Management worker in the Rest of New York State was 12.0% above the U.S. average in March 2014 seems proportional. With private payroll per employee at 17.3% above the U.S. average in New Jersey in 2014, and 16.0% above average in Connecticut, local government pay per employee for Solid Waste Management seems a little low in NJ at 6.8% above average and a little high in Connecticut at 26.3% above average. Pay per private sector worker, however, is falling in both of those states.
When you add it all up, although NYC’s local government employment in the infrastructure and amenities categories is double the U.S. average per 100,000 residents in total, it fell from March 2002 to March 2014. Unless productivity gains made up the difference, one might expect New Yorkers to be receiving less service per person. That certainly seems to true with regard to the increasingly crowded subway, and there have been some reports that street repaving fell under the Bloomberg Administration below the level needed to maintain pavement quality. A productivity gain of just 0.3% per year would have been sufficient for the number of city workers in the Infrastructure and Amenity categories to fall from 958 per 100,000 residents in March 2002 to 924 in March 2014 without any change in services provided per person at all.