I will once again end a tabulation of state and local government data from the U.S. Census Bureau with a brief discussion of the Financial Administration, Other Government Administration, Judicial and Legal, and Public Health functions. This will be a limited review, because there isn’t much to add to the more detailed employment and payroll data from the 2012, 2002, and 1992 Census of Governments, which I analyzed here.
General Government: Census of Governments Employment and Payroll Data
And the data from the government finances phase of the Census of Governments that I wrote about here.
Bureaucracy: Census of Governments Data
Because the level of employment and pay in New York’s courts has been an issue, however, I’m going to examine that more closely for March 2002 and March 2014.
I group these categories because they overlap. While the Health function, according to the U.S. Census Bureau, includes “provision of services for the conservation and improvement of public health, other than hospital care” it also includes “health related inspections – inspection of restaurants, water supplies, food handlers, nursing homes, agricultural standards or protection of agricultural products from disease” along with animal control. In the “Other and Unallocable” category, similarly, one finds “protective inspection and regulation” and “code enforcement” among other things. The “Central Staff Services” included with “Other Government Administration” includes not only our local politicians and their personal staffs but also clerks, recorders, and planning and zoning agencies. And while state courts and prosecutors in the “Judicial and Legal” category deal with criminal law and major civil lawsuits, local courts typically handle cases dealing with local ordinances. Parking and noise tickets for example.
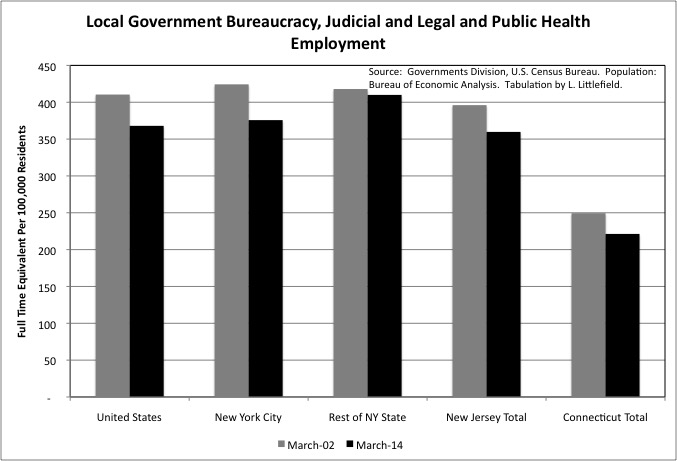
Taking all these categories together, one finds that New York City’s full time equivalent employment per 100,000 residents continues to be close to the U.S. average. The March 2014 total is 376 employees per 100,000 residents in NYC, and 368 for the U.S. New Jersey is also about average in local government employment in these “general government” categories combined, at 360. Connecticut is below average 221, mostly because many services are provided at the state level in that small state, and do not show up in the local government tabulation. In all of these areas, general government employment fell per 100,000 residents from March 2002 to March 2014.
The Rest of New York State is above average at 410 employed per 100,000 residents in March 2014, and fell only modestly from 418 in March 2002. As shown by the more geographically detailed data from the 2012 Census of Governments, while local government employment per 100,000 residents in these categories was also about average in the Downstate Suburbs, and was below average in the Upstate Urban Counties, it was well above average in Upstate Rural Counties.
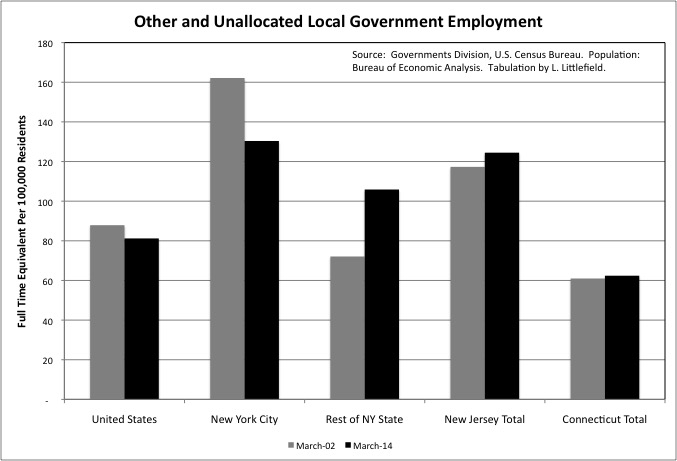
New York City, the Rest of New York State and New Jersey are all above the U.S. average in Other and Unallocable local government employment. The U.S. average was 81 full time equivalent employees per 100,000 residents, compared with 130 for NYC, 106 for the Rest of New York State, and 124 for New Jersey. And while Other and Unallocable employment fell in the U.S. and NYC from March 2002 to March 2014, it increased in the Rest of New York State and New Jersey.
Based on the data I have seen over the years, I believe New York City has above average employment in the Other and Unallocable function because of more “other.” According to the Census Bureau’s government classification manual, the category includes employees of agencies in charge of economic development, voter registration and elections, job training and employment programs, programs for senior citizens not based on need, veteran’s services, engineering, emergency (911) dispatching, code enforcement and regulation, parking facilities, and miscellaneous commercial activities. New York City, a huge single local government for 8.5 million people, has specialized agencies in most if not all of these categories.
On the other hand, New Jersey and the Rest of New York State have many layers of small local government, and I believe their high level of Other and Unallocable employment is mostly due to “unallocated” workers. The category includes central service agencies (e.g., public works, motor pools, communications) other than financial administration and government-wide executive services, the administration of multi-functional agencies, and general public buildings. Rather than separate agencies performing specific functions, these small local governments might have the same agency – and even the same people – performing multiple functions. Their function is thus unallocated.
Rural areas of New York State are also high in the Other Government Administration category, which includes elected officials. The large number of small governments, with overlapping township, municipal, school districts and other special districts serving the same area, may be responsible for the larger number of administrators there.
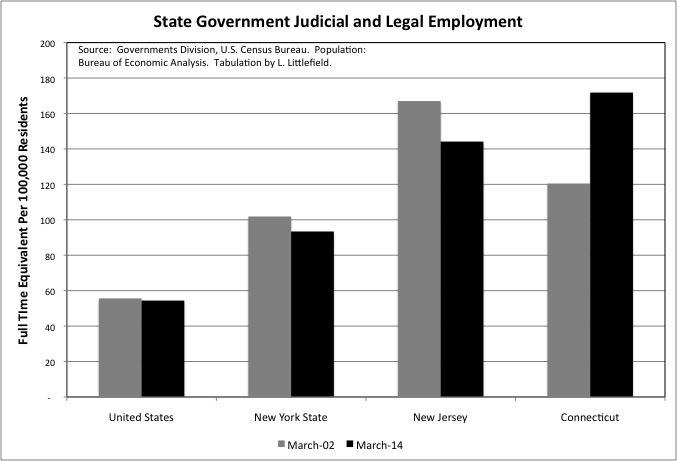
With regard to full time equivalent state government employment in the Judicial and Legal category, there was a decrease per 100,000 residents from March 2002 to March 2014 in the U.S., New York State, and New Jersey. In the latter period, however, the U.S. average was just 54 per 100,000 residents for the U.S., but it was 93 per 100,000 for New York State – or nearly double, and 144 per 100,000 residents for New Jersey, or nearly triple. Connecticut was even higher in March 2014 at 172 state Judicial and Legal employees per 100,000 residents, and that was up from 120 in March 2002.
As in most categories, Connecticut’s Judicial and Legal employment is concentrated at the state government level, not the local government level. Still, taking state and local together, Connecticut’s Judicial and Legal employment per 100,000 residents went from below the U.S. average in March 2002 to above the U.S. average in March 2014, a time of increasing fiscal stress in that state.
And that matches up with something I have noticed about Connecticut. Despite that fiscal stress, in government functions that employ many college-educated workers – Elementary and Secondary Schools, state Higher Education, the state Health Department, and now Judicial and Legal, Connecticut’s state and local government employment increased per 100,000 residents from 2002 to 2014. In more blue-collar or service employee functions, such as Police, Correction, Fire, Highways, Parks, there were employment decreases.
Connecticut has suffered a great deal of corporate downsizing over the past 15 years, and thus there are fewer high paid jobs with non-wage benefits available there for people who have come to expect them. As in Upstate New York in the Governor George Pataki era, public employment may have become, in part, a high-end welfare program in that state.
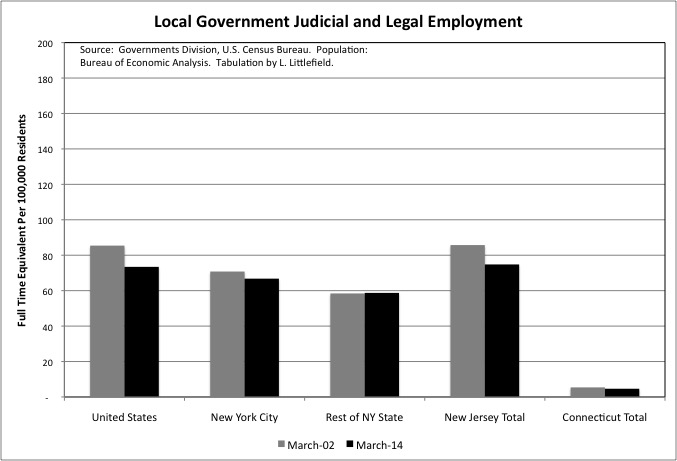
Getting back to New York, in New York City local government Judicial and Legal employment fell slightly from 71 per 100,000 residents in March 2002 to 67 per 100,000 in March 2014. The U.S. decrease was more substantial, from 85 to 73, but New York City was still below average in March 2014. So was the rest of New York State, at 59. New Jersey was about average at 75.
One of the big issues in recent years has been how well New York State’s judges were paid, particularly after judicial raises were held up as part of battles of state legislature pay. The mean payroll per full time equivalent state employee in the Judicial and Legal function was $5,533 in the U.S. in March 2014, up from $5,462 in March 2002 after the latter figure was adjusted for inflation. That is a small 1.3% increase over 12 years, but it took place at a time when the average private sector workers saw their pay fall behind inflation.
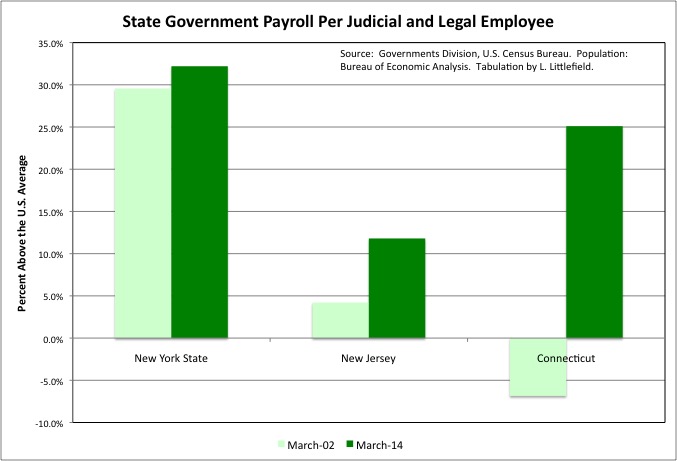
The mean payroll per employee in that function for the State of New York in the Judicial and Legal function was 29.6% above the U.S. average in March 2002. Not bad considering that the average private sector worker in Downstate New York, excluding the overpaid Finance and Insurance sector, was paid 29.7% more than the U.S. average in 2002 – but those in Upstate New York earned less than average. The state’s Judicial and Legal employees, on average, were being paid at Downstate rates.
In March 2014, however, that deal was slightly better, with the payroll per employee in the Judicial and Legal function rising to 32.2% above the U.S. average in New York State. There were also increases from 4.2% above average to 11.8% above average in New Jersey, and from 6.9% below average to 25.1% above average in Connecticut. State government lawyers, judges and related workers in the tri-state area, it seems, have gotten somewhat better off relative to their peers and their non-legal neighbors.
Just for a comparison, I went to the Employment and Wages section of the Bureau of Labor Statistics website to find out what the average annual pay was for private sector workers in the Legal Services industry (NAICS 5411). For the United States it was $87,786 in 2014, while for the New York-Newark-Jersey City, NY-NJ-PA MSA it was $115,271 or 31.3% more. Bear in mind, however, that these figures may not include many of the lawyers themselves, because they are self-employed sole proprietors or partners rather than payroll employees. Converting the state government March 2014 payroll per employee in the Judicial and Legal category to an annual future by multiplying by 12, one finds an average of $87,804 for New York, $74,232 for New Jersey, and $83,076 for Connecticut.
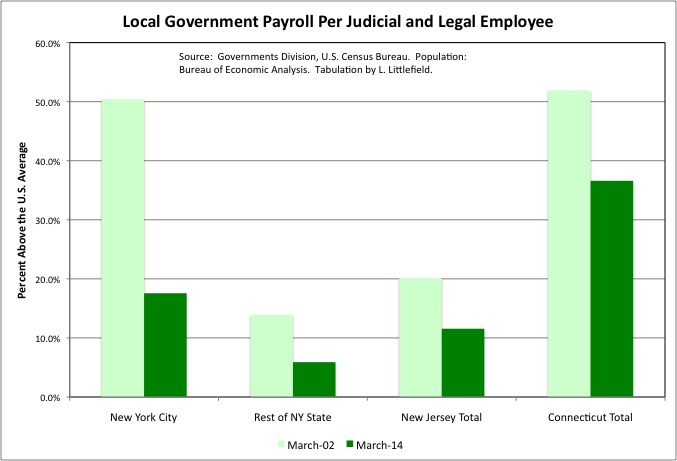
While state government Judicial and Legal payroll per employee has been going up relative to the U.S. average in and around New York, local government Judicial and Legal payroll per employee has been going down. In New York City, the decrease was from 50.4% above the U.S. average in March 2002 to 17.6% above average in March 2014. The Rest of New York State fell from 13.9% above average to 5.9% above average, with New Jersey down from 20.2% to 11.5% and Connecticut down from 51.9% to 36.6%. Adjusted for inflation, the U.S. average increased 3.7% from March 2002 to March 2014. The U.S. payroll per local government employee in the Judicial and Legal category was $4,958 that month, compared with $5,533 at the state level.
Additional data, as always, may be found in the spreadsheet, with one set of tables for “state,” one for “local,” and all the charts in this series of posts. It, once again, can be downloaded here.

Pingback: State and Local Government Employment in 2002 and 2014: Bureaucracy, Judicial and Legal, and Public Health Employment and Payroll – Blue Chip News()