
Here is food for thought. In 1978 I earned the minimum wage: $2.65 per hour. Adjusted for inflation that is $9.68. The current minimum wage of $7.25 is therefore about 25 percent lower. So have those earning the minimum wage become that much worse off relative to most Americans? After thinking about it, perhaps not. Perhaps that 25 percent decrease is just about typical. In fact, it suddenly hit me that I had seen something like a 25 percent decrease in well being elsewhere, in other contexts.
Here, for example.
https://www.stlouisfed.org/~/media/Files/PDFs/HFS/assets/Emmons-Noeth-Economic-and-Financial-Status-of-Older-Americans-4-Sept-2013.pdf
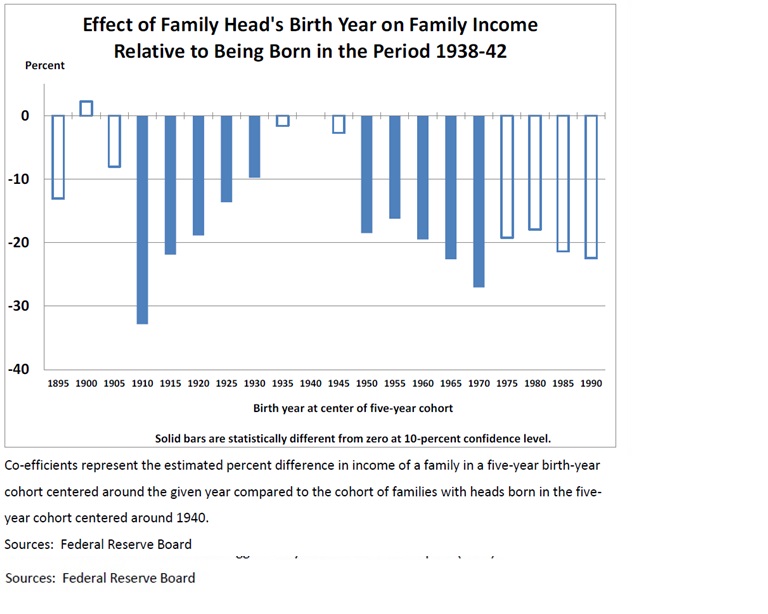
Adjusted for their level of education and other social factors, the family income of most Americans (measured by generation) peaked with those born between 1935 and 1950. Those born later have been paid less – generally 16 to 27 percent less, at leach point in their lifecycle, rounding off to about 20 percent worse.
Noted this analysis.
In terms of family income as reported in Table 9, families headed by someone born in the 1935, 1940, or 1945 cohorts—i.e., between 1933 and 1947—were statistically indistinguishable from each other. However, beginning with the 1950 cohort—including families headed by someone born between 1948 and 1952—successive cohorts through 1970 (born 1968-72) had statistically significantly lower incomes than those of the 1940 cohort, controlling for many important factors. The estimated magnitudes are economically significant, too—between 16 and 27 percent lower than the 1940 cohort. Moreover, all remaining five-year cohorts beginning in 1975 had estimated income shortfalls of about 20 percent; however, these effects were not measured precisely.
The cohort effects in family income revealed in Table 9 are striking. Incomes rise strongly and consistently beginning with the 1910 cohort through about the 1935 cohort, even after holding constant a number of key determinants of income like age, education, race or ethnicity, and idiosyncratic factors like family structure, saving behavior, and health status. Incomes are similar among the 1935, 1940, and 1945 cohorts, controlling for other factors; then incomes drop abruptly beginning with the 1950 cohort.
Compared to the 1940 cohort, there is strong evidence of a 16- to 27-percent income shortfall in all cohorts between 1950 and 1970 (born between 1948 and 1972)—approximately the Baby-Boom era. There is suggestive evidence that the shortfall has continued through at least the 1990 cohort, but more data and the passing of time will be required to know for sure.
Oh you can bet it has. If anything it has gotten worse for my children’s generation than my own, just based on the minimum wage when I earned it and when they earned it. Moreover, teenagers were far more likely to even be able to get a job then, compared with now.
A couple of points. First this is family income, not individual income. For the early Baby Boomers, a rising number of family members at work (more women in the workforce) helped to offset, in part, falling family income, but evidently not so much. Individual income must have fallen further.
Second, the level of income is adjusted for education. Without that adjustment the first half of the Baby Boom was probably as well off as the generation that preceded it, because it was better educated. But a college education hasn’t protected those who follow.
So in terms of income at each point in the lifecycle, those earning the minimum wage are only slightly less well off than average Americans. All are perhaps 20 to 25 percent worse off. But, as I have noted before, up until 2008 they didn’t live that way. They went into debt and failed to save for retirement as well, and are even worse off relative to prior generations in terms of wealth than income.
Noted the report.
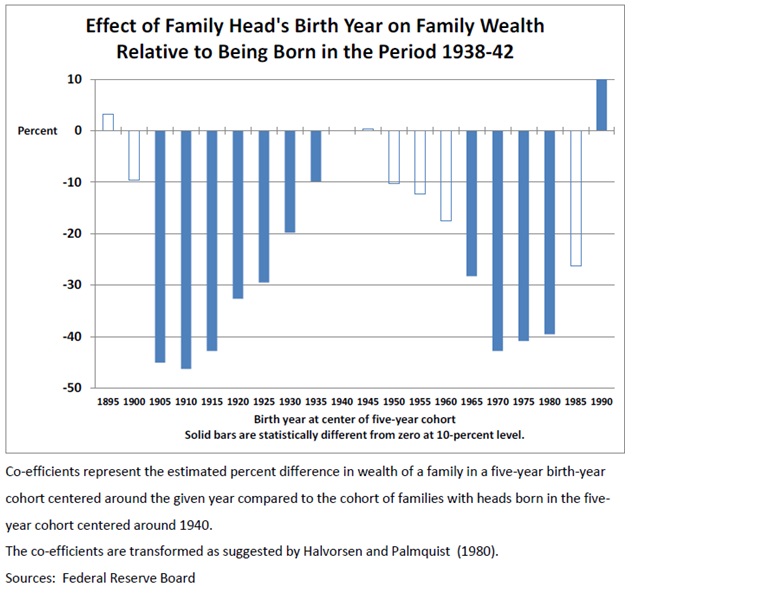
The estimated wealth shortfall for families in the 1970, 1975, and 1980 cohorts is about 40 percent, roughly twice the estimated income shortfall. The very large and significant positive wealth effect for the 1990 cohort is striking, but must be taken with a grain of salt since these individuals and families are few in number and observed only in the most recent surveys at very young ages.
Our regression results strongly support the hypothesis that rising levels of income and wealth holding constant demographic characteristics like educational attainment during the first several decades of the 20th century came to an end at some time around mid-century.
The minimum wage and average income, however, are not the only examples of approximately 25 percent lower well being I recall hearing about in the news. For example in 2030 when the Social Security “Trust” Fund is exhausted (and Generation Greed expects to have passed on) benefits will automatically be cut by about 25 percent.
https://www.ssa.gov/oact/trsum/
The projected HI Trust Fund depletion date is 2030, unchanged from last year’s report. Under current law, scheduled HI tax and premium income would be sufficient to pay 86 percent of estimated HI cost after trust fund depletion in 2030, declining to 79 percent by 2039, and then gradually increasing to 84 percent by 2089.
HI is the Medicare hospital insurance trust fund.
The theoretical combined OASDI trust funds have a projected depletion date of 2034, one year later than indicated in last year’s report. After the depletion of reserves, continuing tax income would be sufficient to pay 79 percent of scheduled benefits in 2034 and 73 percent in 2089.
OASDI is Social Security.
The shortfalls are a little better than I had heard, based on what I have read in the newspaper. It is usually summarized as a 25 percent cut.
Lawmakers should address the financial challenges facing Social Security and Medicare as soon as possible. Taking action sooner rather than later will permit consideration of a broader range of solutions and provide more time to phase in changes so that the public has adequate time to prepare.
If they just do nothing and pretend everything is fine, the Democratic alternative, Social Security payments would by cut by 21 percent in 2034, and funding for senior health care would be cut by 14 percent in 2030 and 21 percent in 2039. AFTER Generation Greed has passed on.
That is also the Donald Trump alternative, and had been the mainstream Republican alternative until the mid-2000s.
Today most Republicans have started coming out in favor of drastically slashing senior benefits – but for less well off younger generations only. Younger generations that will also pay higher taxes throughout their lives, to offset the debts run up by the richest generations in U.S. history.
“Time to prepare?” How? By committing suicide? Those younger generations are already being paid perhaps 20 percent less, adjusted for inflation. And the powers that be are nonetheless desperate to keep them going into debt and spending rather than saving, to prevent the economy from collapse. They have taken everything and left few good options, and don’t want to face it.
Now think about that 21 percent cut in Social Security payments at about the time I reach age 70 and finally retire.
Social Security payments are based on lifetime earnings. And the lifetime earnings of those born after the mid-1950s will already be about 20 percent lower because they were paid less. So we are talking about a 20 percent cut in something that was already going to be 20 percent lower, just because of those lower wages. It is one cut multiplied by another. Which is the equivalent of a 37 percent cut.
So among those in younger generations, their personal wealth will be about 40 percent lower when they reach old age and so will their Social Security payments. Even as they also pay higher taxes and accept less in public services for the ever-mounting costs shifted to them by the generations preceding, and public employees who keep getting richer relative to most of them. The generations that still control everything, and are still primarily focused on their own needs even as the death rate increases for those who followed.
Death is the Ultimate Statistic II: The Most Important News In Ten Years
Now consider something I read in this book.
http://www.amazon.com/Phishing-Phools-Economics-Manipulation-Deception/dp/0691168318
Not counting work income and other transfers such as veteran’s benefits, Social Security accounts for 94 percent of the total income of the 20 percent worst off people now over 65, 92 percent of the income for the next fifth in the income distribution, 82 percent of the income of the middle fifth of the income distribution, and 57 percent the income of those in the 60th to 80th percentiles. “Only for the top 20 percent is Social Security less than half of unearned income. But even for this top category, skewed as it is inclusion of the well-pensioned and very rich, it is far from a do-without; it is still 31 percent.”
But those now over 65 are the richest generations in U.S. history, the ones that got pensions in the private sector, had higher pay from which to save, got tax cuts, benefitted from the public services and infrastructure they inherited. Those coming after are vastly poorer, and will be even dependent on Social Security payments that will be lower. Their children, who some “progressives” would say should be make worse off to make up for this, will be worse off still.
And among those in the disadvantaged generations following Generation Greed it is the “well-pensioned” public employees, with their retroactively enriched pensions, and very rich who have gotten ahead. To the further detriment of those born later. But for how much longer?
In the case of the Central States Teamsters pension fund, there was a choice. Cut the benefits of current beneficiaries right now, beneficiaries that also get Social Security, and the younger generations now paying into the pension fund might get a pension too. Or just wait until there is nothing left in the fund, and have those younger generations pay in and get little or nothing. Or have the federal government bail out the pension fund so older generations can get what they promised themselves…to future the detriment of those who will only get Social Security, as the government goes broke.
In Illinois, new teachers don’t get Social Security and will have to make pension contributions equal to more than the pensions they will receive to bail out those who came before. This was the “solution” of a Democratic governor and legislature and the unions themselves.
And among the rich? Eventually there will be no place to hide, even for them. Take Donald Trump. Many suspect he won’t release his taxes in part because he is no longer as rich as he used to be. Now that all the other links in the food chain have been exhausted, the whales have nothing left on which to feed. Which is to say the businesses they control have no one left to sell to.
http://www.marketwatch.com/story/by-this-measure-us-stocks-are-more-expensive-than-ever-2016-05-27
While valuation metrics are virtually useless when it comes to timing market tops and bottoms, they do tend to have pretty reliable predictive value when it comes to long-term returns.
For example, at current Shiller PE levels, the S&P 500 implied 10-year return is negative 0.2%.
How much longer will people keep investing stocks, driving up stock prices and allowing top executives to pay themselves bonuses as if their genius has something to do with it, when sales are weak and earnings are falling?
There is perhaps one more example worth mentioning, given the way things are going. Back in 1983, when I graduated college into a deep recession and unemployment, the first job I was able to get was receiving bottles and cans at the local supermarket. A deposit had just been reinstated on bottles and cans, and soon poor people started earning some money by collecting and returning them.
The deposit they got back was 5 cents for each bottle and can then. Which, in today’s money, is 12 cents – or $12.00 for 100 bottles and cans collected. That deposit is still just 5 cents now – or just $5.00 per 100 bottles and cans collected. Those people buying lots of bottles and cans who are too rich to bother returning them themselves got 58.3 percent decrease in inflation-adjusted cost. Those collecting bottles and cans got a 58.3 percent decrease in income.
There you have it. Most Americans have been left 20 to 25 percent less well off by Generation Greed, across the board. Which will turn into a 40 percent disadvantage in retirement. It’s a done deal.
And no one will talk about it, in part because once it is out there in the public forum additional grabs by those who are already ahead at other people’s expense will become harder to take in the dark. Additional demands by those who have already taken too much keep coming, and coming, and coming in government and in business, without comment and without limits or shame.