
Over the years I’ve noted that New York’s seniors pay far less in state and local taxes than young workers with the exact same income, particularly if they are retired former public employees. And that a huge and soaring share of New York City’s education, police and fire department spending goes to pensions and retiree health insurance. And that New York repeatedly enriches public employee pension benefits for those cashing in and moving out, and then cuts the pay and benefits of new hires.
And that New York has had trouble maintaining, let alone expanding, its infrastructure despite the nation’s highest debt burden. And that in every financial crisis, caused by the fact that those in the inside have deals to get more and more even when tax revenues fall (because the serfs are getting less and less), social services for children are cut first and most deeply – until later when a sensational case of a child being tortured to death hits the news and funding is restored.
Given these other priorities, how would one expect New York’s Medicaid program to operate? Let’s check New York’s Medicaid spending by age group and find out.
This is the last is a series of three posts based on data downloaded from the Medicaid Statistical Information System (MSIS) State Summary Datamart from the Centers for Medicare and Medicaid.
The first post, with information on how the data was compiled, should be read before this one. It is here.
http://larrylittlefield.wordpress.com/2014/09/04/medicaid-by-state-in-2001-and-2011/
The spreadsheet with the charts for this post is here.
Medicaid By Age and State 2001 and 2011
When discussing issues of generational equity, I always point out that policies that favor the old at the expense of the young, who have other advantages, are not necessarily unjust. As long as they are sustainable. As long as those now old were willing to make the same sacrifices when young, and those now young can expect the same benefits when they themselves are old.
Across our society, however, Generation Greed is leaving less well off generations in its wake at every point in their lives. By demanding more and yet also demanding to pay less and less, and voting for politicians who accommodate this by advancing revenues and deferring costs to a future they don’t care about. This is a national trend, as I noted here
A trend that is worse in New York State, with its government of, by and for today’s seniors.
Health care is sphere of public policy in which the old have inherently greater needs than the young, and will always account for most of the related tax burden and public spending. This can be seen in a chart of 2011 Medicaid spending per beneficiary by age for New York State; the adjacent states of New Jersey, Pennsylvania, Vermont, Massachusetts and Connecticut; and all 45 states that have reported data for that year plus DC.
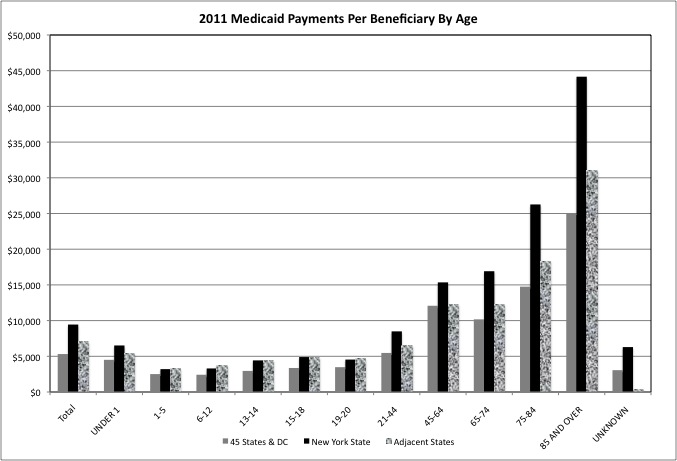
The data for the 45 states plus DC show that Medicaid payments averaged $4,506 for each beneficiary under age one, during the difficult and risky infancy state of life. From there, the cost varied between $2,400 and $3,500 for the different age groups from age 1 to 20. Note that many families are on Medicaid precisely because a family member has a severe disability or health issue, so average health care expenditures for typical children are likely lower. Severe disability and health issues, along with pregnancy, are the likely reason that the average spending level per beneficiary was $5,470 for ages 21 to 44. Aside from a check up every five years or so many adults have virtually no health care costs at those ages.
Incidents of illness and injury become more common from age 45 to 64, a period when people are not yet eligible for Medicare, and the average Medicaid payments per beneficiary jumps to about $12,100 for that age group – or 3.5 times the average of about $3,480 spent per beneficiary for those age 19 and 20. As I have noted, the federal Affordable Care Act (Obamacare) allows states to allow health insurers to charge older people up to 3.0 times the health insurance premiums of younger people. But New York State requires younger people to pay just as much as older people for health insurance sold through its health care exchange, the only state that does so.
For the 45 states plus DC, the average Medicaid payments per beneficiary is lower for those age 65 to 74, at $10,175, than for those age 45 to 65, and $12,100. Not because the health care costs of the older age group are lower, because Medicare is picking up some of the burden starting at age 65. But despite Medicare-funded health care for “dual eligibles,” however, Medicaid payments per beneficiary jumps to $14,755 for those age 75 to 84 and more than $25,000 for those age 85 and over, the so-called “frail elderly” years. After age 75, one becomes more and more likely to require expensive custodial care, which Medicare does NOT cover.
If that is the national pattern, what about the other relatively affluent, relatively generous, relatively high tax states of the Northeast? These states collectively had a per capita income that was 17.8% higher than the average for the 45 states plus DC in 2011, and average Medicaid payments per beneficiary that was 31.9% higher. The adjacent states were farther above average in Medicaid spending per beneficiary for those ages 6 to 18, at 43.0% to 53.8% over. They were close to the average for those ages 45 to 64. And 20.0% to 25.0% above average for seniors age 65 plus.
And New York State? New York’s Medicaid payments per beneficiary were similar to the surrounding states (and higher than U.S. average) for children. With a per capita income that was 22.2% above the 45 state plus DC average that year, New York’s Medicaid payments per beneficiary ranged from 27.6% above average for those ages 1 to 5 to 49.9% above average for those ages 13 to 14. High, but not drastically high.
But for seniors New York’s Medicaid payments per beneficiary were not only far above the 45 state plus DC average but also well the average for adjacent states. For those ages 65 to 74, New York was 66.2% over the average at $16,915 in Medicaid spending per beneficiary. For those ages 75 to 84, New York was 78.0% over the average at $16,915. And for those age 85 plus, New York was 76.1% over the average at $44,160. Remember that for those in nursing homes or receiving home health care, the $44,160 in Medicaid spending is in addition to health care funded by Medicare and custodial care funded by Social Security and other income sources.
Based on this data one cannot say that New York’s Medicaid spending on children was relatively low in 2011. But one can say that its Medicaid spending on seniors was very, very high compared not only with the U.S. average (or as close to that as the data will allow) but also with the surrounding Northeastern states.
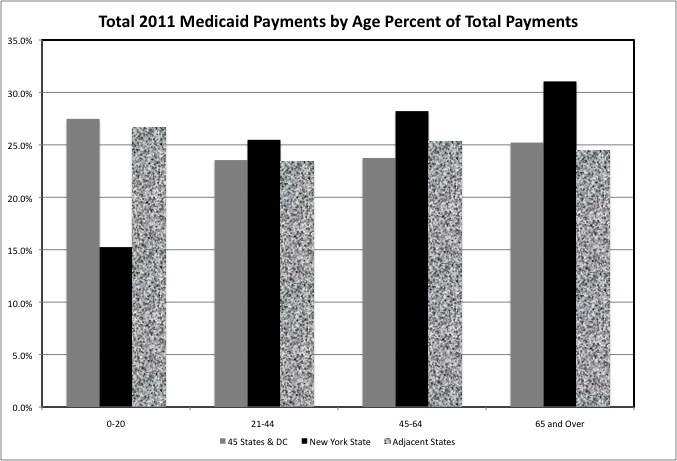
Both nationally and in the adjacent Northeastern states, in 2011 those ages 0 to 20, those ages 21 to 44, those ages 45 to 64, and those ages 65 and over each accounted for about one quarter of total Medicaid spending. As a result of New York’s high spending on seniors, however, those ages 65 and over accounted for 31.1% of total Medicaid spending there, compared with just 15.2% for those ages 0 to 20.
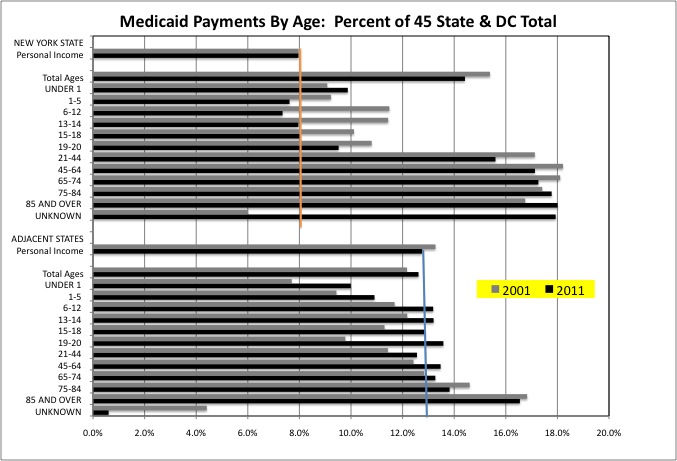
Residents of New York State accounted for 8.0% of total personal income (45 states plus DC) in 2011 (orange line). That’s the money they had to pay state and local taxes to support the non-federal share of Medicaid. Compared with that amount of income Medicaid spending on New York’s children didn’t represent a particular burden in 2011. New York’s Medicaid spending was 9.9% of total Medicaid spending on those under age 1, 9.5% of the total spent on those ages 19 to 20, and 8.0% of the total or less for the ages in between. In many cases, moreover, these shares of total Medicaid spending were lower in 2011 than they had been in 2001.
New York, however, accounted for 17.1% of total Medicaid spending on those ages 45. 64, 17.3% on those ages 65 to 74, 17.8% on those ages 75 to 84, and 18.0% of total spending on those ages 85 and up, more than double the New York State’s share of total resident personal income. For those ages 75 to 84 and 85 and over, the ages at which custodial care becomes more common, moreover, New York’s share of total Medicaid spending was higher in 2011 than it had been in 2001.
And the adjacent Northeastern states? Their residents accounted for 12.8% of total (45 states plus DC) personal income in 2011 (blue line), but their Medicaid beneficiaries accounted for just 12.6% of total Medicaid payments that year. For no age group did these states collectively exceed 13.8% of total Medicaid payments, except for those age 85 and over at 16.5%. Even that, however, was less than one third higher than these states’ share of personal income. Compared with Medicaid payments at double or more the state of personal income in New York.
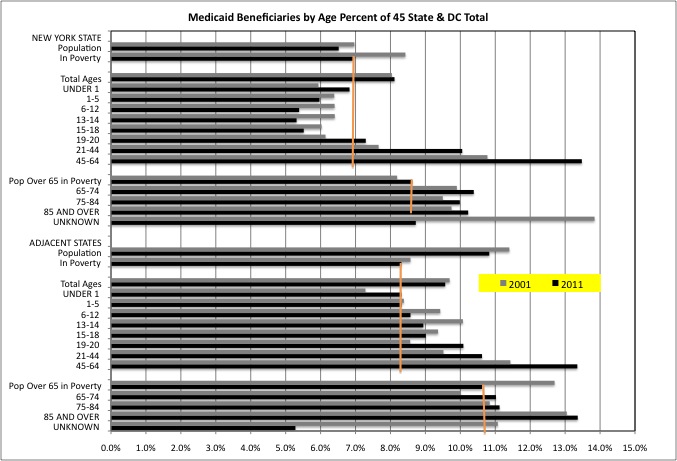
New York State accounted for 6.9% of the total (45 states plus DC) population in poverty in 2011 (orange line). Its share of total Medicaid beneficiaries among children varied from just 5.3% (for those ages 1 to 5) to 6.8% (for those under age 1). So New York’s share of child beneficiaries was lower than its share of poor people in 2011.
Prior to Obamacare New York State’s Medicaid program was relatively generous to non-poor moderate-income working age adults, through programs such as Family Health Plus, and many states have been unwilling to accept the Obamacare Medicaid expansions. With just 6.9% of the total population in poverty, in 2011 New York accounted for 10.1% of the Medicaid beneficiaries ages 21 to 44 and 13.5% of the Medicaid beneficiaries ages 45 to 65. New York’s percent of the total population in poverty fell from 2001 to 2011, but its share of working age adult Medicaid beneficiaries increased.
New York State accounted for 8.6% of total persons age 65 and over living in poverty in 2011. Its share of total senior Medicaid beneficiaries was only modestly higher, varying from 10.4% for those ages 65 to 74 to 10.0% for those ages 75 to 84. Disproportionately high spending per senior beneficiary, not a disproportionately large number of senior beneficiaries, is primarily responsible for New York’s extremely high Medicaid spending on seniors. Are New York’s seniors better off, or is the industry paid to serve them just more politically powerful and expensive?
The adjacent Northeastern states accounted for 8.3% of the population in poverty in 2011. Their share of total child Medicaid beneficiaries was that high or higher, varying from 8.3% for those age 1 or under to 9.0% for those ages 15 to 18. As in New York, the adjacent states’ share of total adult Medicaid beneficiaries was higher than their share of total poor people. But only moderately so, at 10.6% of total beneficiaries ages 21 to 44, and 13.3% of total beneficiaries ages 45 to 64. As in New York, the adjacent state’s share of total adult Medicaid beneficiaries increased from 2001 to 2011. Note that in Massachusetts, “Romneycare” came into effect in 2006; Vermont has had “universal health care” for far longer.
The adjacent states accounted for 10.6% of poor seniors in 2011. As in New York, their share of total Medicaid beneficiaries over age 65 was higher than that, but only moderately so. The adjacent states’ share of total seniors on Medicaid also increased from 2001 to 2011, while their share of total poor seniors fell.
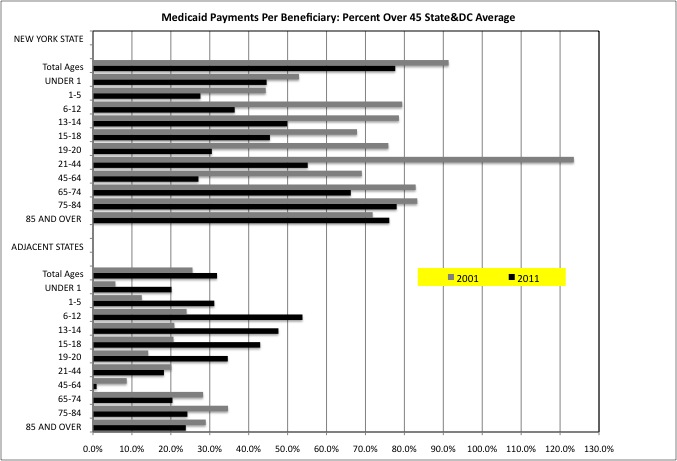
This chart shows Medicaid spending per beneficiary as a percent above the 45-state-plus-DC average in 2001 and 2011, both for New York State and the adjacent states. The extent to which New York’s Medicaid payments per beneficiary spending is above the average fell for nearly all age groups from 2001 to 2011, except for those ages 85 or higher. The decreases were less for those ages 65 and over than for other age groups, however. New York’s is clearly not looking to save Medicaid dollars on seniors. It is looking to save Medicaid dollars on others.
The adjacent states collectively show the reverse pattern. Medicaid payments per beneficiary increased relative to the average from 2001 to 2011 for all age groups up to age 20, and fell for all age groups starting at age 21.
So there you have New York’s priorities. Lots of money for seniors, with lots of tax breaks for seniors and the AARP demanding more of them. But are New York’s seniors really better off than those in other states, particularly the seniors in the Northeastern states adjacent to New York? Or is the political power of seniors merely exploited to allow New York’s Medicaid program to get ripped off? That is the question. Most non-seniors are sacrificed to pay for it either way.