
This post is the second in the series. Relative spending on Medicaid, comparing New York State with other states and the U.S. average, was discussed for overall spending and beneficiaries in the first post.
http://larrylittlefield.wordpress.com/2014/09/04/medicaid-by-state-in-2001-and-2011/
This post will discuss the number of Medicaid beneficiaries and spending by type of service. The data show that while New York State accounted for 6.5% of the total population of the 45 states that have reported their Medicaid data for 2011 (plus DC), it only accounted for 5.1% of the beneficiaries of Physician’s services – compared with 25.6% of the beneficiaries of Inpatient Hospital Services. Similarly, while New York State residents only earned 8.0% of the total income of those reporting states in 2011, New York State accounted for just 3.2% of total Medicaid spending on Physicians – compared with 28.0% of spending on Home Health Care. So while New York’s Medicaid spending is high overall, it isn’t high for every type of service. The charts in the rest of this post show the variation.
As noted in the previous post five states – Idaho, Kansas, Maine, Oklahoma and Utah – have not finished reporting their Medicaid data for 2011. So instead of comparing New York’s Medicaid program with the U.S. average, I’ll have to compare with the average and totals for the other 45 states plus DC, for both 2001 and 2011. In addition because New Yorkers expect more from government than those in states with below average Medicaid spending, such as those in the South and West, I also compare New York with the total/average for its adjacent states – New Jersey, Pennsylvania, Vermont, Massachusetts, and Connecticut. These states, collectively, have a per capita income similar to that of New York State.
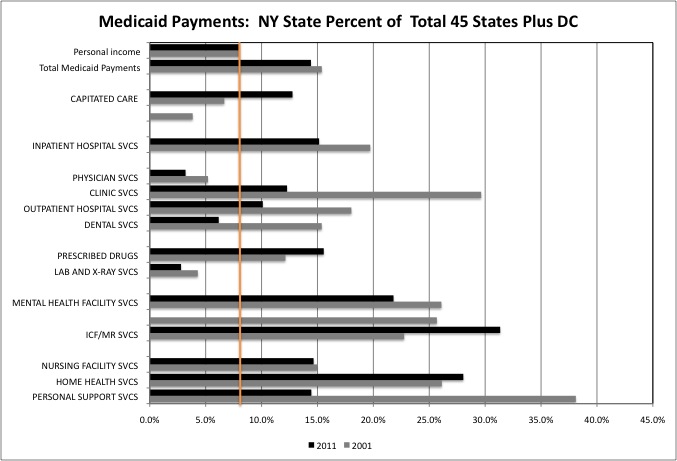
The chart above shows that New York State residents accounted for 8.0% of total (45 states and DC) personal income in 2011 (orange line). It is out of those incomes that state residents are forced to pay taxes for the non-federal share of Medicaid. New York’s share of total Medicaid spending is shown for each service type, for both 2001 and 2011. In the latter year, New York State accounted for 14.4% of total Medicaid spending.
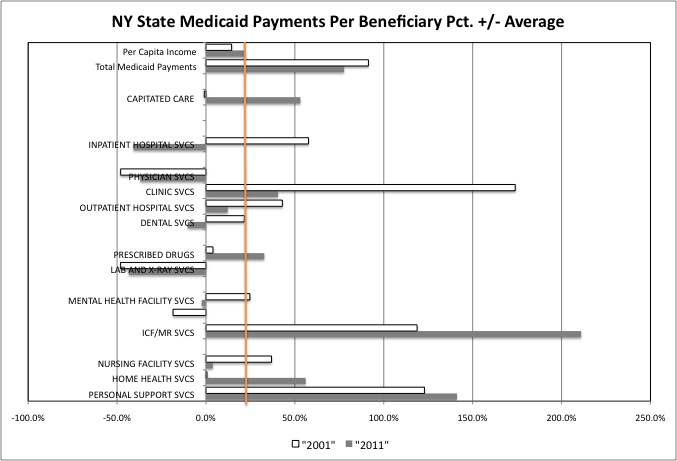
This chart shows total Medicaid payments per beneficiary in 2001 and 2011. New York State’s per capita income was 22.2% above the U.S. average in 2011, and since the average New Yorker had that much more, one might expect the average health care provider to earn that much more as well, leading Medicaid spending per beneficiary to be 22.2% higher than average. For most service types, however, New York’s Medicaid spending per beneficiary was far more than 22.2% higher than average.
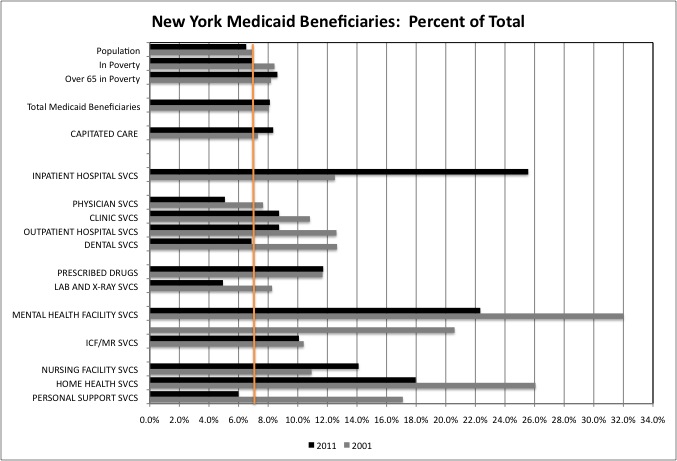
This chart shows New York State Medicaid beneficiaries as a percentage of total Medicaid beneficiaries. by type of service. New York State accounted for 6.5% of the total population, 6.9% of the total population in poverty, and 8.6% of total seniors in poverty in 2011. For many types of services New York only accounted for a slightly higher share of total Medicaid beneficiaries, despite its high share of Medicaid spending. For other types of care New York’s share of the national total was very high.
Let discuss the data in the three charts service by service.
Capitated Care
In 2011 New York State accounted for 12.8% of U.S. spending on “Capitated Care,” a category the includes payments to insurance companies that subsequently pay for all types of health care services, under Managed Care and HMO policies. Most non-seniors on Medicaid have been moved into managed care over the years, and New York’s high share of total spending in this category shows the relative generosity of its Medicaid program to low- and moderate-income workers. In the early days of Medicaid managed care, back in 2001, it was divided into two categories and New York accounted for a relatively low share of total spending in each.
With many states refusing to expand Medicaid to additional working people under the Affordable Care Act, New York’s share of total spending in this category has grown. The same is true of the rest of the Northeast. The states adjacent to New York accounted for 12.8% of total personal income in 2011, and 16.2% of total Medicaid spending on Capitated Care. Still, while New York’s 12.8% of total Medicaid spending in this category exceeds its 8.0% of personal income, that difference is much greater for other types of Medicaid-funded health services, as seen below. There isn’t much of a constituency for overpaying health insurance companies in New York State.
New York accounted for 8.3% of total U.S. Medicaid Capitated care beneficiaries in 2011, compared with 6.9% of total people in poverty. That difference, however, is also not as great as for other types of Medicaid services. So a higher share of working people on the Medicaid rolls does not appear to be a major driver of New York’s high Medicaid spending overall. The adjacent states accounted for 11.4% of total Medicaid Capitated Care beneficiaries, compared with 8.3% of total people in poverty.
New York’s spending per beneficiary on Capitated Care was 53.1% higher than the U.S. average in 2011, compared with a per capita income that was just 22.2% above average. There are explanations other than a ripoff by the insurance companies. For both private and public insurance policies, New York requires care for more conditions that many other states. In other states insurers can reduce costs by refusing to cover conditions such as (for example) Cystic Fibrosis and those who have the disease, forcing them to relocate to more generous states such as New York for treatment at New Yorkers’ expense. In fact, at the national level the Republican alternative to Obamacare, allowing people to buy insurance across state lines, is intended to allow residents of other states to drain off New York’s health care insurance dollars without relocating, while New Yorkers who know they don’t have expensive health conditions abandon New York-regulated insurance, setting off a race to the bottom. In the adjacent Northeastern states, per beneficiary Medicaid spending on Capitated Care was 42.0% higher than the average. These states require relatively comprehensive coverage as well.
Inpatient Hospital Care
In 2011 Inpatient Hospital Care spending accounted for 10.4% of total Medicaid spending in New York State, compared with 9.9% of U.S. Medicaid spending and just 5.6% of Medicaid spending in adjacent states.
New York City’s share of total (45 states plus DC) spending on Inpatient Hospital Services was 15.1%, far above its 8.0% share of total personal income. This represents a significant tax burden on New Yorkers. The 2011 share was, however, down from New York’s 19.7% of total Medicaid spending on Inpatient Hospital Services in 2001. The reduction is due to a huge drop in New York’s relative spending per beneficiary, from 57.6% above average in 2001 (and even farther above average earlier) to a stunning (and incongruous) 40.8% below average in 2011. The average 2011 Medicaid spending on Inpatient Hospital Services per beneficiary was $7,150 in total (45 states plus DC), $7,251 in the states adjacent to New York (NJ, PA, VT, MA, CT), but just $4,235 in New York.
What New York’s hospitals at least appear to have lost in pricing, however, they appear to have made up on volume. New York State accounted for a stunning 25.6% of total Medicaid beneficiaries of Inpatient Hospital Services in 2011, up from 12.5% in 2001. Or four times the New York’s 6.5% share of total population overall. How is this possible?
One possibility is that those from other states are coming (or being sent) here when they need surgery or other hospital services, for care on New Yorkers’ dime. There has been some anecdotal evidence to that effect, with New York’s Medicaid program being billed for follow-up care for surgery by physicians working in other states. Another possibility is that some of this “Inpatient Hospital Care” is actually misclassified primary care received at the hospital, which would both inflate the number of beneficiaries of hospital care and decrease the average spending on such beneficiaries. One of the largest recipients of Medicaid spending in the state is New York City’s Health and Hospitals Corporation, and an accounting screw up there would be enough to skew the numbers.
The adjacent states include the huge hospital industries of Boston and Philadelphia. With 8.3% of the total people in poverty, however, these states accounted for just 7.0% of the Medicaid beneficiaries of Inpatient Hospital Services. And with 10.8% of total personal income, these states accounted for just 7.0% of all Medicaid spending on Inpatient Hospital Services. While generous toward the poor, perhaps the state governments of these states are less dominated by producers of public and publicly-funded services than New York.
Primary Care
While New York’s Medicaid spending on Inpatient Hospital Care has always been high, its spending on Physicians has always been low. With 8.0% of total personal income, New York’s Medicaid spending on Physicians was just 3.2% of the national total in 2011, down from 5.2% in 2001. And with 6.9% of people in poverty, New York’s share of total Medicaid beneficiaries of Physician services was just 5.1%, down from 7.7%. One reason may be that few New York physicians will accept Medicaid, because in New York the distribution of Medicaid spending is based on political clout not health care needs. New York’s per beneficiary spending on Physicians was 37.0% below average in 2011 and 48.0% below average in 2001, a relatively low payment level that has been consistent over the years.
Surprisingly, in the adjacent states Medicaid payments per beneficiary for Physician services were 25.2% below the average in 2011. The annual payments per beneficiary levels were $494 for the total, $312 in New York, and $370 in the states adjacent to New York. Even more surprisingly, in many so-called “Red States” with less generous Medicaid programs overall, the average Medicaid payment per beneficiary for Physician services was higher than in the “generous” Northeast. The averages were $521 in Texas, $618 in Florida, and $752 in Arizona.
An optimist may believe the difference between high Inpatient Hospital spending in New York and higher Physician spending in the Red States reflects different visions of how health care should be provided. A realist who has followed the New York State legislature over the years may believe that the distribution of campaign contributions and assistance collecting signatures to get on the ballot (and lawsuits to keep others off) has more do with it, with the New York State budget an allocation among interest groups first, a way to provide public services and benefits for the serfs last.
There are other sources of primary care other than Physicians, and New York’s share of total beneficiaries in those categories is somewhat high. With 6.5% of total population and 6.9% of all those in poverty, New York State accounted for 8.7% of beneficiaries of Medicaid-funded Clinic Services, 9.0% for Outpatient Hospital Services, 6.9% for Dental Services, 4.9% for Lab and X-Ray services, and 11.7% for Prescribed Drugs.
With 8.0% of total personal income, New York accounted for 12.3% of total Medicaid spending on Clinic Services, 10.1% for Outpatient Hospital Services, 6.2% for Dental Services, 2.8% for Lab and X-Ray services, and 15.6% for Prescribed Drugs. New York’s per capita income was 22.2% above average, while its Medicaid spending per beneficiary 40.5% above average for Clinic Services, 12.2% above average for Outpatient Hospital Services, and 15.6% above average for Prescribed Drugs. It was 2.8% below average for Lab and X-Ray services, and 10.3% below average for Dental Services.
Adding Physician Services, Clinic Services, and Outpatient Hospital Services together, New York State accounted for 7.2% of Medicaid beneficiaries and 8.6% of Medicaid spending, reasonable ratios compared with New York’s 6.9% of poor people and 8.0% of personal income. Perhaps on primary care, as opposed to other services, New York spends a reasonable amount on Medicaid, but no more.
Getting back to the huge number of Inpatient Hospital Services beneficiaries in New York, an optimist might assume that it is a clerical error, with some of those who received Outpatient Hospital Services or hospital-run Clinic Services being erroneously put in this category. A pessimist might assume that lots of people in NYC get their Medicaid-funded primary care in the emergency room.
Mental Health Facility and Intermediate Care Facilities for the Mentally Retarded
Fifty years ago, when most of the mentally retarded and mentally ill were cared for in state hospitals, New York State had a reputation for relatively generous and advanced care for those vulnerable populations, under the old definition of “progressive.” But in the 1970s, during a severe fiscal crisis for New York City and State, thousands of vulnerable people were dumped into New York City’s streets to save money. Many, even the now forgotten “bag ladies,” suffered and died there under the generational priorities of the time which favored the young (today’s old).
http://www.nytimes.com/1981/09/29/opinion/bag-ladies.html
Other states also offered “Greyhound Therapy, a bus ticket to New York City, for their most troubled, something 60 Minutes reported on decades ago but evidently still goes on, according to a more recent report. In Connecticut, I’ve heard, the police used to pick up those released from the state mental hospital and put them directly on a Metro North train to Grand Central.
http://www.cbsnews.com/videos/san-francisco-sues-nevada-for-moving-mentally-ill-patients-to-calif/
Moreover, even as state hospitals were emptied much of their staff remained in place (despite doing less and less work) because they had a “right” to their existing deal under the new definition of “progressive” (based on who it is that funds politicians who call themselves progressives, and what they actually do). Thus the community services that were supposed to replace the state hospitals remained unfunded for decades, to preserve government jobs in Upstate New York.
So are things any different today?
In 2011 New York State, with 6.9% of the total population in poverty, accounted for 22.3% of Medicaid beneficiaries of Mental Health Facility Services, down from 32.0% of such beneficiaries in 2001. Which raises a host of questions. Are New York’s mentally ill getting services they don’t need? Are residents of other states not getting services they do need? Are residents of other states getting services they do need – in New York State?
New York’s per beneficiary spending on Mental Health Facility Services was 2.4% below the U.S. average in 2011, down from 24.7% above average 2001. An optimist would say that is because more New Yorkers are getting the outpatient help they need, inflating the number of beneficiaries but reducing the cost of each, while those in other states are not getting help until they face an expensive hospitalization. A pessimist might assume that, having been stuck with a disproportionate share of the nation’s mentally ill, New York State has responded to fiscal constraints by cutting the cost/quality of their care. Despite relatively low spending per beneficiary, although New York State residents accounted for just 8.0% of total personal income, New York accounted for 21.8% of total Medicaid spending on Mental Health Facility Services in 2011, down from 26.1% in 2001.
How about the adjacent Northeastern states? In 2011 they accounted for 10.8% of the total population, 8.3% of the total population in poverty, and 10.7% of the beneficiaries of Medicaid Mental Health Facility services. That is in proportion, unlike the high level in New York. With 12.8% of total personal income, they accounted for 10.6% of total Medicaid spending on Mental Health Facility Services, a lesser burden.
As for Intermediate Care Facilities for the Mentally Retarded, New York State had 9,149 beneficiaries in 2011, or 10.1% of the national total. That was down from 11,639 beneficiaries in 2001, or 10.4% of the national total. New York’s payments per beneficiary, meanwhile increased from $183,461 in 2001, or 118.7% above the U.S. average (more than double) to $440,051 per beneficiary in 2011, or more than triple. It is for this category of Medicaid service that the federal government is demanding the most money be refunded, with potentially devastating consequences for the state budget.
http://online.wsj.com/articles/states-1-3-billion-medicaid-problem-1406686402
“At issue are the costs of caring for about 1,300 developmentally disabled people—about $2 million per patient in 2013—in nine state facilities from Staten Island to Rochester. New York’s Medicaid program is among the nation’s most expensive.”
“New York state and the federal government agreed on a payment plan in 1990. But after the Poughkeepsie Journal published a series of stories in 2010 about the extraordinary costs of the state’s so-called intermediate-care facilities, the U.S. Centers for Medicare and Medicaid Services—the agency, often called CMS, that administers the program—started its own investigation. It found that New York was making exceptionally high Medicaid payments to the facilities, which are run by the state’s Office for People with Developmental Disabilities.”
The state is phasing out these centers, but they still have lots of people on the job. The health care industry is frantically lobbying to have the resulting budget cuts spread to other services like parks, education and transportation rather than taken from New York’s Medicaid spending alone. “A Republican-led congressional oversight panel accused New York of fraud last year, allegedly overcharging Medicaid $15 billion over two decades.” Since the federal share of Medicaid is just 50 percent, that means New Yorkers have already paid an extra $15 billion in state and local taxes for Medicaid fraud. But $30 billion in fraud – half federal, half state and local – is only $1.5 billion per year. That seems low, based on what is generally known about New York’s program.
Nursing Homes and Their Alternatives
While Medicaid was initially passed as a program for the poor, a large share of its spending is on the non-poor who are merely old. As I have come to observe from our own aging relatives, while family and at-home care can handle most physical ailments no matter how severe, mental disabilities, problems and issues will land someone in a nursing home. And once someone is in a nursing home, even with a long term care policy, extensive savings, a significant defined benefit pension, and all the promised Social Security benefits for two people – all things that most in younger generations are unlikely to have when they get old – they will end up broke and on Medicaid in just a few years. A rising share of Americans outliving their brains will be a significant national issue in 20 years, and the threat of being in that situation should be a source of concern to every individual. But how does New York handle its very aged population today?
The slow-growth Northeast has a disproportionate number of old people, and New York State has a disproportionate amount of old poor people – for the moment as a result of trends in the 1960s and 1970s in New York City, and for the foreseeable future as a result of more recent trends in Upstate New York. With 6.5% of the total population and 6.9% of the poor population, New York accounted for 8.6% of the poor population over age 65, up from 8.2% in 2001. The rest of the Northeast is just as old, but not as poor. The adjacent states accounted for 10.6% of the poor population over age 65 in 2011, down from 13.3% in 2001.
New York’s seniors are also a very self-interested and politically powerful group, benefitting at the expense of those coming after in a variety of ways. One need only check the average age of a New York State legislator, and consider that as the population turns over “people like us,” according to the political class, tend to be either in Florida or the grave, with “people like them” seen mainly as a source of funds. Immigrants can’t vote, and many younger people do not. The same perpetual incumbents look to do more and more for their backers every year, while putting off the costs to a future they don’t care about.
New York State’s Medicaid spending reflects this. Here, one does not show enough respect to seniors by merely providing them with the services they need. Or even proving them with the services they don’t need. To show proper respect, the state needs to pay for services they don’t even get, and pay for seniors who don’t even exist, given that many “non-profits” with Medicaid funding are run by the relatives and associates of the state legislators themselves. (“Non-profits” better described as non-profiteers). After all, those non-existent seniors receiving non-provided services worked hard all their lives.
New York State spends more than any other state on Medicaid-funded alternatives to Nursing Homes. With 8.6% of total (45 states plus DC) poor seniors, in 2011 New York accounts for 18.0% of beneficiaries of Medicaid Home Health Care Services (down from 26.1% in 2001). It’s payments per beneficiary for Medicaid-funded Home Health Care was 56.1% above average, up from 0.2% above average in 2001. Anecdotal evidence suggests that while Home Health Care agencies are well paid, those who actually provide the services are not. With just 8.0% of total personal income from which to pay it, New York State accounted for 28.0% of total Medicaid Home Health Care spending in 2011, up from 26.1% in 2001.
Personal Support Services are the at-home, non-medical care services provided to people who are unable to take care of themselves – cooking, cleaning, dressing, bathing, toileting, etc. New York State accounted for 14.5% of total Medicaid Personal Support Services Spending in 2011, very high compared with the state’s 8.0% of total personal income but down from 38.1% in 2011 (and 48.5% of the 50-state total in 1997).
New York’s spending in this category is high despite the fact that New York State only accounted for 6.1% of the beneficiaries of Personal Support Services in 2011, due to per beneficiary spending that was 141.2% higher than the average for that year (more than double). Medicaid spending per beneficiary in this category was $3,599 in total, $8,678 in New York State, and $5,869 in the adjacent states. The difference between the adjacent states and the U.S. average may represent greater generosity. The difference between New York State and the adjacent states has to be explained some other way.
“The federal government overpaid New York’s Medicaid program at least $200 million and the money should be refunded to Washington, according to findings of a new audit” cited by the Albany Times-Union.
http://www.timesunion.com/local/article/A-200M-Medicaid-bill-5652767.php
“In areas such as home health care, continuing day treatment, orthodontic and dental coverage, and traumatic brain injury programs, the federal agency’s Office of Inspector General found millions of dollars in improper payments. Many of them were for services that were not provided or were duplicative billings. Auditors found many of the services were covered without properly documenting need.”
New York is “knee-deep in fraud” according to an attorney that represents the fraudsters when they get caught. “People try to milk entitlement programs all the time.”
Perhaps New York’s share of total spending on and beneficiaries of Medicaid Personal Support Services is going down not because its generosity is spreading, but because its fraud strategies are spreading.
“Just last week, the Washington D.C. U.S. attorney’s office announced the largest health-care fraud takedown in the history of the District. The multi-year effort led to more than 20 arrests and schemes involving millions of dollars in fraud, kickbacks and false billings in the home health-care services field throughout the nation’s capital.”
“The investigation busted personal care assistants misrepresenting the amount of time they spent with beneficiaries.”
“The reason it was ripe for fraud is that the beneficiaries would fill out bogus time sheets and submit them to home care agencies…They would say they were being seen by assistance for up to eight hours a day, when the personal care assistants were never seeing them.”
“The beneficiaries were elderly, disabled and low-income, he says, and recruiters would offer them kickbacks of $200 a week and coach the patients on what to say if someone asked about their work.”
Do all these beneficiaries of Home Health Care in New York State, and all this spending on Personal Support Services, at least save the state money on nursing home care? In 2011, with 8.6% of total persons over age 65 in poverty, New York accounted for 14.1% of Medicaid funded beneficiaries of Nursing Home services, up from 10.9% in 2001. As in the case of Inpatient Hospital Services (where many workers are also represented by the same union — Local 1199), the increase in beneficiaries offsets a decrease in payments per beneficiary – to just 3.8% above the U.S. average in FY 2011 down from 36.9% above average in 2001. New York thus accounted for 14.7% of total Medicaid spending on Nursing Homes in 2011, about the same as its 15.0% of total spending in this category in 2001, even as its share of total population fell.
The discussion of Medicaid spending on senior, and non-seniors, will continue in the next post, on Medicaid spending by age.