
This post will complete my series on different government functions based on finance data from the 2012 Census of Governments, a more long-term analysis aside. It includes data on the most governmental of government functions: the kind of activities one might expect to find taking place in city and town halls, county seats, county courthouses, and state capitals. Reviewing applications, keeping records and doing inspections, rather than providing services. The functions included are, as delineated by the U.S. Census Bureau, Judicial and Legal, Financial Administration, Inspection & Regulation, Central Staff, General Public Buildings and, at the state level, Social Insurance Administration (state Departments of Labor). I have grouped them under the title “Bureaucracy.”
When I first started compiling Governments Division data from the Census of Governments, I noted that the cost of New York’s state and local government bureaucracy per $1,000 of state residents’ personal income was about average. So was its bureaucratic employment level per 100,000 residents. In addition the cost and employment level of local government bureaucracy was about the same in different parts of New York State, broadly defined. All that made it much less interesting. There are some differences, however, and in any event I want this compilation to be comprehensive. And besides, if you add them all up at both the state and local level the cost of these government functions is substantial. In New York State it averages about 1.7% of all of the personal income of all state residents not including, in many cases, employee benefits and pensions. A brief discussion follows.
I group these categories because they overlap. While the Health function, according to the U.S. Census Bureau, includes “provision of services for the conservation and improvement of public health, other than hospital care” it also includes “health related inspections – inspection of restaurants, water supplies, food handlers, nursing homes, agricultural standards or protection of agricultural products from disease” along with animal control. It thus overlaps with the Protective Inspection & Regulation function. Since the Bureau’s Public Health function both is and isn’t “bureaucracy,” I give the Bureaucracy totals with and without it.
The “Central Staff Services” includes not only our local politicians and their personal staffs, but also clerks, recorders, and planning and zoning agencies. And while state courts and prosecutors in the “Judicial and Legal” category deal with criminal law and major civil lawsuits, local courts typically handle cases dealing with local ordinances. Parking and noise tickets for example.
A reorganized spreadsheet with state & local government data for these functions for all states, local government data for all counties in New York and New Jersey, and selected counties elsewhere, is here.
My prior post on employment in these categories, with the associated data, is here.
https://larrylittlefield.wordpress.com/2014/05/23/general-government-census-of-governments-employment-and-payroll-data/
Lets start by adding up state and local government Bureaucracy as a whole by state.
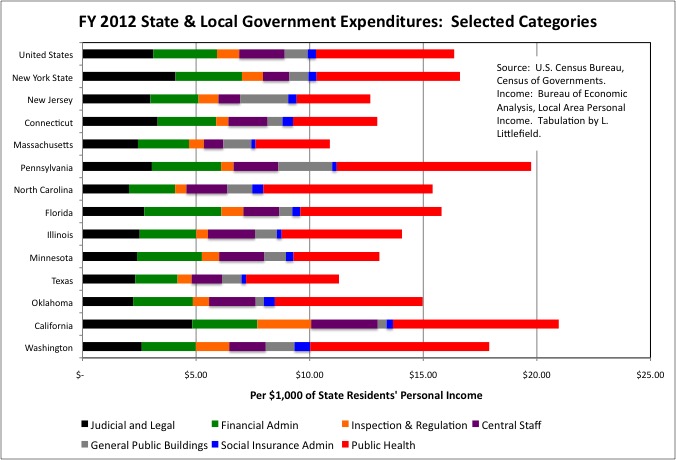
One finds that the on average state & local government Bureaucracy expenditures cost $16.36 per $1,000 of U.S. residents’ personal income, or $10.28 per $1,000 of personal income if Public Health agencies and expenditures are excluded. New York State was slightly above average at $17.21 per $1,000 of personal income overall, or $10.89 per $1,000 excluding Public Health. New York’s state & local government expenditures per $1,000 of state residents’ personal income was relatively high in the Judicial and Legal category but near or below average otherwise. Aside from General Public Buildings, of which New Jersey’s many small localities have many, that state’s state & local government Bureaucracy expenditures tended to be below average. New Jersey’s expenditures in these categories totaled $11.39 per $1,000 of state residents’ personal income with Public Health included, or $8.15 with Public Health excluded.
The pattern observed for virtually every government function (other than local elementary and secondary education), with low-tax southern and western states ironically spending more, and northeastern and Midwestern states spending less, holds for Bureaucracy as well, but to a lesser extent. High spending states, relative to state residents’ personal income, include Alaska, Wyoming, New Mexico, and West Virginia, while low spending states include New Jersey, Massachusetts, New Hampshire, Connecticut, Minnesota and Indiana. With regard to Bureaucracy, however, some states are where you would expect them to be, based on their alleged politics. Texas and Tennessee are near the bottom, with California near the top.

In geographically small states the state capital is never far away, and bureaucratic functions tend to be centralized at the state government level. While state and local government expenditures on Bureaucracy are below average, per $1,000 of state residents’ personal income, overall in New England, state government expenditures are near or above average. The Social Insurance Administration category resides only at the federal and state level, and includes the management of programs such as unemployment insurance and worker compensation (the actual payments were discussed in the post on Aid to the Needy). Both New York State and New Jersey are right on the national average in expenditures in this category.
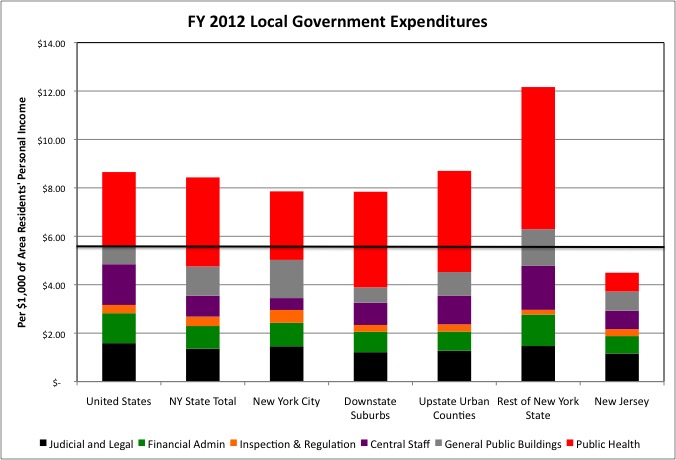
Large states tend to have their state and local Bureaucracy expenditures weighted to the local government level. Texas, low overall for state and local government Bureaucracy expenditures, is nearly at the U.S. average for local government alone, and California is far above average. Connecticut, Massachusetts and New Jersey, on the other hand, are far below average at the local level. New York State is about average. Within New York State, New York City and the Downstate Suburbs, with their relative high per capita incomes, are slightly below the U.S. average in local government spending on Bureaucracy per $1,000 of area residents’ personal income. The Upstate Urban Counties almost exactly average.
The Upstate Rural Counties are above average, but mostly due to higher expenditures on Public Health. And higher expenditures on General Public buildings, perhaps because many places are too small to have separate city halls, police precincts, etc. and thus more spending on multi-function buildings.
The “Justice of the Peace” local judicial system in many Upstate communities was the subject of at New York Times expose some years ago.
http://www.nytimes.com/2006/09/25/nyregion/25courts.html?pagewanted=all&_r=0
“The examination found overwhelming evidence that decade after decade and up to this day, people have often been denied fundamental legal rights. Defendants have been jailed illegally. Others have been subjected to racial and sexual bigotry so explicit it seems to come from some other place and time. People have been denied the right to a trial, an impartial judge and the presumption of innocence.”
Perhaps if I were Black I would feel differently, but my own view is that if I or a close relative were ever in trouble, I’d rather have my fate decided by some redneck rather than the political-related folks one finds in the official courts of places like New York City, members of a class apart from the serfs. If you have a county with, on average, low cash income and low educational attainment, the cost of lots of local judges and lawyers, all with graduate degrees and expecting commensurate salaries, would be very burdensome. And if those commensurate salaries were not paid, perhaps you’d end up with the lazy, incompetent and corrupt among them.
And as for the rights of the accused, my impression is those apply mostly to the rich, powerful, and or connected, folks like Sheldon Silver, Joe Bruno and Dean Skelos, along with those accused of something awful enough that the consequences of a conviction are sever enough to attract a high level of effort from Legal Aid. The rest are run through a plea bargain machine like parts on an assembly line.
In any event, taken together local governments in the Upstate Rural Counties end up spending about the same as other parts of the state on the Judicial and Legal function, per $1,000 of area residents’ personal income. Let’s examine expenditures on this function over time.
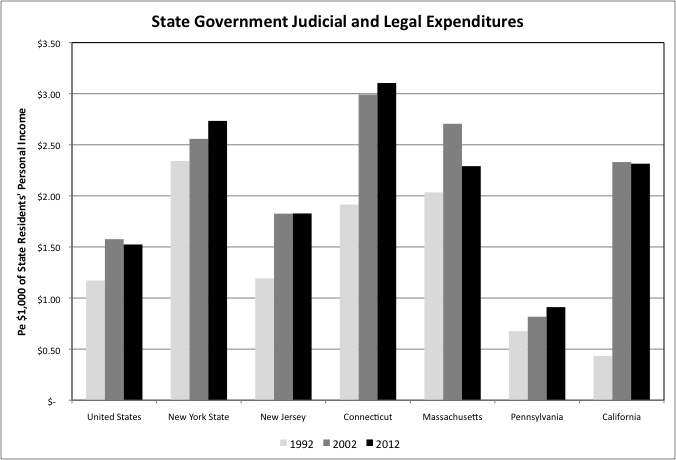
At the state level, New York’s Judicial and Legal Expenditures have bucked the tide of falling state and local government expenditures on just about everything but Medicaid, pensions and interest on debts. Measured per $1,000 of personal income, New York’s state expenditures in this category increased 6.9% from FY 2002 to FY 2012, when the retroactive pension increases of the prior ten years started to be paid for. Then again, the New York court system was so incompetent back in 1992 that some upgrades had to take place and be paid for.
http://www.nytimes.com/1992/04/11/nyregion/recording-by-hand-nassau-lags-behind.html
And the state’s top judges have tried to get reforms enacted over the years. Compared with other states, however, they can’t claim the Judicial and Legal function is underfunded in New York. Although we can’t tell from Census Bureau data what share of those expenditures are on the Courts, and what share are on public relations for the latest State Attorney General with hopes of becoming a Governor or Senator.
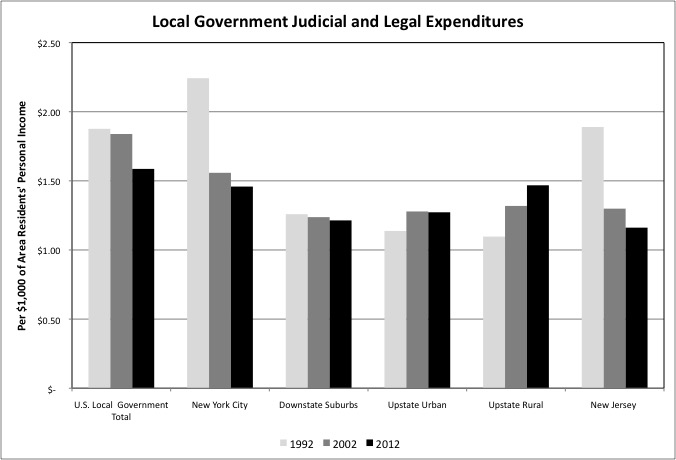
On the other hand, local government Judicial and Legal expenditures plunged in New York City and in New Jersey from FY 1992 to FY 2002. Fortunately, the days of Tammany Hall, when political hacks infested every government function in New York City, ended long ago. But there are still some backwaters where friends, relatives and political supporters can be placed to earn a living. What is scary is that one of those places is the courts, so I hope I will make it through my life without ever being involved in a lawsuit or other court case here in Brooklyn. With the NYC political hacks mostly in the other party, I guess Republican Mayor Giuliani didn’t feel like spending much on the local Judicial and Legal function. The City of New York may also be relying more on outside counsel than in the past.
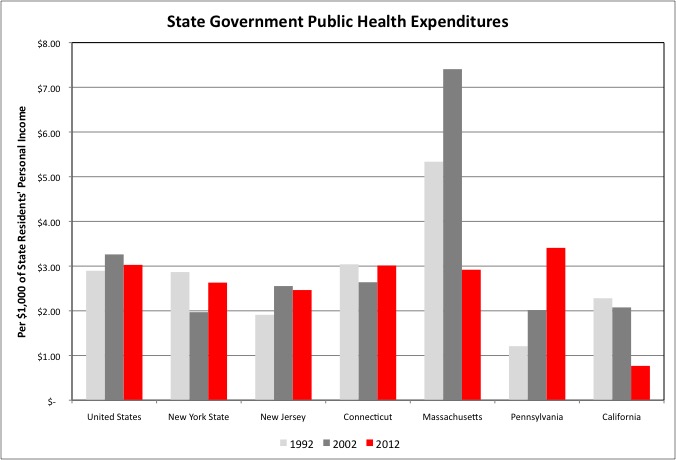
Given that shifts in state residents’ income also affect state Health expenditures per $1,000 of personal income, and inaccuracies in the data, I’d say that spending in this category for the U.S., New York State, New Jersey and Connecticut has been essentially stable over the past 20 years. The big drop in Massachusetts may be the result of state Romneycare being replaced by federal Obamacare. In Pennsylvania and California, the big drop in state government Health expenditures per $1,000 of state residents’ personal income has been balanced by a big increase in local government Public Health expenditures – just a shift in work and/or accounting from one level of government to the other.
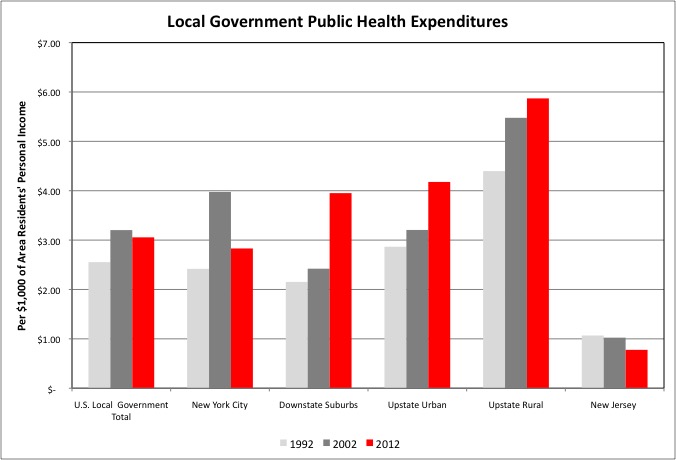
While I’m not sure what the Bloomberg Administration will be remembered for 20 years from now in general, I am sure two things will still be thought of. The 2008 25/55 deal for early teacher retirement, which (given the way those costs are being hidden and deferred) will still be crippling spending on actual education at the time. And Bloomberg’s public health initiatives. Those initiatives, however, did not mean more local government spending on the NYC Health Department over the years, per $1,000 of city residents’ personal income. Spending fell in the city from FY 2002 to FY 2012, perhaps because of the waning of the AIDS epidemic, while rising everywhere else in the state.
As I pointed out in my post on Aid to the Needy, New York’s Upstate Rural Counties apparently had expenditures in the Medical Vendor Payments category that were not covered by the federal-state Medicaid program. That may also be the case with these elevated Health expenditures outside NYC by local governments in the rest of the state. Perhaps a local political response, in places where people are against government spending on the urban poor, to the needs of people who don’t qualify as poor under federal programs.
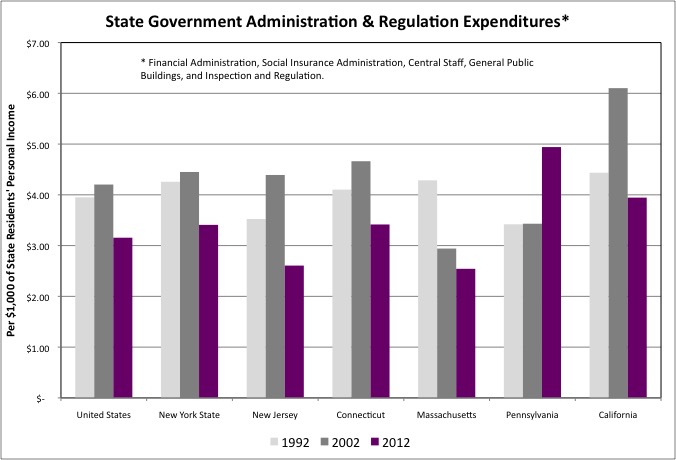
When money gets tight, “cut the bureaucracy not the schools and roads” is a convenient rallying cry. And as the cost of public employee pensions increased from FY 2002 to FY 2012, one in fact finds that state government spending on the rest of the Bureaucracy fell relative to the total income of state residents, in the U.S., New York State, New Jersey, Connecticut, Massachusetts, and California (while rising in Pennsylvania). The services summed in the chart are Financial Administration, Inspection and Regulation, Central Staff Services, General Public Buildings, and Social Insurance Administration.

One finds the same trend at the local government level. From FY 2002 to FY 2012 expenditures on the rest of the Bureaucracy, per $1,000 of personal income, fell in the U.S. as a whole, in New York City, in every other area of New York State as I have delineated them, and in New Jersey.
On one hand, I wasn’t exactly overworked when I worked in the Bureaucracy. I was bored to the point of demoraliztion, which is why I recommend that if you have to work for the government at all, at least work for an agency that provides services to people directly. Information technology, moreover, has allowed private sector firms to do more of what used to be paperwork with far fewer, albeit more highly skilled, employees. So it would be fair, if not rational, for private sector workers to expect the public sector workers they pay for to increase their productivity using these tools as well. Given advances in office work it is possible to do more of it better at a lower cost.
On the other hand, increasing productivity is not a public sector thing, because the unions are against it and their cronies control the local political offices. It’s usually the same work for more money, less work for the same money, or much less work for less money. Thus spending less on the NYC Department of Buildings gets you fewer lower paid workers, which means massive delays in getting approvals, and corruption.
http://www.nydailynews.com/new-york/nyc-crime/building-inspectors-surrender-cops-bribery-scheme-article-1.2109403
Which makes it too bad that Mayor Giuliani’s last-minute, half-ass proposal to merge the DOB with the NYC Fire Department was never followed up on.
http://www.nytimes.com/2000/12/01/nyregion/takeover-of-agency-for-buildings-is-proposed.html
Instead of just sitting around between the dwindling number of fires, firefighters could trained to ride off with their gear on scooters to do inspections of minor renovations. Small property owners and businesses could file applications at and get inspections from the local firehouse, instead of hiring expeditors to wait in the Kafkaesque lines at borough halls. A higher level unit at the NYFD could handle major renovations and new construction, complete with zoning and structural review, and firefighters with the ability who aspired to something other than two years in retirement for each year worked could train during their firefighting career to join it.
There is “pro-business” corruption and “anti-business corruption.” In “pro-business corruption, businesses bribe inspectors to overlook or not enforce rules designed to protect others – workers, consumers, or the general public. In “anti-business” corruption” businesses have to pay bribes just to be allowed to do things that they ought to have been allowed to do, or even encouraged to do, to begin with, as in the “license raj” in many underdeveloped countries.
In New York City we have much more “anti-business” corruption. I’ve seen more than one new business crippled by waiting months, while paying rent and loans, for approval to open. On the other hand, the Real Estate Board of New York opposed Giuliani’s suggestion to merge the DOB and NYFD, which implies that quite a bit of “pro-business” corruption, or at least pro big business corruption, is going on.
http://www.thefreelibrary.com/Mayor+proposes+merger.-a074268632
In any event with fewer and fewer fires, NYC firefighters are doing less and less work. I don’t think that’s what the majority of the firefighters want. They are probably as bored as I was, based on the huge contingent – firefighters, ambulances, police, etc. that showed up when my father-in-law, who was staying with us, had to go to the hospital. But based on my career in public service I’d bet that less and less work is what the majority of firefighters who show up at union meetings want, along with the Uniformed Firefighter’s Association itself. So don’t expect much reform in this area, unless the city wants to agree to a half-pay plus 25 percent for disability pension after 15 years worked in exchange.
Speaking of not getting value, consider this. If you are in NYC, you are paying enough of your income in city taxes for the City of New York to spend $0.97 per $1,000 of your personal income on local government Financial Administration. And enough of your income in state taxes for the State of New York to spend $1.99 per $1,000 of personal income on Financial Administration. If your household has $100,000 in personal income, including the value of employer-provided benefits such as health insurance and retirement, that means the State and City are collecting $300 – on average – from you to pay for Financial Administration. Except that it is in fact probably more, since those at the bottom (and seniors) pay little in state and local income taxes.
So how come the person providing the people of New York and New Jersey with this compilation of comparative public finance is me, in my spare time? And how come state budget documents, and those of the State Comptroller, are nearly incomprehensible, even to me, even though I have been following public finance issues for 25 years? The answer is that the City and State Comptrollers aren’t really elected by the people to provide them with information. They are installed by special interests to make sure they aren’t provided with that information. Thus my motivation.
What is it that they don’t want people to know? For one thing how much younger generations of New Yorkers, and those foolish enough to become future residents of the city and state, have been cheated by Generation Greed. With regard to state and local debt, infrastructure investment, and pensions. Over and above the federal ripoffs, the private sector ripoffs, and family disintegration. As aging pre-Generation Greed member Paul Volker, out of step with the generations that followed his, feels compelled to point out.
http://www.nytimes.com/2015/06/09/business/dealbook/volcker-sees-hidden-peril-in-state-budgets.html
Since the extent to which the future is sold out at the state and local government level varies from state to state, it is to that issue I will turn next. The goal will be a sensible and defensible “sold out future” ranking. When I did this back in 2010, based on 2007 Census of Governments data, I found that New York City, if it were a separate state, would have had the fourth most sold out future among the 50 states and DC, behind Rhode Island (where services are being gutted due to a state and local pension crisis), Massachusetts (where the transit system is in collapse) and Hawaii. NYC would have ranked lower were it not for extensive NYC infrastructure investment. The rest of NY State would have ranked 34th. How about now? You’ll find out a few days after I do.