
For twenty years it was the same dance. The Mayor would play the bad guy and propose a budget that would threaten cuts in funding for the Department of Parks and the Department of Libraries, knowing full well the city would have enough money to restore the cuts. This would allow the parochial members of the City Council to “fight for the people” to get the money back for THEIR constituents. In exchange for the Mayor being able to make all the serious decisions, with both winners and losers, that the Council members sought to avoid.
Then incoming Mayor DeBlasio promised to end the old game, to the delight of Parks and Libraries advocates. After which the City Council, desperate for organized interests to pander to, demanded the addition of 1,000 more police officers, even though New York City already has 2.8 times as many police officers per 100,000 residents as the U.S. average, and far more than that in retirement. So one year later, from what I read in the media, a sadder but wiser Mayor DeBlasio has brought back the same old game. Amidst all the politicking what does the City of New York, and for that matter the State of New York, spend on Parks, Recreation, Culture and Libraries compared with other places? The next post uses Census of Governments data to find out.
This is yet another post based on my tabulation of public finance data from the U.S. Census Bureau’s Census of Governments. If you haven’t done so already, you can find out where the data comes from and how it was tabulated, and download spreadsheets with data on all government functions for all areas, here.
https://larrylittlefield.wordpress.com/2015/04/12/background-and-databases-2012-census-of-governments-state-and-local-finance-data/
The 2012 data from the employment phase of the Census of Governments was released last year, and I wrote a post on Parks & Recreation and Libraries employment located here:
https://larrylittlefield.wordpress.com/2014/05/16/parks-libraries-and-sanitation-2012-census-of-governments-employment-and-payroll-data/
One might wish to read that post before this one. This post is about state and local government expenditures, per $1,000 of all the personal income of area residents, in selected categories. A reorganized spreadsheet with the data on Parks & Recreation, Natural Resources, and Libraries for every state, every county in New York State and New Jersey, and selected counties elsewhere is here:
It also includes the charts used in this post.
Since there is a limit to the number of posts I intend, to write the tables also include a few oddities – Miscellaneous Commercial Activities, state and local government run Liquor Stores, and Net Lottery Revenues. While Parks, Culture and Libraries represent the noble aspirations of government for the people’s health, well-being, and uplifting education, these other government functions attempt to cash in on their real preferences, or at least many of them. We’ll see how New York compares with other places in these two categories, starting with a state-level summary.
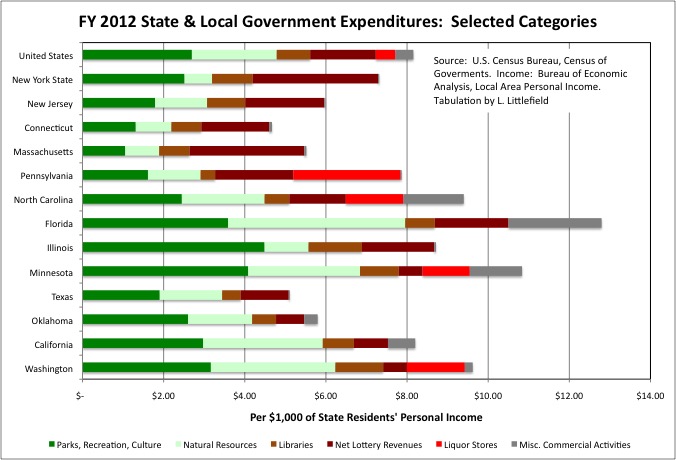
It turns out that for state and local governments combined, New York State’s expenditures on Parks and Recreation (including Cultural spending), Natural Resources, and Libraries combined was below the U.S. average as a share of local residents’ personal income in FY 2012. New Jersey is lower still, with Connecticut and Massachusetts even lower. Of course these states have above average per capital personal incomes, but they also have above average costs of living. Measured per $1,000 of personal income, which adjusts for the local cost of living and ability to pay, these Northeastern states were not high spenders.
On the other hand New York, New Jersey and Connecticut were above average with regard to Net Lottery Revenues, with New York State one of the highest in the country per $1,000 of its residents’ personal income. The states that were higher than New York are not among those I generally use for comparisons with this state: little Rhode Island and Delaware, West Virginia and Oregon. Nearby Pennsylvania is one of the few states that still have a state or local government monopoly with regard to Liquor Stores.
Note that compared with other government functions discussed on previous posts, the amounts of money spent on these services is not large. For Parks & Recreation, Natural Resources, and Libraries combined, state and local government expenditures totaled $5.61 per $1,000 of U.S. residents’ personal income in FY 2012, or 0.56% of everyone’s personal income. The figure for New York State was $4.19; the figure for New Jersey was $4.01.
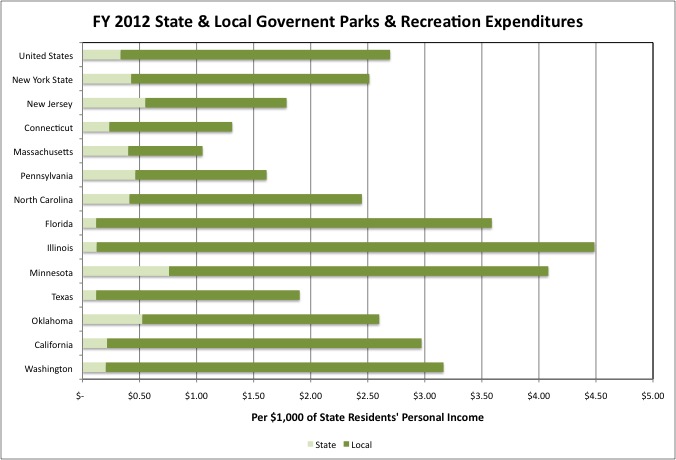
Examining these government functions individually, New York State was slightly below the U.S. average in state and local government Parks and Recreation expenditures, per $1,000 of personal income, in FY 2012. The New York figure was $2.51, while the U.S. average was $2.70. The State of New York’s Parks & Recreation expenditures equaled $0.43 per $1,000 of state residents’ personal income that year, above the U.S. average of $0.33 for all state governments, but local government Parks & Recreation spending was below the U.S. average in New York State
Spending in this category, in fact, was generally low throughout the Northeast. The highest spending states were in the West, where the federal government also has extensive National Parks, and the Midwest. The top five states were Nevada, Wyoming, Utah, Colorado, and North Dakota. The bottom five were Massachusetts, New Hampshire, Connecticut, Rhode Island, and Delaware. Once again it appears that the states where politicians complain the most about “big government” are those that actually have it.
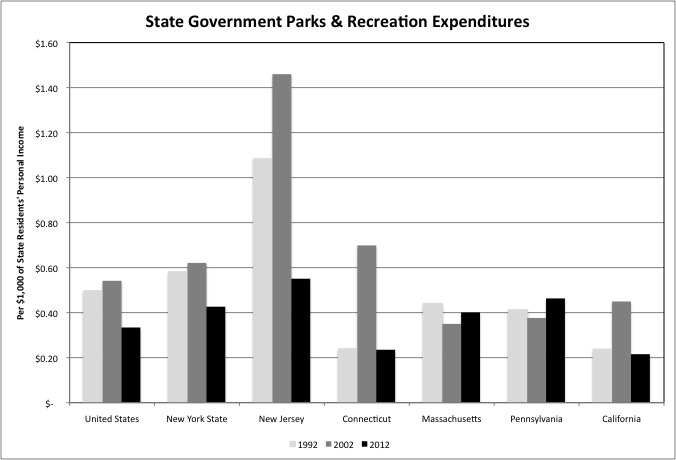
During the 2002 to 2012 period, as incomes have stagnated and pension costs soared, state government spending on Parks & Recreation fell in New York State, New Jersey, Connecticut, California and the U.S. as a whole. In New York State the drop was nearly one-third, relative to the income of state residents. Fortunately, the drop in funding did not prevent two of New York State’s parks, Watkins Glen and Letchworth, from ending up in the top five in the country according to a national ranking.
http://www.10best.com/awards/travel/best-state-park/
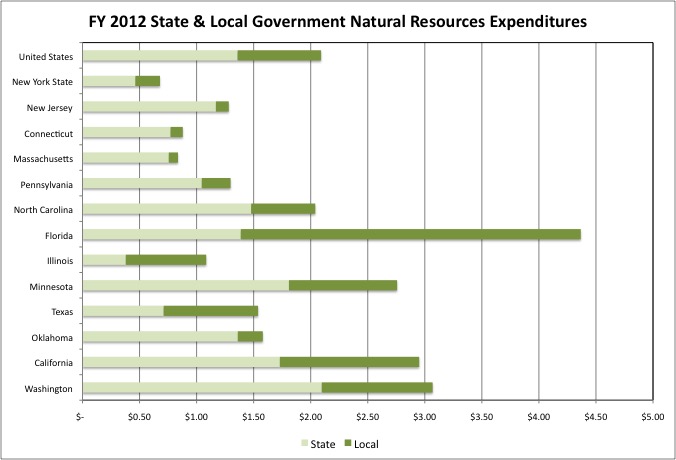
Relatively low in Parks & Recreation expenditures per $1,000 of personal income in FY 2012, the Northeastern states were also relatively low in Natural Resources expenditures that year. This includes expenditures on government programs to promote or regulate businesses and activities such as Agriculture, Forestry, Fishing and Hunting, activities and businesses the Northeast has less of than other parts of the country. It also includes the regulation of pollution. The State of New York’s state expenditures on Natural Resources, per $1,000 of personal income, was below the U.S. average in FY 2012 even though the New York State Department of Environmental Protection also operates campgrounds and park areas, in competition with the New York State Department of Parks, Recreation and Historic Resources.
In Washington State, meanwhile, extensive federal and state expenditures are required to preserve the salmon fisheries, given the presence of dams on their spawning rivers. The California Air Resources Board is one of the largest and most powerful environmental regulators in the U.S. I’m not sure why state government spending in the Natural Resources category, per $1,000 of personal income, was so high in Florida. Perhaps it has something to do with the Everglades.
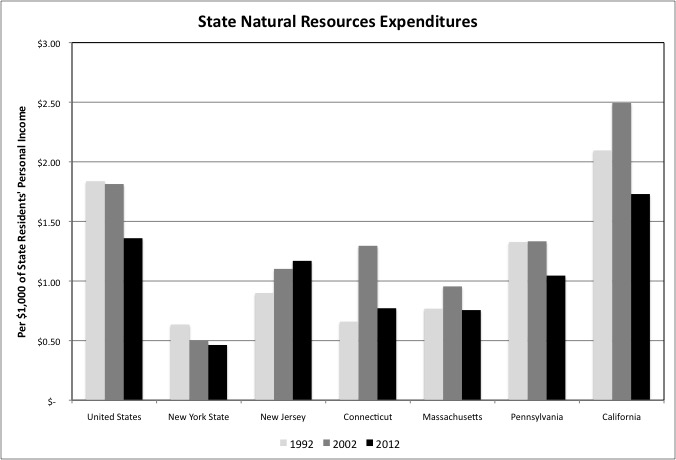
New York’s state expenditures on Natural Resources fell only slightly from FY 2002 to FY 2012, per $1,000 of state residents’ personal income. Spending fell significantly in California and the U.S. as a whole.
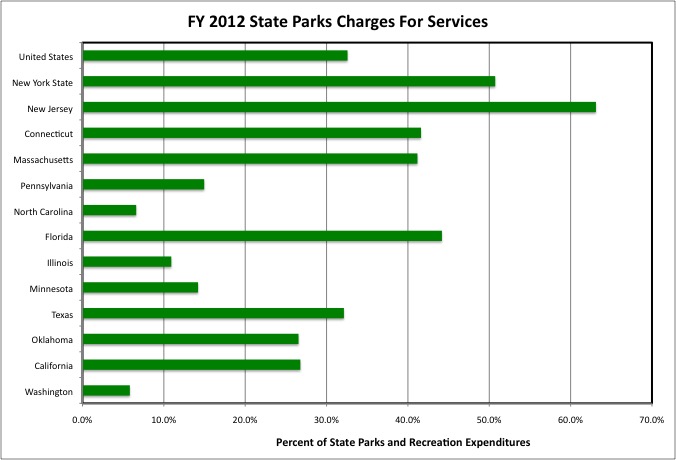
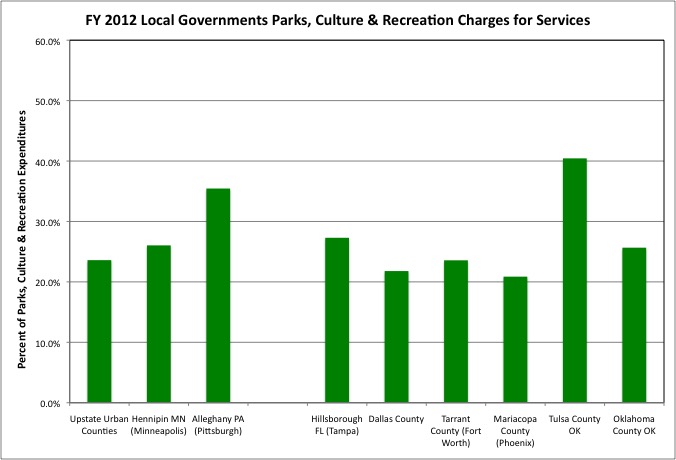
A visit to a state park, or overnight camping there, generally involves a fee. Across the country those charges equaled, on average, 32.6% of state government expenditures on Parks & Recreation in FY 2012. The charges covered a higher share of total costs in New York State, at 50.7%, and adjacent states, at 63.1% in New Jersey, 41.6% in Connecticut, and 41.2% in Massachusetts. So not only were state government Parks & Recreation expenditures relatively low in the Northeast, relative to state residents’ income, but also the share of those expenditures covered by taxes was low as well.
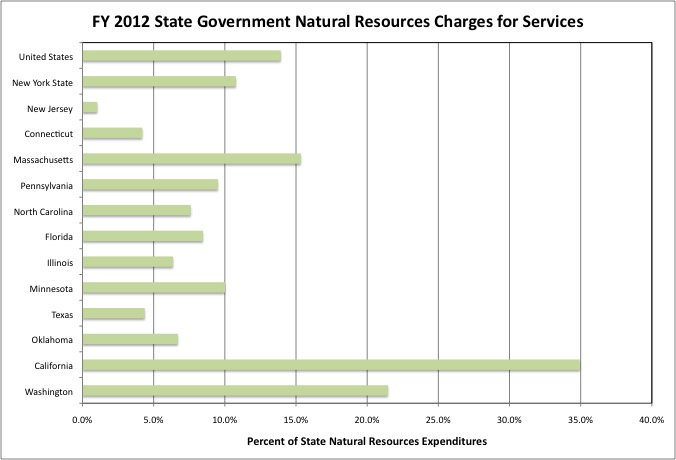
On the other hand in appears that New York’s hunters, fisherman and polluters catch a break with regard to fees, relative to the U.S. average. Charges for services equaled just 13.9% of total U.S. state government Natural Resources expenditures in FY 2012, compared with just 10.8% for New York State, 1.0% for New Jersey, and 4.2% for Connecticut. The State of California relies far more on charges for services to fund its Natural Resources programs, at 35.0% of total expenditures. Charges cover just 26.8% of Parks & Recreation expenditures in that state.
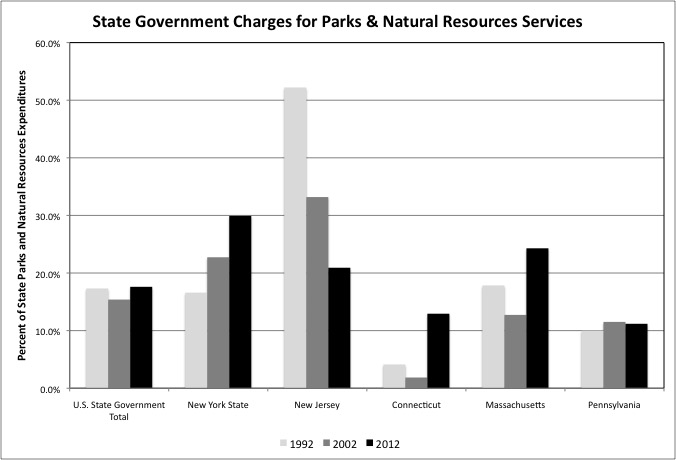
Combining Parks & Recreation and Natural Resources, one finds that that the State of New York is relying more on charges and less on taxes to fund its expenditures, relative to the past. So is Connecticut, where tolls on I-95 were once used to fund state parks on the Long Island Sound. That state charges non-residents a higher state park fee than Connecticut residents.
http://www.ct.gov/deep/cwp/view.asp?a=2716&q=325082&deepNav_GID=1650
Something New York State does not do, although it might consider a special higher fee for residents of Connecticut.
http://nysparks.com/parks/10/fees-rates.aspx
Meanwhile, state Parks & Recreation and Natural Resources in New Jersey have come to rely less on charges and more on taxes to fund operations over the years.
One of the advantages of living in a densely populated city is that you can take advantage of shared amenities, such as public parks and libraries, rather than paying for your own private amenities, such as one’s own large backyard and book collection. At least in theory.
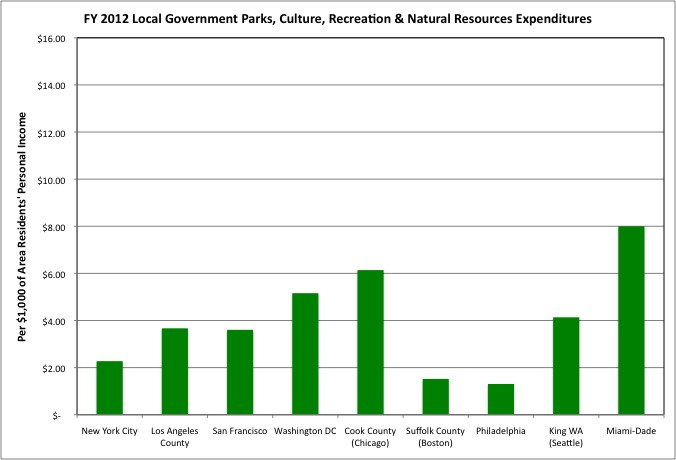
Although New York City is one of the most densely populated cities in the U.S., in FY 2012 its local government expenditures on Parks & Recreation and Natural Resources combined totaled just $2.27 per $1,000 of city residents’ personal income, below the U.S. average of $3.09 and even the New York State local government average of $2.30. It should be noted that the Census Bureau counts of all the activities of the New York City Department of Environmental Protection under water and sewer expenditures, so the city has no expenditures in the Natural Resources category.
Local governments in most other major urban counties had much higher expenditures in these categories, per $1,000 of their residents’ personal income. Standing out for particularly high expenditures were local governments in Cook County (Chicago), perhaps because the City of Chicago has a separate government for parks (the Parks District) that gets to decide how much to collect in property taxes and fees and spend on parks, without trading off against other municipal needs. FY 2012 expenditures in Cook County equaled $6.14 per $1,000 of county residents’ personal income. Parks & Recreation and Natural Resources expenditures were even higher in King County (Seattle) and Miami-Dade in Florida. Meanwhile, expenditures in these categories were even lower than NYC in Suffolk County (Boston) and the City of Philadelphia (co-terminus with Philadelphia County), relative to the income of residents of those counties. The city of Boston has relatively little park space relative to its population, while the City of Philadelphia is broke.
Keep in mind, however, that the NYC Parks & Recreation expenditures tabulated by the Census Bureau do not include pension contributions on behalf of Parks & Recreation employees. These are excluded as an internal transfer, because the City of New York has its own pension funds, something that is also true of Los Angeles, Philadelphia, San Francisco and Chicago. Nor do NYC’s Parks & Recreation expenditures include the health insurance payments on behalf of active & retired Parks & Recreation workers. Aside from the schools and mass transit, the benefits of all city workers end up lumped together under “Other and Unallocable” in the Bureau’s data. That said, NYC’s benefits for Parks workers are not nearly as costly as they are for its teachers, police officers, firefighters, and other “uniformed” employees.
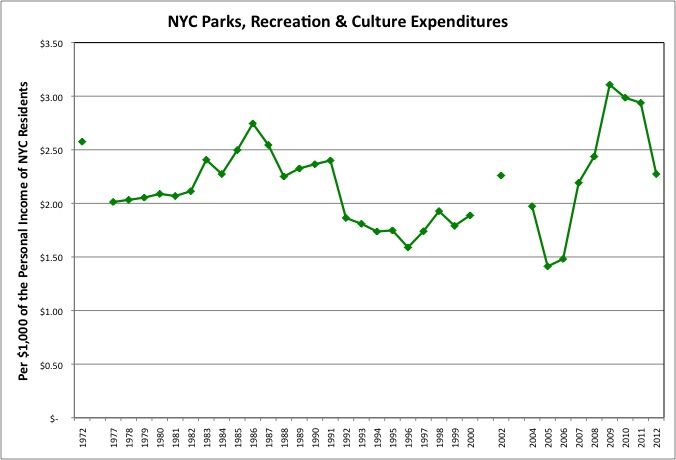
Before the 1970s fiscal crisis NYC’s Parks & Recreation expenditures were much higher, per $1,000 of city residents’ personal income, than they have been most of the time since. These expenditures equaled $2.58 per $1,000 of city residents’ personal income in FY 1972, during the Lindsay Administration. That level was only exceeded during the peak years of the 1980s stock market bubble, during the Koch Administration, and three years of the Bloomberg Administration during the Great Recession – when the income of city residents plunged but high capital spending was funded by debt.
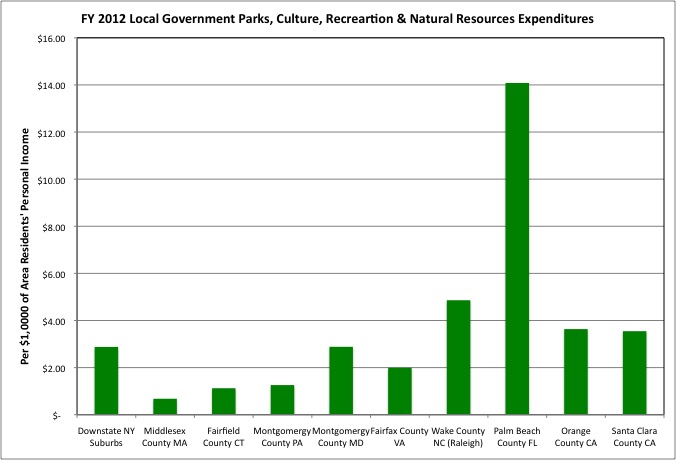
Relative to the high incomes of their affluent residents, local government expenditures on Parks & Recreation and Natural Resources combined averaged $2.88 per $1,000 of personal income in New York’s Downstate Suburbs in FY 2012, below the U.S. average but well above the level of expenditures in New York City. Local government expenditures were as low, or lower, relative to county residents’ income in other affluent suburban counties along the Northeast Corridor, but higher elsewhere. Among the Downstate Suburbs, expenditures are higher, per $1,000 of county residents’ personal income, in Nassau, Suffolk and Putnam counties than in Westchester and Rockland.
The Downstate Suburbs also have extensive state parks, which New York City does not. Most New York State parks, however, are located in rural Upstate New York, where local government expenditures in these categories were lower per $1,000 of personal income than in New York City in FY 2012.
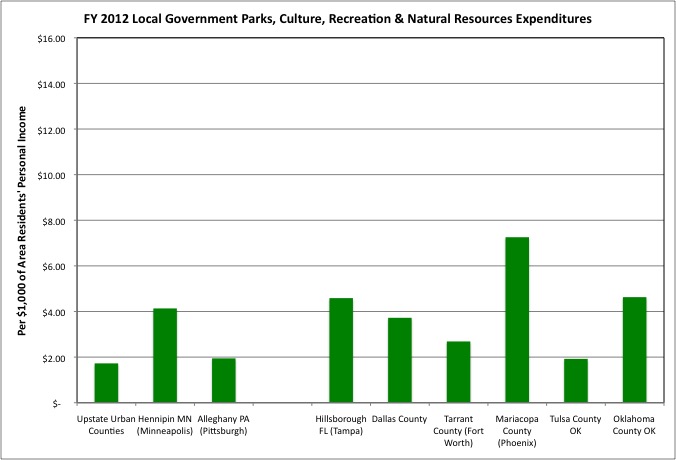
In FY 2012 local government expenditures on Parks & Recreation and Natural Resources combined totaled just $1.72 per $1,000 of are residents’ personal income in the Upstate Urban counties. That was well below the U.S. average or $3.09 or even NYC at $2.27. In fact local government expenditures in these categories were below the NYC average per $1,000 of personal income in every Upstate Urban County other than Broome (Binghamton), and the average for these counties were below the average for most other counties chosen for comparison.
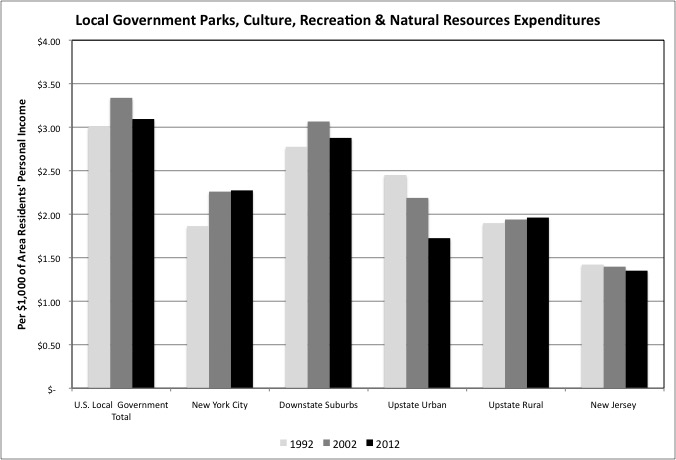
New York City’s Parks & Recreation and Natural Resources expenditures were not high in FY 2012 relative to the U.S. average, per $1,000 of its residents’ personal income, but they were higher than they once were, thanks to an increase from FY 1992 to FY 2002. Parks & Recreation expenditures hit rock bottom in NYC during the mid-1990s,
when the city’s Parks Commissioner used borrowed capital money for basic maintenance. A strategy for many New York City public facilities in good times and bad. Which is why the future is likely to see fewer and fewer good times.
The Upstate Urban Counties, collectively, have gone in the other direction, from spending more than NYC to spending less, thanks to ongoing fiscal crises there. The pension plans administered by the State of New York are far better funded than those of the City of New York. But the Upstate Urban Counties are still being squeezed by rising retiree health insurance costs, which were not pre-funded when those retirees were working, and shrinking tax bases. The “everybody on the payroll and into the pension system” “economic development” plan for the part of New York State outside New York City during the Pataki Administration is causing fiscal harm 15 or so years later.
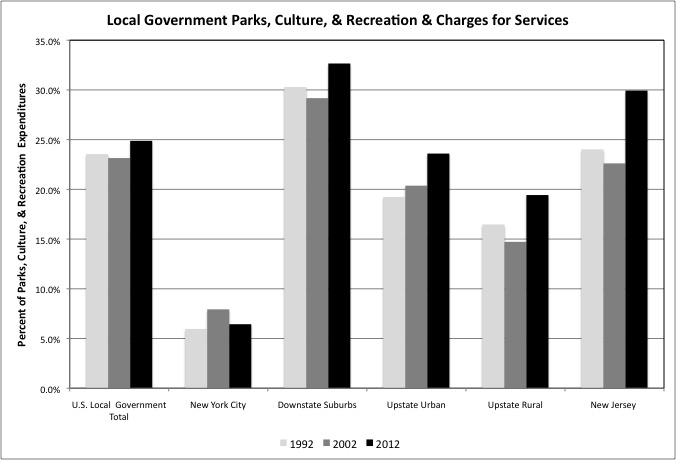
While the NYC press and advocates liked to complain about New Yorkers being “nickeled and dimed” to death during the Bloomberg Administration, the data shows that NYC’s charges for Parks & Recreation Services equaled just 6.4% of city spending in the category in FY 2012, far below the U.S. local government average of 24.9%, the 32.7% in the Downstate Suburbs, the 23.6% for the Upstate Urban Counties, or the 29.9% in New Jersey. And the city’s fees covered about the same share of Parks & Recreation expenditures as they did 20 years before that in FY 1992.
There are, however, some caveats.
First, county and municipal parks departments often provide general services, such as playing on the grass, in the playground, or on the sand, for free, but have charges for extras such as pools, bathhouses, skating rinks and golf courses. New York City’s parks have fewer of those extras, compared with the city’s population, and thus collect fewer charges. Low percent of total NYC Parks & Recreation expenditures covered by charges, therefore, doesn’t necessarily mean that services that incur charges elsewhere are free in New York.
Second, among the facilities that are charged for elsewhere are municipal and county-run zoos, botanic gardens, museums and cultural facilities. In New York City virtually all of these have been outsourced to non-profit organizations. So the Census Bureau’s data includes some of the expenditures – as city funding for those non-profits – but not the charges the non-profits impose. That reduces the charges for services as a percent of local government expenditures in New York City for the Parks & Recreation category.
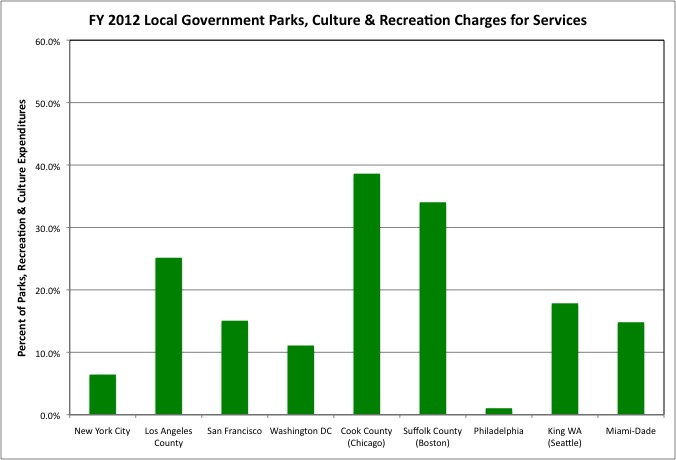
NYC’s charges for services were lower, as a percentage of local government Parks & Recreation expenditures, than in most of the other major urban counties around the country. Implying that in other major urban counties more recreation and cultural facilities that carry charges are municipal and county-run, rather than private non-profit run. Local governments in Cook County, which includes the Chicago Park District, cover nearly 40.0% of their Parks & Recreation expenditures with charges. Even though I can tell you, having just returned from Chicago, that the Lincoln Park Zoo is free.
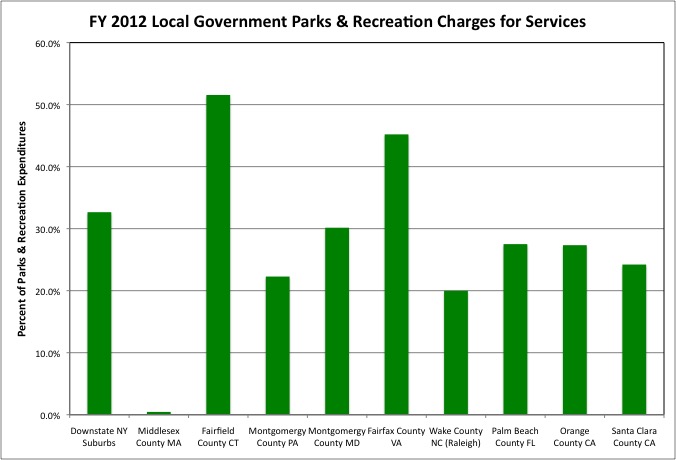
While New York City covered only 6.4% of its local government expenditures on Parks & Recreation with charges in FY 2012, New York’s affluent Downstate Suburbs covered 32.7% of their expenditures with charges. Most affluent suburban counties included for comparison also covered a relatively high share of the their local government Parks & Recreation expenditures with charges, with Fairfield County in Connecticut topping the list at 51.6%. If zoning is used to ensure that everyone in an community has approximately the same income, as has been the case in the Northeast since the early 1970s, then funding services with charges rather than taxes doesn’t raise any social equity concerns, as it does in NYC.
The Upstate Urban Counties on average covered 23.6% of their local government Parks & Recreation expenditures with charges in FY 2012, more than in NYC, less than in the Downstate Suburbs, and about the same as in the other urban counties chosen for comparison.
Like New York City’s zoos, botanic gardens, museums and other cultural organizations, New York City’s libraries have been contracted out to non-profit organizations. Their employees are not public employees, and did not show up in the prior analysis of public employment. New York City’s funding for these non-profit libraries, however, does show up in Census of Governments finance data, and it is to libraries that we turn next.
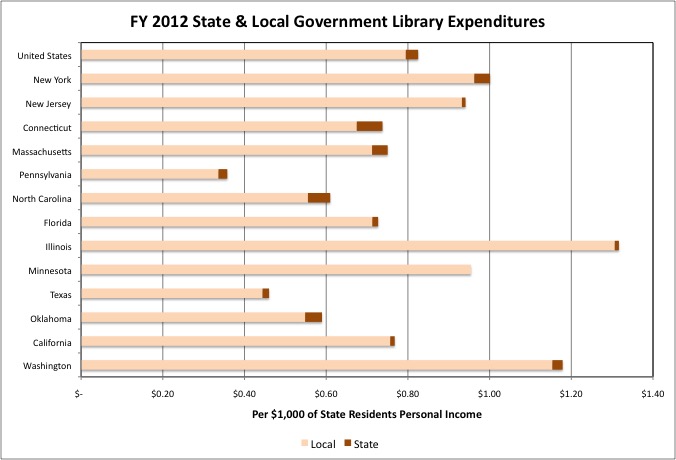
Most government Libraries expenditures are at the local level, and on average local governments in New York State spend more on this function, per $1,000 of their residents’ personal income, than the U.S. average. The same may be said of New Jersey. This is one government function on which Sunbelt states such as Florida really do spend less than states in the Northeast. But in any case the spending totals are not large at $1.00 per $1,000 of personal income for New York State, or 0.1% of income, in FY 2012. The U.S. average is $0.83 per $1,000 of personal income for state government and local government libraries together, or $0.79 per $1,000 of personal income for local government Library expenditures alone.
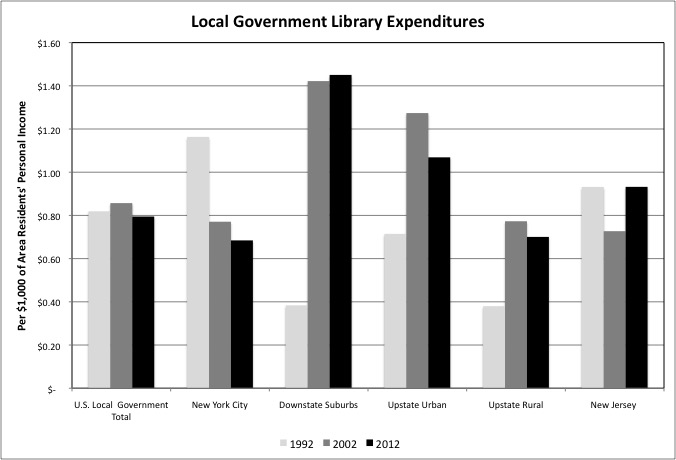
Within New York State, local government Library expenditure were below the U.S. average in New York City, at just $0.68 per $1,000 of city residents’ personal income. That, in turn, is down from $0.77 per $1,000 in FY 2002, and $1.16 per $1,000 of personal income in FY 1992. Local government Library expenditures have fallen in the U.S. as well over the years, per $1,000 of U.S. residents’ personal income, but by far less.
With producer interests, contractor organizations and the public employee unions, dominating state and local government in New York State perhaps more than in any other state, and in New York City perhaps more than in any other large city, city residents are always faced with demands to pay more in exchange for less. Unless money is borrowed and costs deferred to cover the gap. Exiled to the non-profit sector, however, New York’s librarians seem to have fallen outside the charmed circle of entitled rationalizers, and have been progressively squeezed.
Local government Library expenditures, meanwhile, have soared per $1,000 of personal income in New York’s affluent Downstate Suburbs, from just $0.38 per $1,000 of personal income in FY 1992 to $1.45 per $1,000 of personal income – far more than NYC or U.S. averages – in FY 2012. This implies either that the FY 1992 figure is in error, or that many suburbs added library service for the first time between FY 1992 to FY 2002. Or that in many suburban towns endowments for libraries ran out of money between FY 1992 and FY 2002, requiring government expenditures to take their place.
Despite fiscal pressures, local governments the Upstate Urban Counties continued to spend more in on Library services in FY 2012 than in FY 1992, per $1,000 of their residents’ personal income, and far more than New York City. There was a substantial drop from FY 2002 to FY 2012, however, with local governments in the Upstate Urban Counties averaging $1.07 in Library expenditures per $1,000 of are residents’ personal income in the latter year. As in the Downstate Suburbs, local government Library expenditures jumped in the Upstate Rural counties from FY 1992 to FY 2002, were only slightly higher than in NYC in FY 2012 at $0.70.
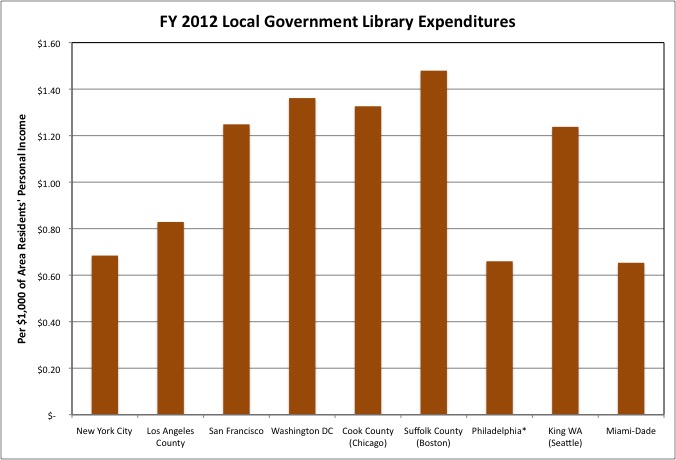
Lower than the U.S. average, NYC’s local government Library expenditures were lower than in most other major urban counties in FY 2012, while approximately matching the broke city of Philadelphia and “Sun and Fun” county of Miami-Dade. With physical books nearly obsolete for all but recreational reading, libraries have evolved into a role of bridging the digital divide. But they are less able to serve that role in New York City due to limited funding for equipment and limited hours, far less than the city promised when it accepted funding from the Carnegie Foundation in 1901.
http://www.wsj.com/articles/report-says-new-york-city-libraries-should-be-open-more-libraries-agree-1428625533
According to a report from the Wall Street Journal, subscription required.
“Measured by operating hours, New York City’s libraries now rank among the worst in the state, according to the report by the Center for an Urban Future, a public-policy think tank in New York City. The city’s three systems average 44.7 hours a week—behind all but one of the state’s largest counties and six of the largest U.S. cities, including Los Angeles, Chicago and Philadelphia.” Matching up with the Census Bureau’s expenditures data.
Note also that the difficulties posed in measuring spending on other government functions for NYC with Census Bureau data, the exclusion of taxpayer pension contributions and other employee benefit costs, do not apply to NYC’s libraries. The city’s contribution to the library non-profits is all they get.
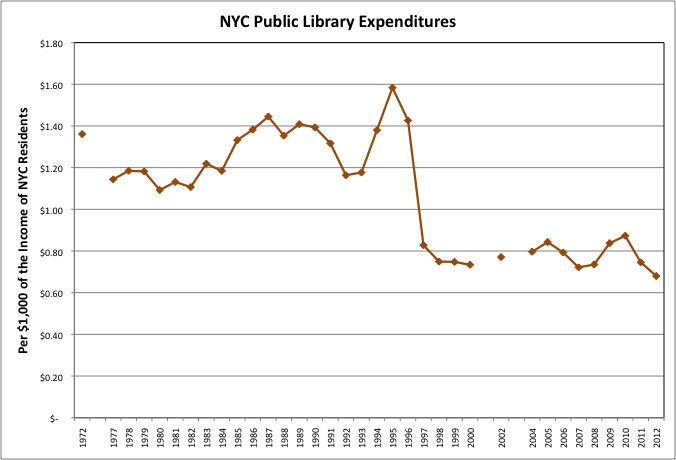
As is the case for Parks & Recreation, NYC’s expenditures on the Library function, measured per $1,000 of city residents’ personal income, have rarely matched the pre-1970s fiscal crisis level represented by FY 1972. As for parks there were some high spending years in the late Koch Administration. A brief spike in the early Giuliani years, NYC Library expenditures plunged relative to the income of NYC residents, never to recover.
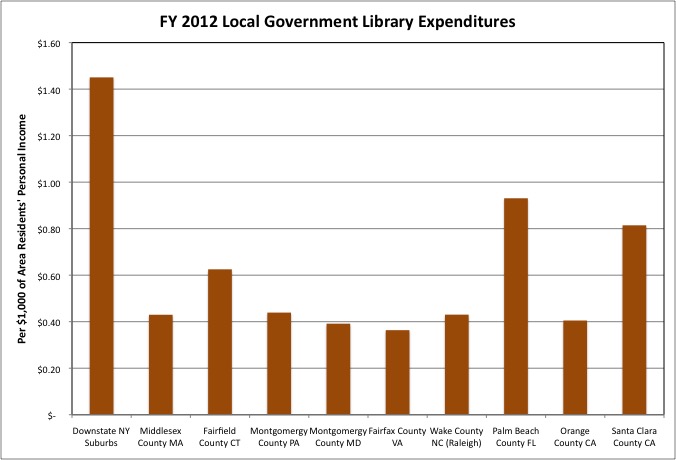
Most people in affluent suburban counties have enough money for their own books, computers and subscriptions, and spending in those sorts of counties tends to be below the U.S. average of $0.79 per $1,000 of personal income. Not so in New York’s Downstate Suburbs or, once again, in high-spending (relative to county resident’s income) Palm Beach county in Florida. Perhaps the issue is that much of the taxpayer income supporting those government expenditures in Palm Beach County is recorded elsewhere, at homeowners’ primary addresses.
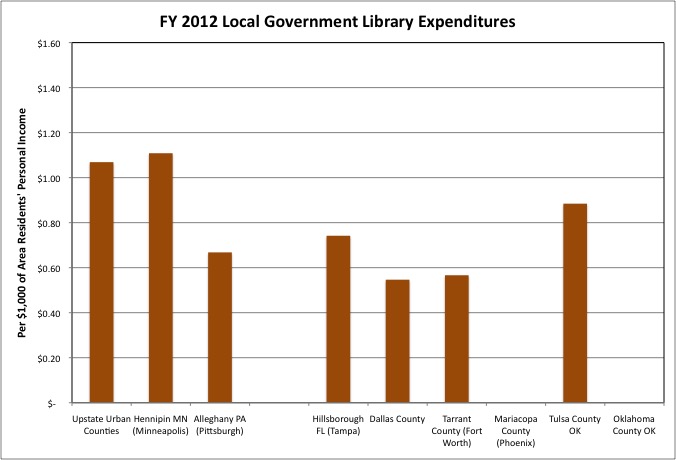
While the average local government Library expenditures per $1,000 of personal income in New York State’s Upstate Urban Counties was at about the same level as in Hennipin County (Minneapolis) in FY 2012, it was higher than in the other counties chosen for comparison, including Alleghany (Pittsburgh).
That leaves state and local government spending on oddities and vices. There are basically two things you need to know about this.
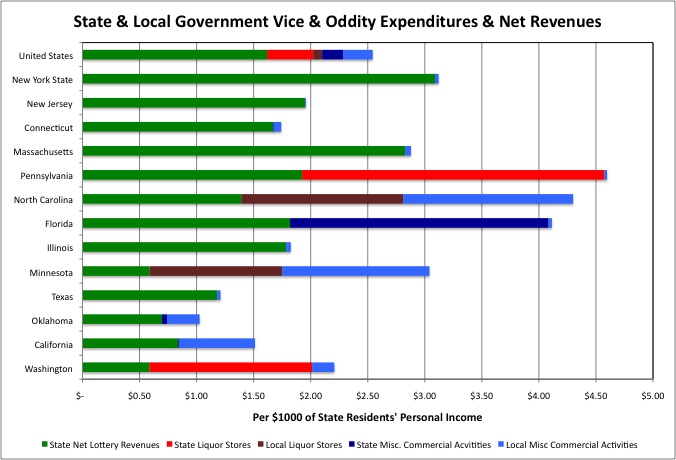
The State of New York makes a lot of money from gambling. In general, however, the state tends to outsource vice to the private sector while attempting to make money by taxing it. New York is not among the states where government runs the liquor stores.
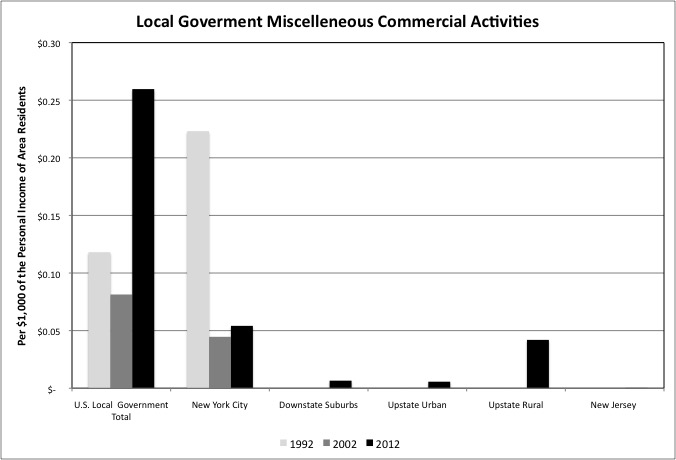
At one time, however, New York City did have extensive local government expenditures in the Census Bureau’s “Miscellaneous Commercial Activities” category. According to the Bureau, this category is the “provision and operation of publicly-owned commercial facilities not classified under particular functions, utilities, or social insurance trust activities” and includes “expenditure for operating public markets, cemeteries, grain elevators, or disaster insurance systems if classified as part of the general government.” Much of the growth has been in state run hurricane insurance. But there are no grain elevators or public hurricane insurance in NYC. We are talking about the now-defunct city-run “Off Track Betting” parlors, “the only bookie that can’t make money.”
What does this mean? It means that as the cost of past deals closes in, and politicians face the reality of informing the general public that they will have pay more in taxes, or accept less in services, or both to pay for those deals, those politicians often see “vice” funding as a way out. Tobacco taxes & settlements, all bonded and spent up front. Legalized liquor during the Great Depression. Marijuana in the wake of the Great Recession. Lotteries. Taxes on casinos until so many casinos were approved across the country that they, too began to lose money.
So use your imagination. We already have official NYC condoms. How about official NYC-run brothels, rationalized on “progressive” grounds as a source of female empowerment and protection from pimps? How about official State of New York opium and crack dens, a decade or so removed from medical marijuana, to undercut the “drug dealers” — while grabbing most of their profits? I could see it, with two additional characteristics. The money would go to pay for past and future pension deals, not parks or libraries. And after unionization and a few more retroactive pension deals to benefit the ex-employees of the new “government services,” the government-run brothels, opium and crack dens would start to lose money too.
The next post in this series will be about a series of government functions grouped together as “bureaucracy.”