
For nearly 30 years Americans, individually and collectively, have sold the future to live for today. In the private sector each generation of Americans since those born in the mid-1950s has been paid less on average, and yet has spent more, failing to save for retirement and borrowing to make up the difference. Corporate executives had their firms borrow, not to invest in income producing assets, but to buy back stock, temporarily increasing stock prices so they could cash in on bonuses and options. Despite future financial strains on Social Security and Medicare from the retirement of the large Baby Boom generation, the federal government cut taxes drastically in the early 1980s and again in the early 2000s, while spending with abandon on health care for older seniors, ultimately leaving behind a pile of IOUs that someone else will have to pay somehow.
At the state and local government level infrastructure investment was cut but debts were increased, leaving behind roads, bridges, water, sewer, and transit systems and schools in need of repair with no money to pay for this. And pensions for older public employees who were cashing in and moving out were retroactively increased even as pension funding was cut, leaving a financial disaster behind. The state and local government aspect of this future selling, however, varies in severity from place to place. Using an analysis of Census of Governments data from the U.S. Census Bureau, this post will rank the extent to which each state’s future has been sold by its current and past politicians and the interest groups that supported them.
This post and the next two, which will discuss debts, infrastructure and pensions in more detail, will complete the series based on the finance phase of the 2012 Census of Governments. Prior posts explained where the data comes from and how it was tabulated, and compared different states and local areas based on their tax burden, other revenues, and expenditures on education, the needy, public safety, infrastructure, parks and libraries, and bureaucracy. The first post in the series is here,
and includes spreadsheets with state and local government data for every state, and local government data for every county in New York State and New Jersey and selected counties elsewhere. Additional posts on each subject followed, and can be read by following the links at the bottom of the post before.
This post will show the extent to which the state and local taxes people pay are being sucked into the past, rather than being used for any current public services or benefits at all. The spreadsheet I have prepared excess the limits for Room Eight. Its tables include 1972 to 2012 data for every state, and for New York City and the rest of New York State separately, on state and local government debts, past infrastructure and education capital construction expenditures, and pension funding levels and taxpayer and employee contributions, pension benefit payments, and pension assets. If you want it, and you should, you’ll have to switch over the “Saying the Unsaid in New York.”
https://larrylittlefield.wordpress.com/2015/06/24/sold-out-futures-a-state-by-state-ranking-based-on-the-census-of-governments/
The information is summarized in a series of tables one can examine by clicking at the tabs at the bottom of the spreadsheet. The charts used in this post and the next two follow to the right. And rather than bury the lead to force people to read all the details, as usual, I’m going to discuss the final conclusion – the sold out future ranking — up front.
In FY 2012, according to public finance data from the Census of Governments and personal income data from the U.S. Bureau of Economic Analysis, total state and local government debts equaled 21.2% of U.S. residents’ 2012 total personal income. The debt total was about $2.94 trillion. The annual interest on that debt equaled 0.9% of personal income, meaning U.S. residents paid $900 in state and local government taxes for each $1,000 their household earned just for interest, with no state and local government services in return.
If U.S. state and local governments had continued to spending as much on infrastructure construction investments from 1980 to 2012, as a percent of the income of U.S. residents each year, as was spent from 1977 to 1981, before a slowdown, they would have spent an additional $807 billion (adjusted for inflation in $2012) on infrastructure construction over 30 years. Than hidden “infrastructure debt” equaled 5.8% of the personal income of all U.S. residents in 2012. And while the level of capital construction investment in education buildings seems appropriate nationwide, some places have a deficit in that category too.
Financial advisors traditionally recommend that those about to retire accumulate enough in savings so that they can live off 4.0% of the initial asset accumulation in the first year, withdrawing a similar amount thereafter. Although in this low inflation, low interest rate, low return environment, some believe this is too high. I also believe, for reasons I will explain in my specific post on pensions later, that state and local government public employee pension funds should have AT LEAST enough in assets that annual pension benefit payments equal just 4.0% of those assets. Even though the actuaries, and city and state comptroller and legislators, that signed off on all the retroactive pension increases and pension underfunding in the past would probably deny this. Given the situation they have left us in, which I will show you, do you believe them or me?
Nationwide state and local government pension benefit payments equaled 4.3% of pension assets in the year 2000, close to the level I deem necessary, but only due to a stock market bubble that inflated pension assets. That bubble has since been re-inflated twice by the Federal Reserve’s zero interest rate policy. Even so, for FY 2012 state and local government pension benefit payments to have equaled just 4.0% of pension fund assets, those pension funds would have needed another $2.8 trillion. That shortage equaled 20.0% of U.S. residents’ total 2012 personal income, or about the same level of burden as the on-the-books state and local government debts. Unfunded retiree health insurance obligations from the past would be on top of that.
It seems that those pension actuaries, starting to fess up, are starting to report numbers similar to my back of the envelope calculation.
http://www.cbo.gov/sites/default/files/05-04-pensions.pdf
According to a 2011 report from the Congressional Budget Office its “estimate of unfunded liabilities is calculated on the basis of actuarial guidelines currently followed by state and local governments. Another approach for measuring pension assets and liabilities, which more fully accounts for the costs that pension obligations pose for taxpayers, yields a much larger estimate of unfunded liabilities for those plans in 2009—between $2 trillion and $3 trillion.” And going up.
Adding it up, on average today’s and tomorrow’s Americans have inherited a sold-out future due to past state and local government deals and non-decisions equal to 47.1% of their personal income in 2012. A mortgage at nearly half your income, my income, everyone’s income that will have to be carried indefinitely into the future, before any public services are provided, before any public benefits are paid, before taxpayers spend a nickel on their own needs. But that burden is more or less depending on where you live.
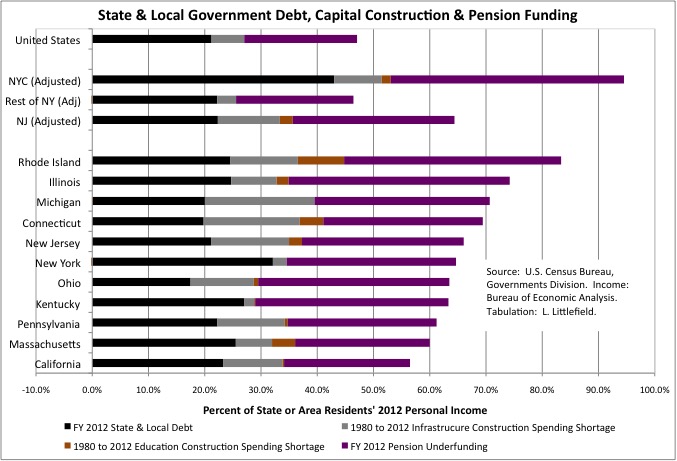
The worst off state in FY 2012, out of 50 states plus the District of Columbia (a rank of 51 in the “Sold Out Future Ranking” table), was Rhode Island, were debts, past capital construction shortages and pension underfunding totaled 83.4% of Rhode Island residents’ 2012 personal income.
If the New York City were a separate state, however, it would have been even worse off with a burden equal to 94.5% of city residents’ personal income. The rest of New York State, taken together would have been about average with a burden of 46.3% of personal income while New Jersey would have been fifth worst with a burden of 64.4% of that state’s residents’ personal income. Extensive adjustments were made to disentangle the debts, pension obligations, past capital construction investments and pensions of the Port Authority of New York and New Jersey, the Metropolitan Transportation Authority, SUNY and CUNY, and the State of New York and assign them to each place. New York State as a whole would have ranked fifth worst at 64.5% of state residents’ personal income, but the debts, pension underfunding and past infrastructure funding are concentrated in the city. Adding part of the Port Authority to New Jersey makes that state slightly better off, as the state has done relatively little infrastructure investment of its own since 1980.
Other states where older generations have most victimized those coming after include (in order from the worst) Illinois, with a burden of 74.2% of that state’s residents’ personal income in 2012, Michigan at 70.6%, Connecticut at 69.4%, New Ohio at 63.5%, Kentucky at 63.3%, Pennsylvania at 61.2%, Massachusetts at 60.0%, and California at 56.5%. While California makes the top ten most sold out states, it is only 20.0% worse off than the U.S. average, hardly a disaster compared with the other states on this list. Except, of course, that the U.S. average is itself a disaster.
A Tea Partier might note that most of these states are Democratic leaning, at least at the state and local government level, and are or were heavily unionized. As someone who has followed state and local government for most of the past 30 years, however, I can tell you that many of the deals to run up debts, disinvest in the infrastructure, underfund pensions and retroactively increased the were made, or at least signed off on, by Republican Governors and Mayors.
If the Republican goal has been to make government such a bad value and so unjust for the less well off and younger and future generations that even those with an egalitarian frame of mind give up on it, I can say that at least in my case they have made great progress. And evidently not just in my case. Because even though Republican politicians and interest groups are just as guilt, and at the federal level more guilty, of selling out the future, the resulting outrage at tax increases and cuts in public services has seen the Democrats run out of statehouses across the country.
So why did the Democratic Party, the party of government, go along with deals to cash in for the short term and destroy the future of state and local government in the long term? Because its special interests, notably public employee unions and contractors, are pigs with a tremendous sense of entitlement, little empathy for other workers, little capacity for long term enlightened self-interest and an enormous gift for deception and rationalization, and they couldn’t help themselves.
The most sold out states also have aging populations, which is to say a large share of their populations in the most affluent and entitled generations in U.S. history. Generations that voted more for themselves leaving less for those to follow. Although Wisconsin and Maine are aging as well, and the burden shifted to the future residents of those states is much closer to the middle of the pack.
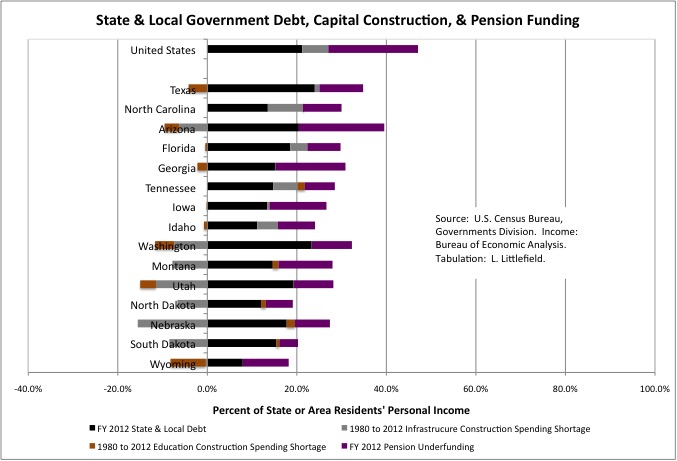
So what are the least sold out states like? Quite a few are large, empty small population states with a very good deal from the federal government. Back in the past, these states had less of a future they could sell at the time. The list, however, also includes some fast growing Sunbelt states – Texas, North Carolina, Arizona, Florida, Georgia, and Tennessee. States that are attracting people and businesses from states with sold out futures.
People may not understand why, but perhaps they sense that in these states the state and local government services and benefits they get seem to be a good deal compared with the state and local taxes they pay. Not because of efficiency, as they might claim. Not because, as in the past, the federal government is draining the Northeast and Midwest to subsidize them, because they are richer now and less subsidized. But because past residents’ and politicians robbed them less. In fact, many of the people and businesses leaving the states with the most sold out futures for the states with the least sold out futures are those who benefitted from that future selling in the past. Retired NY public employees moving away from the tax burden of their own pensions, for example. It’s like rats leaving the sinking ship they caused to rot before it goes down.
We can’t, however, be sure of that the fast growing states don’t have sold out futures until their pace of population growth slows, their number of retired public employees soars, and we find out if, in reality, enough money is being set aside to fund agreed pension benefits. California was once a fast growth state. In 1972, the pension benefits paid to former state and local government employees who were retired at the time equaled just 5.7% of the payroll of active public employees. There were few retired public employees from a past with fewer people, and more active public employees for a present with more people. Then population growth slowed, and the pension fund “matured.” In 2012 public employee pension benefits equaled 33.0% of the payroll of active employees. Those pensions had been retroactively increased, not enough money had been set aside, and a fiscal crisis followed. Though only the tenth worst among states, according to this analysis.
All these numbers ten to make people’s eyes glaze over, which is why past interest groups and politicians were able to get away with robbing the future. But what does all this mean?
It means that for the next few decades people will face an unending series of state and local government tax hikes, fee increases and benefit cuts, making them poorer individually, and public service cuts, making them worse off collectively. This diminished future has already started to arrive just about everyplace except those few places (such as New York City) where the asset price bubble created by the Federal Reserve’s zero interest policies has temporarily staved it off.
“Six years after the recession ended, many U.S. states are hard pressed to balance budgets because of a sluggish recovery and their own policy decisions” according to Bloomberg News. “The fiscal fragility raises questions about how they will weather the next economic downturn. A majority of states are making cuts, tapping reserves or facing shortfalls despite an improving national economy and stock markets at record levels, according to Standard & Poors and the Nelson A. Rockefeller Institute of Government. State revenue hasn’t rebounded to a prerecession peak adjusted for inflation, and other factors are putting pressure on budgets.”
“While revenue growth has been sluggish, states have had to spend more on things such as Medicaid… Mounting pension shortfalls are also squeezing states including Illinois, New Jersey and Pennsylvania…The situation has become so bleak in some states that even Republican governors loath to raise taxes have proposed higher levies.”
This is a boom? So you are a right winger and don’t like taxes in exchange for public services? Good news. You will have higher taxes without those public services. What if you live in a high tax state and want public services?
“The Chicago Public Schools will ‘run out of cash as early as this summer’ and be unable to meet payroll, pension and debt payments without ‘third-party intervention’ or a significant ‘cost deferral,’ according to a new consultant’s report commissioned by the school system” and cited by the Chicago Sun-Times. Draconian tax increases and school cuts are being discussed. “If both tax increases were imposed for the maximum recommended $450 million, it would cost the owner of a Chicago home valued at $250,000 roughly $450 more a year in property taxes. Budget cuts now being considered run the gamut from a delayed opening of the coming school year to increases in class size to the elimination of sports, art, music and after-school programming.” But that would still leave the Chicago schools $billions in the red.
These are not isolated cases. In many places similar draconian measures would be happening right now, except that elected officials would rather make the future even worse by postponing them. New Jersey for example.
What Illinois and Chicago will be facing over the next couple of years – and every year thereafter – will be hitting New York, New Jersey and Connecticut sooner rather than later. Tax increases. Fee increases. No help for the needy, who will face deprivation. No investment in the future, which will thus be even worse.
As I noted in this post,
https://larrylittlefield.wordpress.com/2015/04/14/taxes-2012-census-of-governments-finance-data/
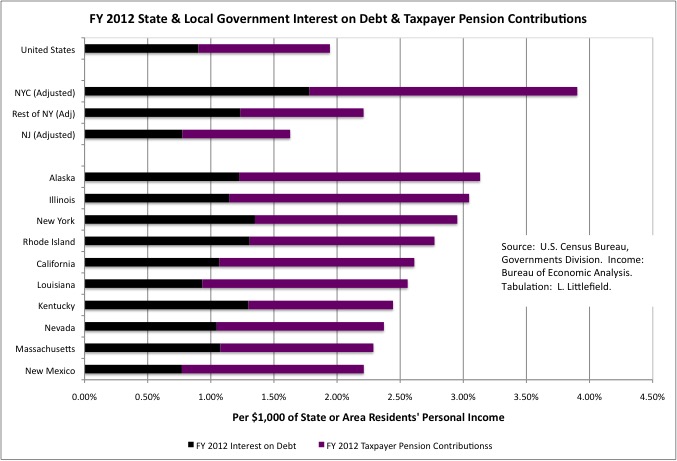
in FY 2012 U.S. state and local government taxes equaled about 10.0% of U.S. residents’ personal income. About the same level as has been the case for many years. Taxpayer contributions to public employee pension funds and interest on state and local debts equaled 1.94% of personal income, or nearly one dollar in five, far more than before. Spending on retiree health insurance, not tabulated separately by the Census Bureau, was on top of that. For today’s taxpayers and tomorrow’s most of that is money for nothing, money sucked into the past by the life draining vampires of past deals and favors, and it is worse than that in many places.
Worst of all? For New York City, the cost of interest on state and local government debts and taxpayer pension contributions in FY 2012 equaled 3.9% of city residents’ personal income, which would be highest if the city were a separate state. At the national average state and local government tax burden, nearly four tax dollars in ten would be sucked into the past here. But of course the NYC’s state and local tax burden is much higher than the national average.
Alaska is the worst off individual state by that measure, with 3.13% of its residents’ personal income sucked into the past, but most of that state’s tax revenues come from mineral extraction taxes, not from residents or other businesses. At least for now.
Other states high on the list include Illinois (3.05%), Rhode Island (2.77%), California (2.71%), Louisiana (2.56%), Kentucky (2.44%), New Hampshire (2.37%), Massachusetts (2.29%), and New Mexico (2.21%). Not high on the list of states were people were paying for the past in FY 2012, despite being deep in the hole, and New Jersey and Connecticut. Because they were refusing to pay. But the walls are closing in. In New Jersey
http://www.bloomberg.com/news/articles/2015-06-09/christie-wins-n-j-pension-court-battle-punts-funding-crisis-iapegdvt
Governor Chris Christie won a battle when the states highest court reaffirmed that today’s taxpayers, like yesterday, don’t have to put money into the public employee pension funds even as those funds collapse toward insolvency. But tomorrow’s taxpayers will have to pay full pension benefits even with no money left in the pension fund, even that would in effect destroy the state.
“Public workers continue to pay into a system on its way to insolvency,” Bloomberg News reported. “The issue is dire for New Jersey as the retirement burden grows, casting a shadow on the state budget and driving down its credit rating, which has already been cut a record nine times.”
In Connecticut, the state tried raising taxes to make full pension payments, but the large corporations that fled declining New York City for the exclusive affluent suburbs in the 1970s are now threatening to leave that state in turn. The state backed off the tax increases.
http://www.bloomberg.com/news/articles/2015-06-23/connecticut-caving-to-ge-over-tax-boost-magnifies-budget-stress
Noted Bloomberg News: “Investors are punishing Connecticut, driving the yield spread on its debt to the highest in at least 2 1/2 years, as the tax backlash makes it harder for officials to maintain services while also committing money to bolster the third-worst-funded U.S. state pension system.” A government spokesperson said said “Connecticut is repaying pension obligations built up over decades.” “Investors think of the Connecticut from ‘a generation ago when taxes were lower and the state’s infrastructure was viewed as comparatively well-maintained,’” according to a financial analyst. “Connecticut is among the more fiscally challenged states right now.”
Some of the states with sold out futures have a relatively low state and local tax burden, and can raise taxes to try to cover their growing fiscal catastrophe. But what is New York City, with the highest state and local tax burden as a percent of its residents’ personal income (oil extraction and other mineral taxes aside) supposed to do when the latest bubble deflates and the sold out future finally arrives? NYC’s tax burden was already 15.7% of personal income in FY 2012, half again as much as the U.S. average of 10.0%. That compared with 13.2% for the rest of New York State, 11.1% in New Jersey, 9.8% in “Taxachusetts,” 10.2% in California and 11.2% in Illinois.
Faced with a fiscal disaster, New York and New Jersey politicians such as Bill DeBlaiso, Andrew Cuomo, and Chris Christie have simply refused to face it. The infrastructure remains unfunded. New Jersey continues to refuse to fund its employee pensions. New York State is deferring some of taxpayer pension costs, New York City is lying about its costs, and additional pension increases are being proposed. But you see the same denial almost elsewhere. If anyone is being made to sacrifice, it is generally younger and future citizens and future public employees. Not those who grabbed the most in the past.
The data in the spreadsheet linked above is what those interests, what the politicians, what those who had the party and left the bill don’t want talked about, thought about, faced up to. They want a previously apathetic but increasingly outraged public to be confused about what has been done to them by whom, while they weren’t paying attention, and nothing helps create that confusion more than separating in time the heists from the pain by selling out the future. A sold out future, however, is what we have, and what our children and grandchildren will inherit. And unless we face that fact, the heist will continue and the future will be even bleaker.
The next two posts will review state and local debts and past capital construction expenditures, and public employee pensions, in more detail. But you don’t have to wait for me to write 16 more pages. Every table and chart I will use in those posts is in the spreadsheet linked above.