
Local Area Personal income data has been released for 2014, and I’ve downloaded it to see if some of the trends I’ve observed in the past have continued. While there are many positive trends for New York City, it isn’t all good news. In Downstate New York, the mean earnings (including non-wage benefits) of private sector workers outside the high-paid Finance and Insurance sector fell 1.4% from 2001 to 2014 when adjusted for inflation. Which is actually better than I would have expected, and better than in many parts of the U.S. The mean earnings of those in the Finance and Insurance sector, while still sky high, fell 13.6%. But the mean earnings of those employed in state and local government increased 17.6%. No wonder the serfs can afford fewer of them, with larger class sizes and more crowded subway trains among the results.focuz.ru
Some charts with this and other data follow.
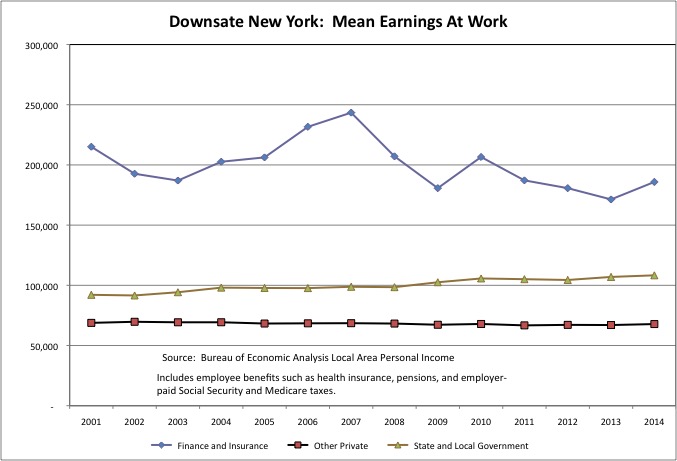
This chart shows that the extremely high mean earnings per worker in Downstate New York’s financial sector is highly volatile, but the general trend is down from the peaks of the two bubbles in 2000 and 2007. Meanwhile, the trend in mean earnings for state and local government workers is up as unions representing those workers, or at least those retired and about to retire among them, control state and local government in New York. And with the wealthy and the one percent squeezing them, the earnings trend for other workers is flat.
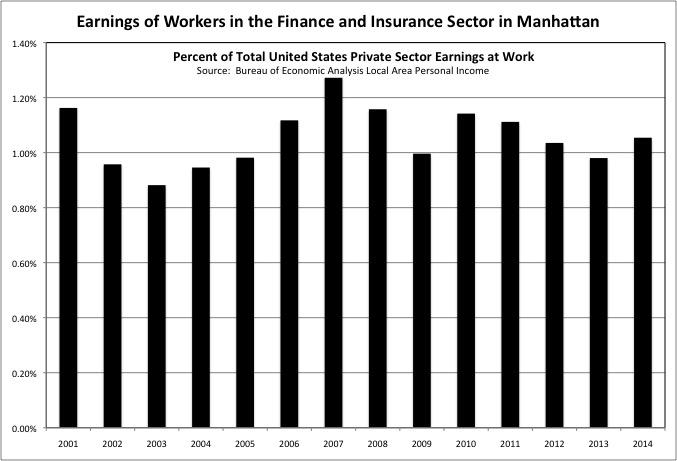
New York City and New York State are dependent on the excess money thrown off by Wall Street, to avoid making the combination of state and local taxes paid, and state and local government services and benefits received, even worse for ordinary and younger New Yorkers than it already is. Finance and Insurance sector workers in Manhattan, however, are still taking more than 1.0% of all the private sector earnings at work in the entire United States, a level of compensation that is far higher than in prior decades, and not sustainable. Sooner or later, the bill for everyone else is going to come due. And it is going to be high, because state and local government elected officials keep deferring large parts of it.
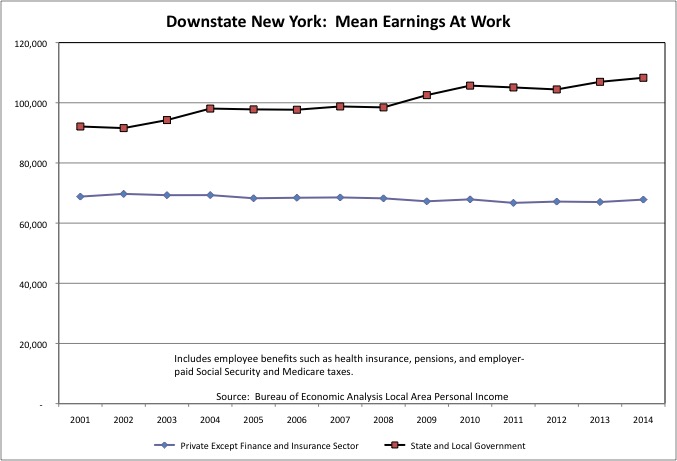
Without the high-paid finance sector skewing the scale, one can compare other private sector workers and state and local government workers in Downstate New York more easily. In 2014, the mean earnings per worker for rest of the private sector, including both wages and salaries and benefits, was $67,821 in Downstate New York. This includes all the highest paid people in sectors outside of finance, such as law, information technology, medicine, the media, etc. For state and local government workers, it was $108,308. The gap is widening as more and more private sector workers are turned into “freelancers” or “contract workers” without benefits. And all the retroactive pension increases for New York’s public employees, passed by the New York State legislature through the 1990s and 2000s, are finally paid for.
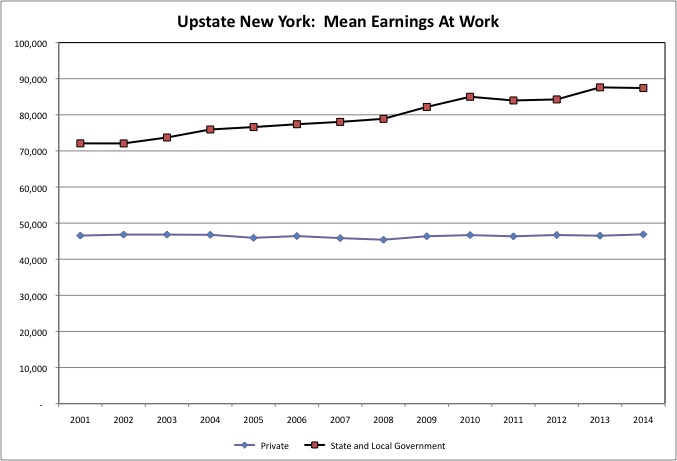
The gap is even greater in Upstate New York, where the mean earnings per worker for private sector workers was just $46,885 in 2014, up 0.7% (adjusted for inflation) from 2001. And the mean for state and local government workers was $87,412, up 21.3%.
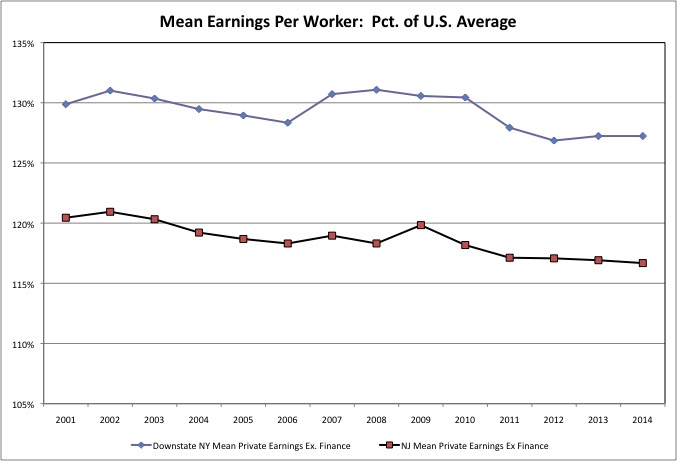
When tabulating public finance data – per student school spending or mean payroll per public employee by category for example – I always adjust the Census Bureau’s figures for NYC, elsewhere in Downstate NY, and New Jersey downward for comparison with the U.S. average. The reason is that the Northeast Corridor is a high-wage, high cost of living area in general, so public employees have to be paid more as well to have a comparable standard of living. The adjustment is based on local mean earnings for the private sector excluding the overpaid Finance and Insurance sector, relative to the U.S. average.
Recently I had noted that the gap between average private sector earnings in Downstate New York and the U.S. – and thus the adjustment – had been shrinking. That seems to have reversed from 2012 to 2014. The mean private sector earnings per worker was 27.2% higher in Downstate NY than the U.S. average in 2014, up from 26.9% in 2001. For those working in New Jersey, on the other hand, mean private sector earnings were 16.7% higher than the U.S. average in 2014, down from 17.1% in 2012.
The charts above all require data by sector and industry, which is only readily available starting in 2001 because of a change in the industry classification system. Other BEA data is readily available back to 1969.
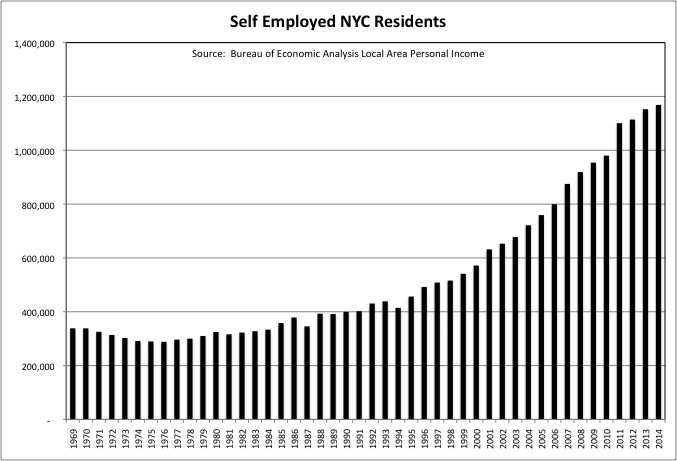
The data shows that the increase in self employment in New York City continues, but it has slowed down compared with the huge leaps through 2010. Perhaps NYC some “freelance” workers are turning back to employees as the unemployment rate drops, and businesses start to worry about having workers available when they need them.
Self-employment soared in New York City for two reasons.
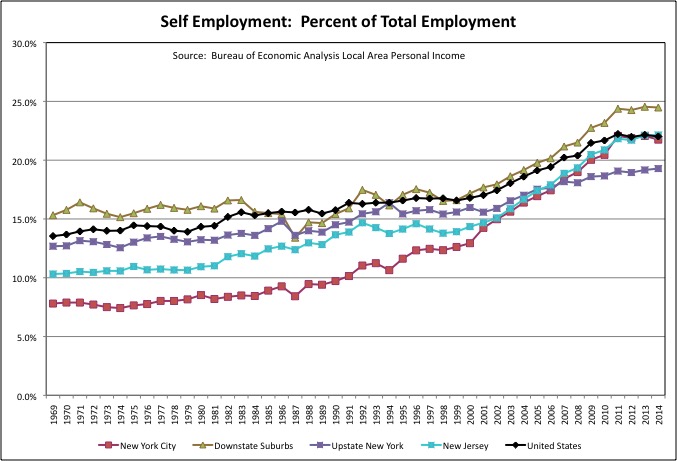
First, the share of workers who are self employed has been rising in the U.S. as a whole, with particularly large increases starting in the late 1990s. Just 16.6% of all U.S. workers were self-employed in 1999, but that increased to 22.0% in 2014.
Second, employment in New York City (and New Jersey) had, in the past, been dominated by big organizations: corporations, non-profits and government agencies. Self-employment was unusually low. But after a recent surge the percent of those working in NYC and New Jersey that are self-employed has caught up to the U.S average. In 1969, just 7.8% of those working in NYC and 10.3% of those working in NJ were self-employed, compared with 13.5% for the U.S. In 2014 the percentage was 21.7% for NYC, 22.1% for NJ, and 22.0% for the U.S. The Downstate Suburbs have always been above average in self-employment, while Upstate NY continues to lag.
One might say that the self-employed are the “risk takers” who have no guaranteed income and need to seek their income in the marketplace every day. The mythology is that the “risk takers” are those at the top, who are being rewarded for their daring and skill. At one time that might have been the case in NYC, when most Wall Street firms, accounting firms, law firms were partnerships, and there were many large organizations run by entrepreneurs. Today, however, many of these organizations are corporations owned by shareholders, and those who sit on their boards vote each other more and more money, guaranteed, regardless of what happens those shareholders. And, of course, NYC government workers have also gotten more and more, not in cash everyone can see, but it retirement, health insurance, etc.
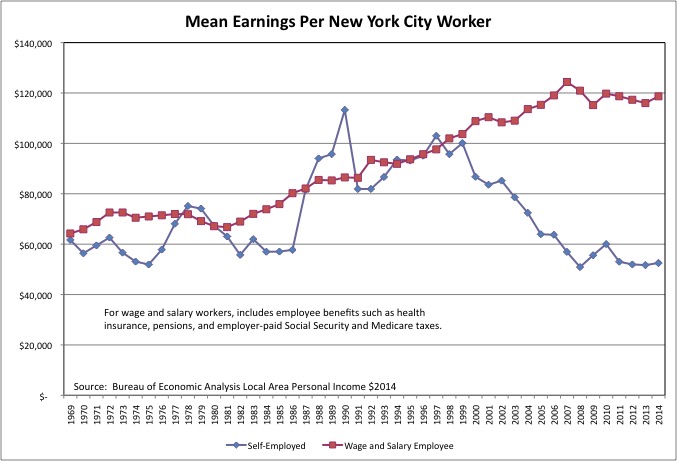
Meanwhile the mean earnings per self-employed worker has in concert with the trend of more and more people ending up self-employed. Self-employed or unpaid “interns.” While this trend was pioneered in places such as NYC and Los Angeles, these days in places such as South Carolina they hiring manufacturing assembly line workers as self-employed “freelancers,” from what I read in the business press. It is those at the bottom who are, in fact, the risk takers, hustling for a buck, paid only when working, and having to justify what they are paid each and every day.
In 2014 the mean earnings at work for wage and salary workers working in NYC, including employer-funded non-wage benefits, was $118,675. That was up 9.1% from the year 2000, adjusted for inflation. For self-employed people working in New York City the mean was far less than half at $52,518 in self-employment earnings, down 39.5% from the year to 2000 after adjusted for inflation. The self-employed, of course, don’t have any employer-funded benefits and have to pay both halves of the payroll tax themselves.
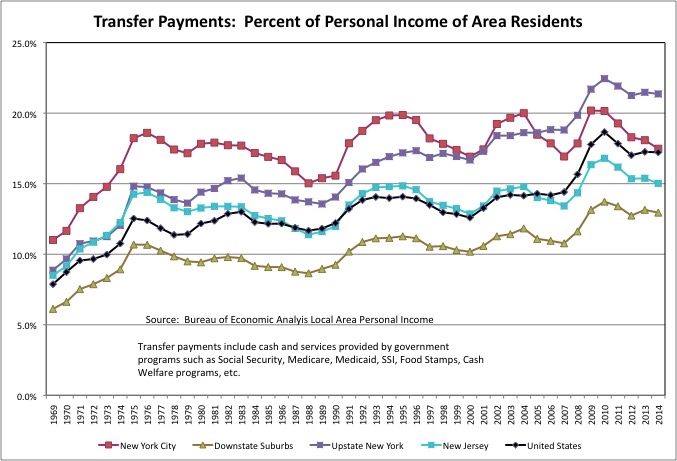
New York City was once known as America’s “welfare” capital. In the 1970s, after middle class workers fled to the suburbs leaving the old, the poor, the sick and the troubled behind, the share of NYC residents’ personal income that came from what the BEA classifies as “transfer payments” was unusually high. “Transfer payments” include money from programs such as Social Security, SSI, Medicare, Medicaid, Food Stamps, Section 8 housing, AFDC/TANF, and other types of income other than work earnings and dividends, interest and rent. In 1976, income from transfer payments accounted for 18.6% of the personal income of all NYC residents, compared with just 12.4% for the U.S., 10.7% for the Downstate Suburbs, 14.4% for New Jersey and 14.8% for Upstate New York.
With the suburbs and Upstate New York now aging, other parts of the country getting poorer in the wake of the Great Recession, and NYC getting an influx of young workers and taxpayers who get little from the government (and given trends in public policy probably always will), things have changed. As of 2014, transfer payments were down slightly to 17.5% of the personal income of NYC residents, barely higher than the 17.2% U.S. average. Based on the trend NYC may be below the U.S. average in 2015. In Upstate NY, meanwhile, the percent of area residents’ personal income has soared to 21.4%, more than the most it had ever been in NYC — even when the city had 1 million people on welfare. The Downstate Suburbs and New Jersey were still lower than NYC at 12.9% and 15.0%, but are somewhat higher than they had been in 1976.
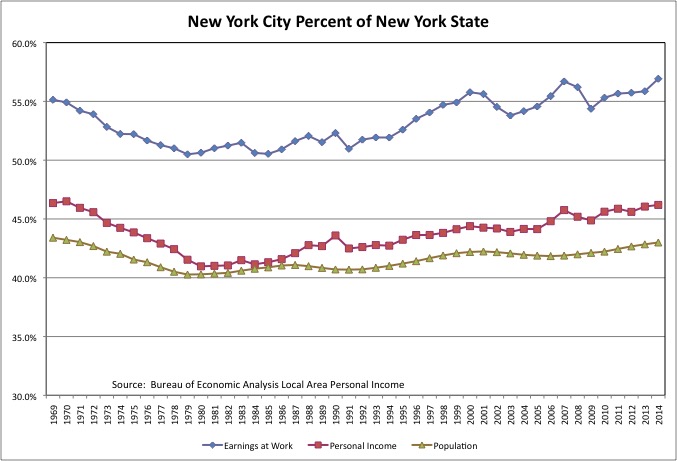
Thanks to aging and economic decline Upstate, and the influx of immigrants and young college graduates into NYC, the city’s share of New York State’s population, personal income (of those living in the area) and work earnings (of those working in the area) has increased after plunging through the 1970s.
NYC’s share of the state’s population was 43.4% in 1969, hit bottom at 40.3% in 1979 and 1980, but has since increased to 43.0% in 2014. NYC residents’ share of the state’s personal income was 46.4% in 1969, hit bottom at 41.0% from 1980 to 1982, and then increased to 46.2% in 2014. And with regard to work earnings by place of work, NYC was responsible for 55.1% of the state total in 1969, reached a low of 50.5% in 1985, but has since rebounded to 56.9%.
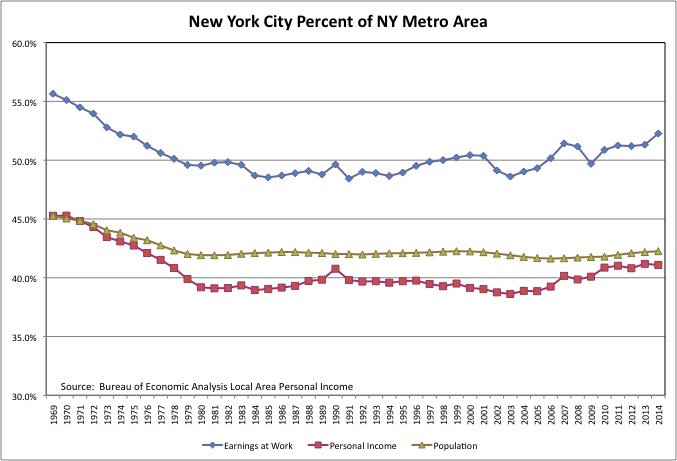
New York City’s share of the Downstate Metro Area, however, shows another pattern. With a plunge during the 1970s as the suburbs prospered by attracting jobs, middle class families and money out of the city while excluding the needy. But a leveling off afterward, rather than a significant increase in the NYC’s share. It would seem that while NYC is once again the locomotive of the metro area, the city and suburbs are experiencing ups and downs together.
Although one must remember that the richest generations in U.S. history, on average, are those that left the city for the suburbs, those born 1930 to 1956 or so. They are still there, bringing up the average income in the suburbs. It remains to be seen what will happen when they are gone.
How much is NYC the locomotive? Excluding the Health Care and Social Assistance sector, which is mostly government-financed, New York City accounted for 55.1% of all the private sector earnings at work in metro NYC in 2014, up from 51.9% in 2001. Manhattan alone accounted for 45.2% of metro area private sector earnings at work in 2014, the Health Care and Social Services sector excluded, up from 43.1% in 2001.
The importance to the New York State tax base of Manhattan, the area whose economic vitality depends on mass transit, is even starker. With the government-funded Health Care and Social Assistance sector excluded, NYC accounted for 62.5% of the state’s private earnings at work in 2014 (up from 59.7% in 2001), and Manhattan alone accounted for 51.3% (up from 49.5%). Add on the work earnings in the Downstate Suburbs supported by consumer spending by those who commute to NYC, and the work earnings in Upstate NYC supported by consumer spending by public employee salaries paid for by taxes collected in Downstate NY, and you probably have 80 percent of New York State’s economy.
One last piece of good news. Per capita income, adjusted for inflation, was up from 2000, the peak of a couple of bubbles ago, to 2014, the most recent year available. This measure of income includes transfer payments and non-wage benefits, not just cash pay. While the increase was just 9.5% for the U.S. as a whole, it was 16.9% for New York City, 10.2% for the Downstate Suburbs, 13.6% for Upstate NY. New Jersey trailed at just 7.0%.
Given the other data, however, it seems likely that older generations, the retired and soon to retire, and the one-percenters, probably captured most of the gains. Even so, the fact that the mean work earnings of Downstate NY private sector workers outside the Finance and Insurance sector only fell 1.7% from 2001 to 2014 (probably by more from 2000) is perhaps the most pleasant news in the whole dataset.