
After years of soaring ridership, the NYC subway has reached the level of patronage that it had immediately after WWII, before the onset of mass automobile ownership. According to the MTA…
http://web.mta.info/nyct/facts/ffsubway.htm
in 2014 annual subway ridership was at the highest level since 1948, at 1.75 billion rides. At first rising ridership was an unmitigated benefit. Through the 1960s and 1970s, as the subway deteriorated, people only used it when they had to – to travel to and from work in Manhattan in the AM and PM peak. As annual ridership fell below 1 billion the system ran mostly empty the rest of the time, a cost without revenue – and a security risk for those still on the trains. As new people started moving to New York City precisely because they wanted to be able to use mass transit and walk to things rather than drive, however, off peak ridership recovered, filling the once empty trains and allowing the system to carry more people without more service.
In the past year or two, however, the system has hit the wall. Suddenly it has become severely overcrowded, causing increasing discomfort, delay and unreliability. Personally I find riding the subway to be a worse experience than it has been since the 1980s, when track fires, track failures, and trains out of service were common, doors kept breaking, and lights flickered on and off. For more than a year, therefore, I’ve been searching for evidence of what the level of subway service used to be, back when ridership was last this high. And now I may have found it, and can show that the subway system is squeezing more riders into fewer trains and subway cars. Subway riders, it seems, have it worse than 60 years ago.
The foundation of this post is a link, posted on a NYC transit blog, to this map showing AM peak subway service and capacity in 1954.
http://transitmaps.tumblr.com/image/55177865550
The truth is that I have no idea where this map comes from. But I have seen a number of planning maps from the same era, and based on the colors and font it certainly appears authentic. Certain system details about the way the system was structured that year, shown correctly on the map, also support its authenticity. Moreover, call it affirmation bias but the map shows what I would have thought to have been true, based on what I have read and researched and discussed with subway history buffs over the years. Finally it appears someone paid good money for the original.
http://www.wardmaps.com/viewasset.php?aid=16252
While the map shows the level of service throughout the system, I am particularly interested in the level of service entering the Manhattan CBD – crossing 60th Street or the East River. That is because a contemporary data source, the New York Metropolitan Transportation Council’s (NYMYC) annual Hub Bound dataset, is available for comparison.
http://www.nymtc.org/files/hub_bound/DM_TDS_Hub_Bound_Travel_2014.pdf
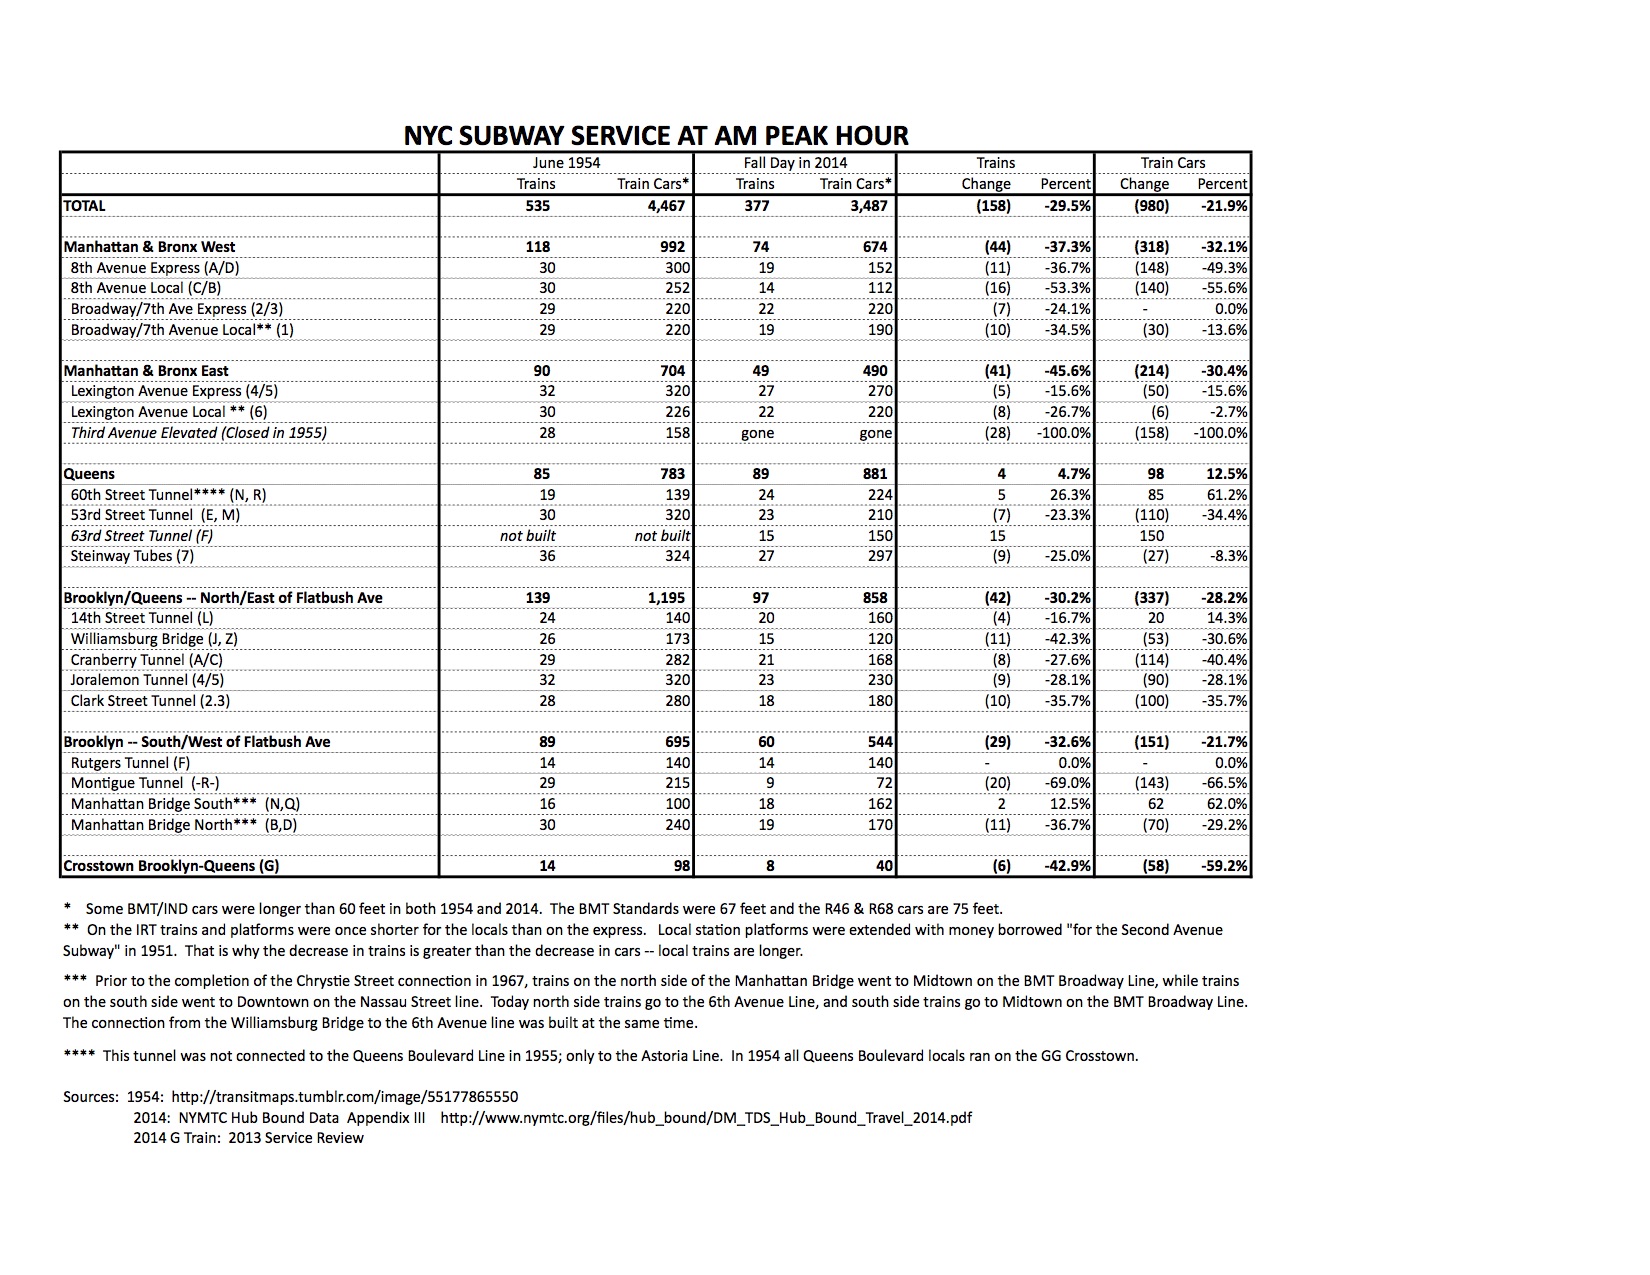
Based on these two data sources, and a third source for the current level of service on the Crosstown (G) line, I find that the NYC subway was running 158 fewer trains with 980 fewer subway cars at the AM peak hour in 2014 than it had been in 1954 – despite higher ridership. That is a decrease of 29.5% for the number of trains, and 21.5% for the number of cars.
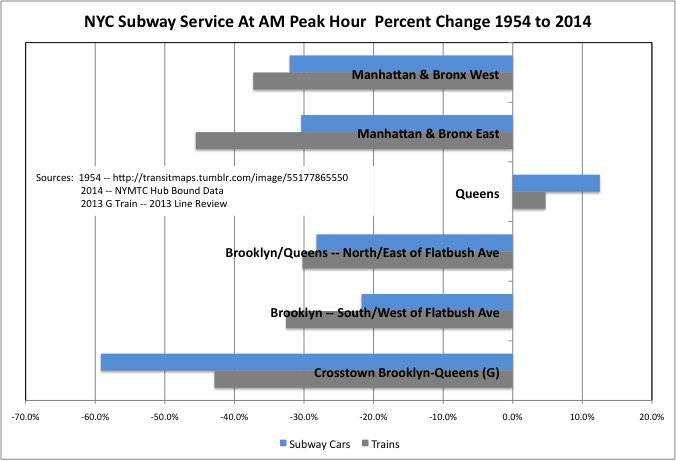
While I don’t have a figure for 1954 ridership handy, I do have one for 1955 ridership. It was 1.38 billion, or 21.3% fewer (373 million) than in 2014. So in 2014 the subway was squeezing 21.3% more riders into 21.5% fewer AM peak subway cars than it had 60 years ago. More people worked overnight in 1954, which was probably close to the high point for industrial employment in NYC, so the share of total ridership on the subway in the AM peak hour was probably at least as high in 2014 as it had been in 1954. And today’s service is likely lower across the board, not just during the AM peak hour, although I don’t have the data to prove this. The number of riders, moreover, is likely to be higher in 2015 than it had been in 2014. It is on the way to the peak level of more than 2 billion annual passengers recorded in 1930 and again at the height of World War II.
Finally, while today some of the IND/BMT cars are now 75 feet long rather than 60, meaning only eight rather than ten are needed for a 600 foot long train, back in 1954 most of the BMT cars were 67 feet long, with only nine for a 600 foot long train. The length of the IRT cars is unchanged at 51 feet.
A spreadsheet with the data may be downloaded here.
Subway Service at AM Peak Hour
Let’s examine the table to see where service has been reduced.
Manhattan and Bronx East
The obvious place to look is the place where the trains are the most crowded, the East Side of Manhattan. In 1954 28 trains on the Third Avenue El carried 158 cars into the CBD; in 1955 service on this line was eliminated and it was torn down.
A bond had been issued in 1951 to build the Second Avenue Subway, but the money was diverted to begin rebuilding the existing transit system. It is as if Governor Cuomo were to tear down the existing Tappan Zee Bridge before building a new one, and divert the money borrowed for the new bridge to roads elsewhere in the state, claiming the former Tappan Zee Bridge drivers could just use the George Washington and Bear Mountain bridges instead, since miles driven has been falling nationwide.
In 1954 the Third Avenue Elevated had its limitations. It was so lightly built that steel subway cars were too heavy to ride on it, and even the former El “Q” cars that had been rebuilt for use on the subway could only use the middle express track. The old El cars were mostly made of wood. I gained an understanding what the old Els might have been like when I saw the structure of the Chicago elevated, which has much smaller and thinner steel beams than the elevated structures of the New York City subway. And yet the Chicago Els are still in use, with shorter trains of much lighter train cars than the NYC subway, trains that move much faster. And the BMT had experimented with lighter aluminum cars for use on both the subway and elevated lines, before the City of New York bought it out in 1940. See the experimental fleet here.
http://www.nycsubway.org/wiki/The_BMT_Fleet_(Elevated,_Subway,_Experimental)
Since the demolition of the Third Avenue Elevated, the Lexington Avenue local and express have been the only lines rapid transit lines on the East Side of Manhattan. Even so the Lex express (#4, #5) had five fewer 10-car trains during the AM peak hour in 2014 than it had in 1954, for a decrease of 50 subway cars (15.6%). Although the number of local trains (#6) fell by 26.7% (8), however, the number of local subway cars only fell by 2.7% (6).
The reason is that the original IRT line was built with half-length platforms, on the assumption that shorter trains would be sufficient for local service. This was remedied by the IRT reconstruction effort of the 1950s. In general the former IRT and BMT lines ran more frequent, shorter trains in 1954 than in 2014. That is why the number of trains has fallen by more than the number of subway cars, with wait times increased somewhat more than crowding.
All told the number of East Side trains entering the CBD was 45.6% lower (41) in 2014 than it had been in 1954, with the number of subway cars down by 30.4%.
Manhattan and Bronx West
By 1954 the West Side elevated line, the 9th Avenue elevated, had already been gone since the city bought out the IRT and BMT in 1940. And since the IND had already finished building its west side subway, which today carries the A, B, C and D routes, there have been no reductions in the West Side subway infrastructure since 1954. Even so, subway service on the West Side had been cut by as much as service on the East Side.
Most of that cut is on the IND. Back in 1954 the west side IRT was the oldest line in the system, was in disrepair, and was under reconstruction. The IND was shiny and new in comparison, attracted riders away from the IRT, and was run flat out at 30 trains per hour per track. Today, however, service on the local track is down to 14 trains and, thanks to the short C-line trainsets, just 112 cars. The number of trains is down by more than half (16), and the number of subway cars is down 55.6% (140). The number of express trains, meanwhile, is down 36.7% (11), and the number of subway cars is down 49.3% (148). The IND was originally built to accommodate 11-car, 660-foot long trains but no such trains run today, in part because the IND is connected to the BMT and in part because rooms have been built in the excess platform space.
Thanks to longer platforms, in contrast, the service cuts on the West Side IRT are less severe. On the express track (2/3), the same number of subway cars entered the CBD during the AM peak hour in 2014 as in 1954, despite seven fewer trains. Something that must have been made possible by making the platforms at 145th Street (#3 line) longer. On the local track (#1) the number of trains is 34.5% (10) lower than 60 years ago, but the number of subway cars is just 13.6% lower.
Back in 1954, both local and express service ran on both upper branches of the line – the one now served by the #1 local train, and the one served by the #2 and #3 express. But this required trains to cross in front of each other, slowing service. When the IRT was reconstructed in the mid-1950s, the City of New York could have built a modern “flying junction” to allow this pattern of service to continue more efficiently. But instead it went cheap and just made all trains coming from upper Broadway local trains. That, and longer waits, have increased travel times along the route.
Overall, the number of subway trains crossing 60th Street on the West Side in the AM peak hour was 37.3% lower (44) in 2014 than it had been in 1954. The number of subway cars was 32.1% lower (318).
Brooklyn/Queens North/East of Flatbush Avenue
Perhaps nowhere else on the subway has ridership boomed as much as in the portions of Brooklyn north and east of Flatbush Avenue, the oldest area of the borough and the area once served by the “Eastern Division” of the BMT along with Brooklyn’s IRT line. There, where many residents once worked in local factories, and later were on public assistance after the factories closed, new and existing housing is filling with subway riders. Even so the number of AM peak trains from this area to Manhattan was 30.2% (42) lower in 2014 than it had been in 1954. The number of subway cars crossing the river was down 28.2% (337).
Once again the biggest reduction in service is on the IND, where the number of Fulton Street subway line trains (A, C) passing through he Cranberry Street tunnel during the AM peak hour was 27.6% (8) lower in 2014 than it had been in 1954, and the number of subway cars was 40.4% lower (114). In 1954, moreover, the IND ended at Euclid Avenue rather than extending to Lefferts Boulevard and the Rockaways. Thus in 2014 riders from 20 additional subway stations in Ozone Park, Howard Beach and the Rockways were on the 40.4% fewer subway cars.
In 1954 the section of track now serviced by the A train to Lefferts was what remained of the Fulton Street elevated, with its trains continuing to Manhattan on the Jamaica line. The Jamaica line and Myrtle Avenue lines (J, M, Z) also carried far less service over the Williamsburg Bridge at AM peak in 2014 than they had in 1954, with 42.3% (11) fewer trains and 30.6% (53) fewer subway cars. In 1954 more frequent service, and more express service, was a benefit to those living in the outer reaches of the line, in Woodhaven and Richmond Hill, who have one of the longest rides to Manhattan in the subway system.
There is, however, one improvement in service on this line. With far less employment in Lower Manhattan, and far more in Midtown, today compared with 1954, riders on this line benefit from having the option to take the M direct to Midtown along 6th Avenue. That route was planned for when the Chrystie Street connection was built in 1967, but not implemented until recently. The transfer from the Jamaica line to the F at Delancey Street was also improved by a recent station reconstruction. Prior to these improvements most Jamaica line passengers had to change at Canal Street for service to Midtown.
Aside from air conditioning in summer, there is no service improvement on Brooklyn’s IRT. Just less service. The express tracks (#4, #5), connecting to Manhattan via the Joralemon Street tunnel, carried 28.1% (9) fewer AM peak hour trains with 28.1% (90) fewer peak hour subway cars in 2014 than in 1954. Service on the local track (#2, #3) via the Clark Street tunnel was down 35.7% for both trains (-10) and subway cars (-100).
At Rogers Junction, east of Franklin Avenue, the MTA cheaped out when rebuilding the interlocking, which is not a full flying junction. This, the MTA says, is the bottleneck that prevents additional IRT service in Brooklyn. Even so the City of New York ran 60 trains through that interlocking in the AM peak hour in 1954, compared with just 44 packed trains today. Service on that line wasn’t comfortable even back then. My wife’s grandmother, who lived in Flatbush at the time, told me she used to take it two stops away from Manhattan in the morning to get a seat, because it became so packed by the time it reached Atlantic Avenue.
Finally, the line with the most massive ridership growth, the Canarsie Line (L), had four fewer AM peak trains in 2014 than it had in 1954, a reduction of 16.7%. More cars are running on the line, but only because 60-foot long cars are being used today rather than the 67-foot BMT Standards that were used in 1954. The trains were and are 480 feet long. Back in 1954, moreover, most of the trains only went to and from Myrtle Avenue, relaying on the center pocket track there. Trains all the way from Canarsie went express from Myrtle Avenue by skipping stops.
Brooklyn South/West of Flatbush Avenue
This is the area of Brooklyn once served by the old BMT Southern Division. It is an area that suffered severely degraded transit service severely degraded transit service for 20-plus years from 1980 to 2001 as a result of the deterioration of the Manhattan Bridge, and the resulting closure of two of its four subway tracks. Despite this restoration, 32.6% fewer trains (29) with 21.7% fewer subway cars (151) crossed into Manhattan from this area in the AM Peak hour in 2014 than had done so in 1954, sixty years earlier.
The tracks on the north side of the Manhattan Bridge (B, D) carried 36.7% fewer (11) peak hour trains with 29.2% fewer subway cars (70) in 2014 than in 1954. In part that is because the routes now identified as the D, N and Q all used this side of the bridge in 1954, running up the BMT Broadway line to Midtown.
In 1954 the south-side tracks on the bridge turned south to lower Manhattan rather than running to Midtown, and carried two fewer trains with 62.0% (62) fewer subway cars than in 2014, when it was used by N and Q trains to Midtown.
Adding it up, the Manhattan Bridge carried about the same amount of service in 2014 as it had in 1954, but with all the trains heading to Midtown. Since the number of jobs in Lower Manhattan is smaller, and the number of jobs in Midtown is larger, today than in 1954, this could be considered a service improvement – one made possible by the construction of the Chrystie Street connection in 1967.
The number of trains and subway cars traveling from this area to Lower Manhattan via the Montague Street tunnel, however, has plunged. Where once two or three routes used the tunnel, today only the R train does, and with just 9 AM peak trains with 72 subway cars. That is down from 29 trains with 215 subway cars back in 1954. The most recent cutback came in the last recession, when the M train was routed to Midtown on the 6th Avenue line rather than heading south to Brooklyn. The low level of service via the Montague tunnel may induce more riders on the B, D, N and Q lines with destinations in Lower Manhattan to transfer instead to the IRT at Atlantic Avenue, overcrowding Brooklyn’s 2, 3, 4 and 5 trains even more.
Finally, the Rutgers Tunnel (F) carried the same number of AM peak trains with the same number of subway cars to Manhattan in 2014 as in 1954. In 1954, however, IND service on this line ended at Church Avenue. The Culver line, with its 11 additional stations extending to Coney Island, was connected instead to the 4th Avenue line and traveled to Lower Manhattan over the Manhattan Bridge. So even though the service is the same as 60 years ago on this line, the trains are far more crowded.
Queens
This is the only area where subway service was higher at the AM peak hour in 2014 than it had been in 1954. The number of trains crossing the East River from Queens was greater by four (4.7%) and the number of subway cars was greater by 98 (12.5%). On the other hand, the population of Queens was 43.8% higher in 2010 than it had been in 1950, for an increase of nearly 680,000 people.
The Flushing Line (#7) had the same configuration in 2014 that it had in 1954, but during the AM peak hour it carried 25.0% fewer trains (9) with 8.3% fewer subway cars (27). The completion of the CBTC signal project will theoretically allow more peak hour trains, perhaps as many as 40 compared with 36 in 1954 and 27 today. Whether more trains will actually run, however, remains to be seen.
In 1954 the Queens Boulevard line was connected to Manhattan by only one tunnel, the 53rd Street tunnel, which today carries the E and M trains. In 1955 the Queens Boulevard Line was connected to the 60th Street tunnel, which then as now is also connected to the Astoria line. That tunnel, now carrying the N trains on the Astoria line and R trains on the Queens Boulevard line, had five more trains carrying 61.2% more subway cars (85) in 2014 than it had in 1954. In 2001 the 63rd Street tunnel, previously the tunnel to nowhere, was also connected to the Queens Boulevard line. That tunnel carries 15 trains with 150 subway cars to Manhattan in the AM peak hour.
Some of these trains and subway cars were merely diverted from the 53rd Street tunnel, which had seven fewer AM Peak hour trains with 34.4% (110) fewer subway cars in 2014 than it had in 1954. Still, Queens Boulevard line service is vastly improved today compared with sixty years ago, with four routes (E, F, M, R) crossing the East River to Manhattan rather than just two.
Crosstown
Back in 1954 the only service on the Queens Boulevard local was the GG Crosstown route to Brooklyn, today’s G train. As a result that service carried 14 AM peak trains with 98 subway cars according the map. Today the G train has been cut back to Court Square, to allow additional Queens Boulevard trains to travel to Manhattan. For those in Brooklyn service was also cut back, to 8 AM peak hour trains with just 40 cars. Recently the G train has been extended to Church Avenue in Brooklyn, providing Crosstown service to five additional stations. These stations now have eight more peak hour trains and 40 more cars than they did in 1954. But the number of trains to Manhattan is unchanged, and because those trains serve an additional 11 stations south of Church Avenue, they are more crowded.
Summary
With annual ridership approaching all-time highs, New York City’s rapid transit system is smaller than it once was. Lightly-built, pre-subway elevated lines have been removed from Second, Third, Sixth and Ninth Avenues in Manhattan, Third Avenue in the Bronx, and Fulton Street, Fifth and Myrtle Avenue in Brooklyn. Rapid transit service was removed from the Queensboro and Brooklyn Bridges. Light rail (trolley) service was removed from all the East River bridges.
Most of those removals, however, took place before 1954. Generally at or before the time the City of New York purchased the IRT and BMT in 1940. And in most cases newer subway lines run under or near the streets where the Els once ran. The only location where the shrinkage of the infrastructure is the primary reason for the decrease in subway service since 1954 is the East Side of Manhattan, where the Third Avenue elevated was still running (barely) in 1954.
And yet, despite soaring ridership, the MTA is providing less subway service than New York City Transit did 60 years ago. And the MTA is broke, temporary real estate bubbles aside, despite squeezing more and more riders into fewer trains under worse and worse conditions. Why? That is the subject of the next post.