
The Bureau of Labor Statistics released rebenchmarked wage and salary employment data for 2015 last Friday, and I took a look to see how New York State’s public and private sectors are faring. The data show that after falling each year from 2009 to 2014, statewide local government employment increased by 4,000 (0.4%) from 2014 to 2015. But the increase was concentrated in New York City, where local government employment rose by 4,300 (0.9%) and private sector wage and salary employment (excluding the Health Care and Social Assistance sector, which is substantially government funded) increased by 95,100 (3.3%). In the rest of New York State local government employment fell by 300 in total, with an increase of 1,700 in Nassau and Suffolk more than offset by decreases elsewhere. But private sector wage and salary employment (excluding the Health Care and Social Assistance) increased by just 21,900 (0.7%).
Despite this short-term trend, a longer-term trend of falling local government employment relative to private sector employment remains in place. That trend is due in part to more money being shifted to retired public employees, leaving less for those still on the job, and falling private sector wages relative to public sector compensation, which means that private sector workers can afford fewer public sector workers. It also may be the result of an attempt to bring down New York’s sky-high state and local tax burden relative to the income of state residents. Further discussion and some charts follow after the break.
The spreadsheet used to create the charts in the rest of the post is here.
NY Local Government BLS 1990-15
The data is annual average employment, which is the employment level for each of the month of a year added together and divided by 12. This removes seasonality. All else equal, private employment tends to rise through June, then drop in July, and rise even more through December before plunging in January. The annual average is the representative employment level for the year as a whole.
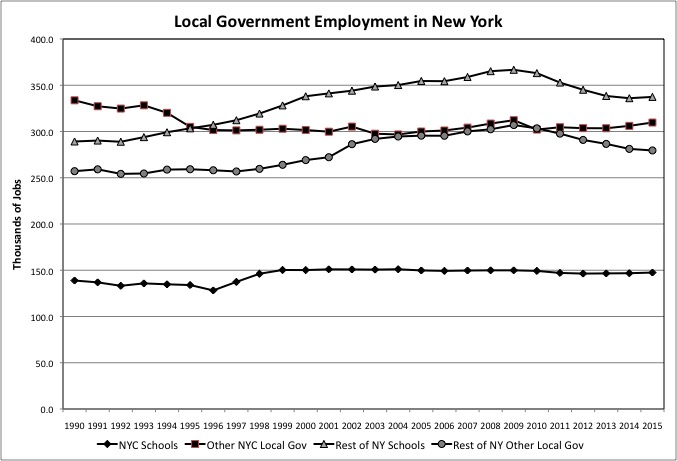
A longer term look at the data shows that a local government boom in the portion of New York State outside New York City came to an end in 2009. That was part of Governor Pataki’s “everybody onto the government payroll and into the pension” “economic development” plan for the rest of the state. During that period New York City was under constant pressure to make local government more efficient and do more with less, particularly after the 2000 pension increase diverted more of its budget to pensions. Most of the decrease in NYC local government employment took place in the deep early 1990s recession. Since then there have been some ups and downs, but the overall local government level has been generally flat.
Since 2009 local government employment has been falling in the rest of the state, although that decrease nearly came to an end from 2014 to 2015. New York City local government employment stopped falling after 2013 and increased from 2013 to 2015, although it remains below the level of 2009. As is usually the case, local government employment started falling some time after the recession, as elected officials put off decreases as long as possible.
Adding it up, there is has been a decided shift to private sector employment in New York State since 2009. Although part of this is a cyclical upturn, some of it appears to be due to changes in public policy.
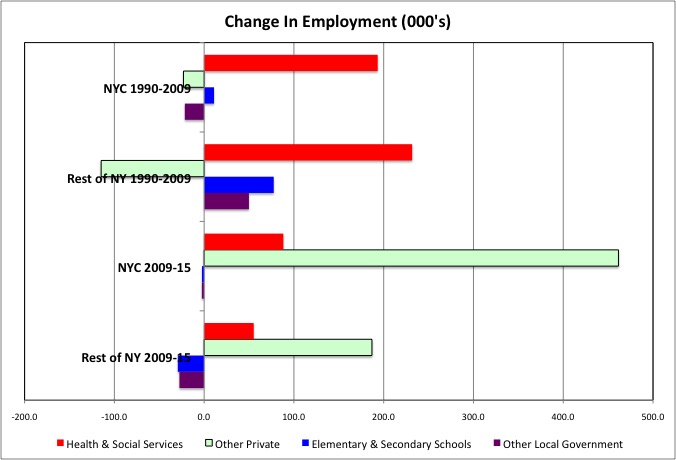
From 1990 to 2009, private Health and Social Assistance employment increased by 231,700 in the part of New York State outside New York City. That sector is, once again, substantially government funded. Meanwhile local government employment increased by 77,500 for elementary and secondary schools, and by 49,900 for other local government activities. There were fewer private sector workers to carry this burden: employment the rest of the private sector fell by 114,700.
From 2009 to 2015, in contrast, the rest of the private sector added 186,000 jobs in the rest of New York State. The Health Care and Social Assistance sector was up 55,200, but elementary and secondary school employment fell by 29,300 and other local government employment fell by 27,500. The local government boom in the rest of New York State turned to a bust after 2009.
In New York City, Health Care and Social Assistance employment soared by 193,300 from 1990 to 2009, but elementary and secondary school employment increased just 11,000 and other local government employment fell 21,500. Like the rest of New York State, New York City had a publicly-funded health care employment boom from 1990 to 2009. But unlike the rest of the state, New York City did not have a local government boom. As for the rest of the private sector, its employment ended up about where it started over this period, with a small decrease of 23,00.
From 2009 to 2015, however, New York City’s private employment (excluding Health Care and Social Assistance) soared by 461,500, a stunning increase. Health Care and Social Assistance employment increased by 88,200. But local government employment was down slightly despite an upturn in the past couple of years. Thus the longer term trend of flat NYC local government employment since 1995 remains in place.
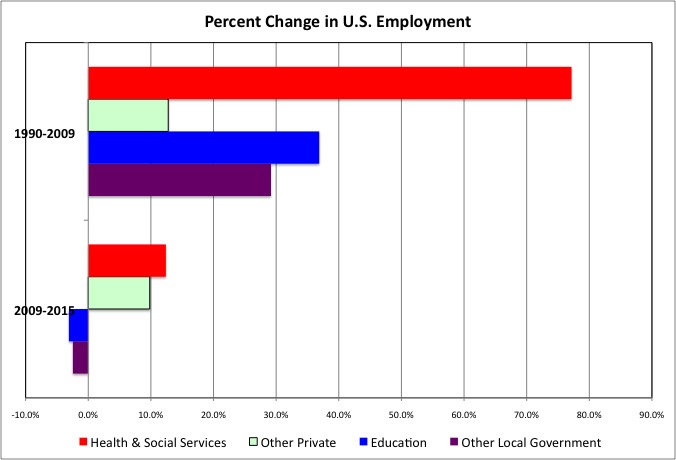
The shift to private sector employment may also be observed for the U.S. as a whole. From 1990 to 2009 wage and salary employment increased by 36.9% for local government education and 29.2% for other local government. From 2009 to 2015, however, these figures decreased by 3.1% and 2.5% respectively. From 1990 to 2009, U.S. private Health Care and Social Assistance employment soared by 77.2%, far faster than the mere 12.8% increase for the rest of the private sector. But from 2009 to 2015 Health Care and Social Assistance employment increased by 12.4%, only slightly faster than the 9.8% for the rest of the private sector.
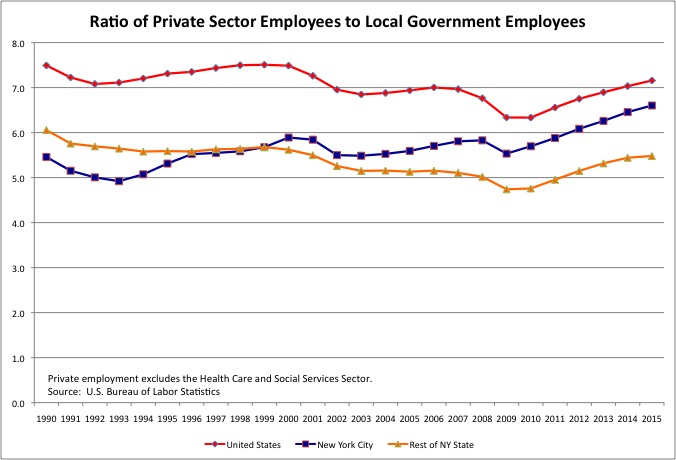
As a result, for the U.S. as a whole the ratio of private sector jobs, excluding Health Care and Social Assistance, to local government jobs is going up. In 2007 there were 7.0 such private sector jobs for each local government job. After falling in the Great Recession, that ratio was back up to 7.2 in 2015.
Compared with the U.S. as a whole, New York City’s private sector employment is smaller relative to its local government employment, for two reasons. First, it provides local government services that most localities do not, notably in mass transit, public housing, and public hospitals. This makes its local government employment relatively larger. Second, Health Care and Social Assistance is a larger share of total private employment in NYC than in most places, and this makes the rest of its private sector somewhat smaller. Even so, in 2015 NYC had 6.6 private sector employees (not including Heath Care and Social Assistance) for each local government worker, up from as few as 4.9 back in 1993.
Until the Pataki local government boom, the private sector was larger in the rest of New York State, relative to the size of local government, than in New York City. That has now changed decisively. Even so, from a low of just 4.7 private sector workers (not including Heath Care and Social Assistance) for each local government worker in 2009, the rest of the state is back up to 5.5 as of 2015. To put this in perspective, however, NYC has not had fewer than 5.5 private sector workers for each local government worker since the early 1990s.
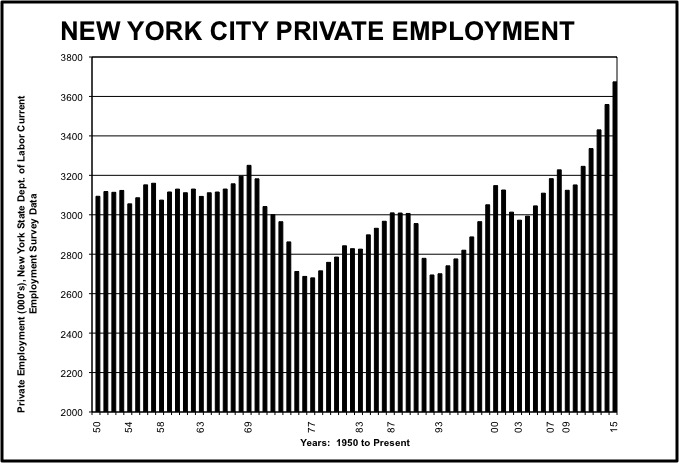
New York City’s ratio has improved in part due to local government hiring restraint, and in part due to a huge private sector boom. For decades the record private sector employment level of 1969 had loomed as a seemingly insurmountable barrier in the city’s economy, one at times approached but never exceeded. Since 2012, however, NYC private employment has soared to new heights, leaving that 1969 peak far behind.
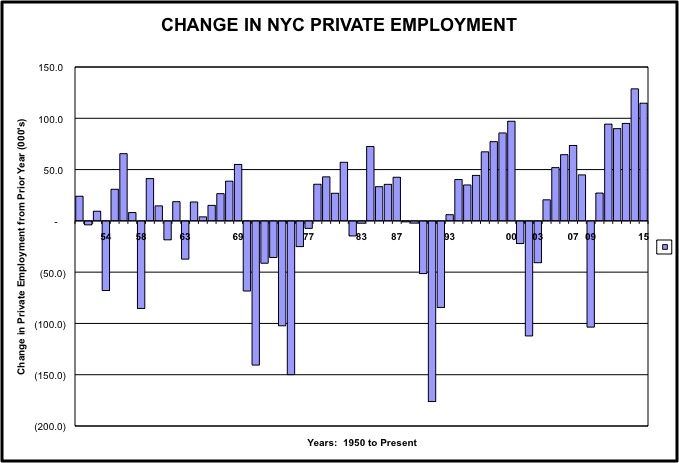
In fact, NYC’s private sector added more wage and salary jobs in each of the past two years than in any prior year since 1950. And this data on wage and salary employment does not even include the rapid growth of “freelance” and contract self-employment in the city, as discussed here.
Some Notes About New York from the Bureau of Economic Analysis
Good news in many ways, the New York City’s economic boom comes with two concerns.
First, how many more working people can the city’s built environment accommodate, with soaring housing prices and overloaded subways?
And second, how can one have confidence in the future when there is no money to expand and maintain that infrastructure, and pension funding continues to fall behind, in an economy as good as it can possibly get in the “new normal?”
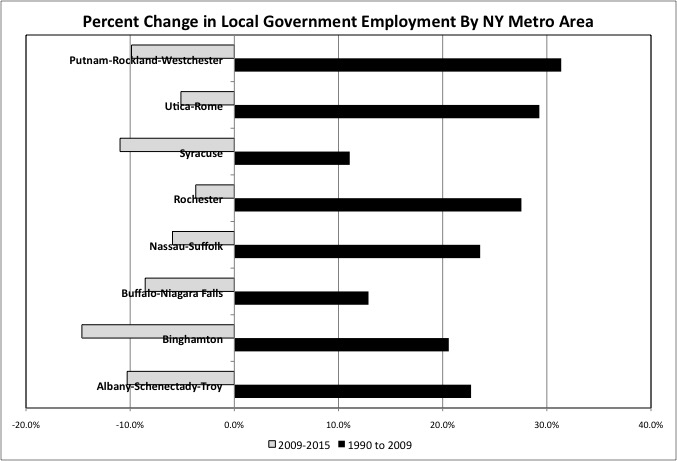
Most of the rest of New York State, like most of the rest of the U.S., probably wishes it had New York City’s problems of growth. The only metro area in the rest of the state where the 1990 to 2009 local government boom has been fully reversed is metro Syracuse. Everywhere else, an increasingly lower-paid private sector workforce is not only carrying more local government workers than in 1990, but also far more retired local government workers.
Thus the increasing push to have the State of New York redistribute even more money out of New York City to pay for local government employment elsewhere. I’ve described the attitude of the rest of the state toward the needs of New York City over the decades as falling into one of three categories.
- You don’t deserve it, since so many people in NYC are on the dole.
- You don’t need it, because you are booming, and besides NYC residents are used to paying more for less.
- We don’t have it, because you are in recession and not paying enough in state taxes.
The current attitude is number 2. But with Wall Street bonuses and profits trending down, number 3 might be right around the corner.