
Relative to population and even, in some places, in absolute numbers, state and local government employment has fallen in recent years as the cost of retired public employees has soared and tax bases have stagnated. Although many states and localities tried to shield elementary and secondary schools from the fiscal impact of past decisions as long as possible, in the wake of the Great Recession the schools have not been immune.
There are other factors, however, that have offset falling employment. First with the large “Baby Boom echo” generation exiting school age, school age children are a shrinking share of the population. In fact the number of children age 3 to 17 enrolled in school has fallen in the U.S. in absolute numbers from 2002 to 2014. And second, private school employment is rising in many places including New York City, where it was relatively high to begin with.
This is the second of a series of posts based on Census Bureau public employment data for March 2014, as compared with March 2002. The first post in the series, which described how the data was tabulated, provided a brief overview, and linked to a spreadsheet with the tables, is here.
The remaining posts will examine individual government functions in turn.
Far more detailed data is available in Census of Governments years. My more detailed post on elementary school employment based on the Census of Governments for March 1992, March 2002, and March 2012 is here.
Public Schools: 2012 Census of Governments Employment and Payroll Data
Long-term data on public school spending was discussed here.
New York’s Sky-High Public School Spending
The Census Bureau data for non-Census of Governments years is available for fewer, larger geographic areas. This post will compare elementary and secondary school employment and payroll for the U.S., New York City, the Rest of New York State, New Jersey and Connecticut. It compares March 2002, which in New York City was under the last budget of former Mayor Rudolph Giuliani and prior to Mayoral control of the New York City public schools, with March 2014, under the last budget of former Mayor Mike Bloomberg. This data, therefore, and other data for these years, show what happened under the Bloomberg, Mayoral control era.
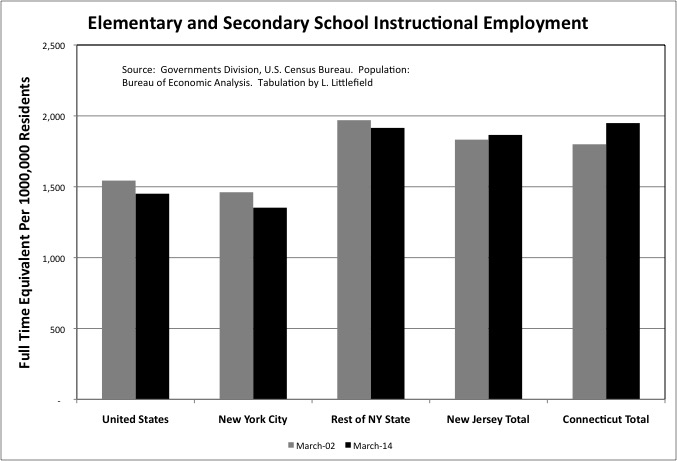
The data shows that New York City had 1,352 full time equivalent elementary and secondary school instructional workers (mostly teachers) per 100,000 city residents in March 2014, down from 1,461 in March 2000 and below the U.S. average of 1,451. The U.S. average fell as well during these years. The absolute number of FTE Instructional Workers decreased only slightly in NYC from 2002 to 2014, but the city’s overall population increased substantially, reducing the ratio.
Elementary and secondary school instructional employment was far above average per 100,000 residents in the Rest of New York State in 2014 at 1,915, although down from 1,970 in 2002. The number of elementary and secondary school instructional workers was not only far above the U.S. average in New Jersey and Connecticut in 2014, at 1,832 and 1,949 respectively, but was also up from 2002. Despite massive fiscal crises in these states, which I chronicled here.
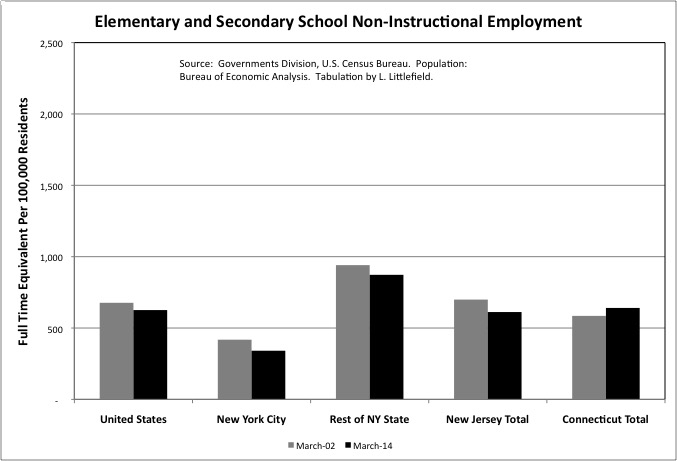
The Rest of New York State is also far above the U.S. average in non-instructional elementary and secondary employment per 100,000 residents, at 873, compared with 626 for the nation as a whole. New Jersey and Connecticut are closer to the U.S. average. While the Rest of New York State was the far out of line in this category, its non-instructional employment per 100,000 residents did fall from 2002 to 2014. There was also a decrease in New Jersey. In Connecticut, there however, was a 9.5% increase. These areas have all suffered a loss of high wage, high benefit jobs in large organizations in recent years. High non-instructional employment may result from a demand by politically influential people for such jobs, as much as a need for additional educational work.
Despite the bad reputation of the old Board of Education, New York City’s non-instructional employment per 100,000 residents was already well below the U.S. average in 2002. The U.S. average fell from 677 in 2002 to 626 in 2014. New York City fell from 418 in 2002 to just 341 in 2014. New York City’s non-instructional elementary and secondary school employment per 100,000 residents was far less than half the level of the Rest of New York State that year.
New York City’s public school employment is low compared with its overall population for three reasons. First, the city tends to spend more on retired public employees, and less on those working. Second, a relatively small share of the city’s overall population is school age, as many city parents move to the suburbs when their children are in school so they can receive a better education. Third, for the same reason, New York City’s private elementary and secondary school enrollment – and employment – has always been relatively high as a share of total school enrollment.
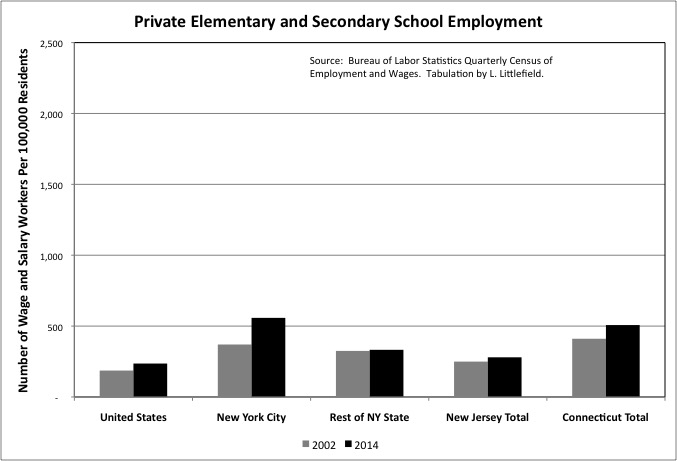
I was surprised to find that despite the ongoing fiscal crisis in Catholic education, with schools caught between the modest means of Catholic school parents and the low pay of Catholic school teachers, in New York City total private elementary and secondary school employment increased by nearly 60.0% from 2002 to 2014. While still low compared with public school employment, the increase was from 370 employed per 100,000 residents in 2002 to 558 per 100,000 in 2014.
Smaller increases, to lower levels, were observed in the U.S., the Rest of New York State, New Jersey and Connecticut as well. In fact the Connecticut the private school increase was substantial even as that state’s population was aging and its public school employment per 100,000 residents was rising as well.
It would make sense to compare public elementary and secondary school employment with public elementary with public school enrollment, rather than the total population, to get a more accurate reading of relative levels and trends. Public school enrollment data for 2014 from the Census Bureau, however, will not be available areas until June, when FY 2014 public school finance data is published.
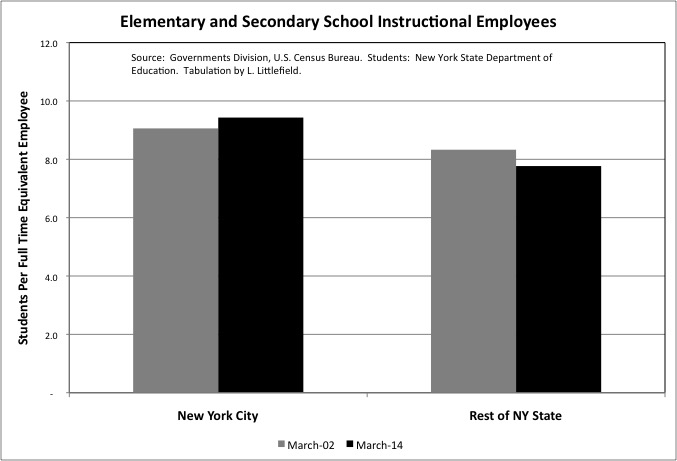
Using enrollment data from the New York State Department of Education, however, I find that New York City public schools had just 9.4 students per instructional employee in 2014, up from 9.1 in 2002. Despite class sizes that are much, much higher than that. While NYC instructional employment fell slightly between these two years, NYC public school enrollment actually increased slightly. Given NYC’s school crowding, extremely high school spending per student (including retirement costs), and long term fiscal problems, one wonders how bad the consequences will be if the many young adults who have moved to the city have children and try to send them to school here.
In the rest of New York State, on the other hand, instructional employment also fell just slightly while public school enrollment fell by nearly 140,700 (7.7%). As a result there were just 7.8 students per instructional workers in 2014, down from 8.3 in 2002. Despite this, public schools in rest of New York State have cut services, and are demanding more money to restore them. I’ll redo this chart with more areas when additional data becomes available.
Excluding those working the overpaid Finance and Insurance sector in Manhattan, private sector wage and salary workers in Downstate New York earned 29.7% more than the U.S. average in 2002 and 27.9% more than average in 2014. Since this difference affects the local cost of living, one might assume that Downstate New York’s public sector workers should also earn more than the U.S. average. And they did – local government workers in New York City earned 34.5% more than the U.S. average for local government workers in March 2014. (The difference in retirement benefits is far greater).
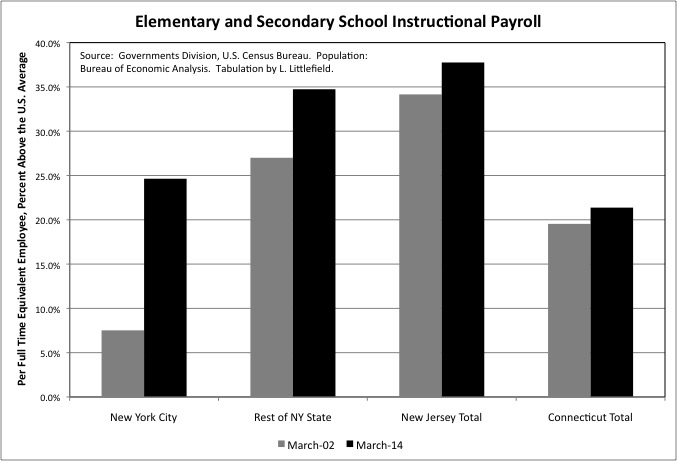
In March 2002, however, New York City’s elementary and secondary school instructional employees earned just 7.5% more than the U.S. average, measured by average March payroll per FTE employee. As noted in the prior post, NYC’s March figures seem somewhat lower relative to the U.S. than their annual pay, because NYC teachers are paid year-round whereas teachers in some other areas are only paid when school is open. Still, one could conclude that NYC teacher pay was relatively low at the start of the Bloomberg Administration. The March payroll per FTE instructional worker, however, was 24.6% more than the U.S. average in 2014. In reality was even higher, because teachers were working under expired contracts at the time for which retroactive pay has subsequently been recorded. The greater extent to which NYC teachers are paid more than the U.S. average in cash, let alone in benefits, will show up in the data for later years. But one could conclude that NYC instructional cash pay is now in proportion with private sector cash pay in NYC.
In exchange for this large increase in average payroll per employee, the United Federation of Teachers believes that its members owe New Yorkers — absolutely nothing. In fact, they demand far more. One reason may be the trend in the rest of NY State. There average payroll per employee was 27.0% higher than the U.S. average in March 2002, or about what NYC probably was in 2014 adjusted for pay subsequently awarded under the recent contract. But it increased to 34.7% more than the U.S. average in March 2014. Note that three fifths of the instructional employees in the Rest of New York State are located in Upstate New York, not high-wage high-cost Downstate New York. There, the average private sector worker earned 9.0% less than the U.S. average in 2002, and 11.9% less than the U.S. average in 2014. Following the education press, the representatives of teachers elsewhere in the state also assert they are being cheated, and demand more.
One sees the same pattern – elementary and secondary school instructional workers getting richer relative to the U.S. average, and private sector workers getting poorer – in New Jersey and Connecticut. In New Jersey, the average payroll per private sector worker outside Finance was 22.8% above the U.S. average in 2002 but just 17.3% above the U.S. average in 2014. New Jersey’s March payroll per elementary and secondary school instructional employee was 34.2% above the U.S. average in 2002, and 37.8% above average in FY 2014. In Connecticut, the average private sector payroll per worker outside Finance was 21.3% above the U.S. average in FY 2002 and 16.0% above average in FY 2014. Connecticut’s March payroll per elementary and secondary school instructional employee was 19.5% above the U.S. average in 2002, and 21.4% above average in FY 2014.
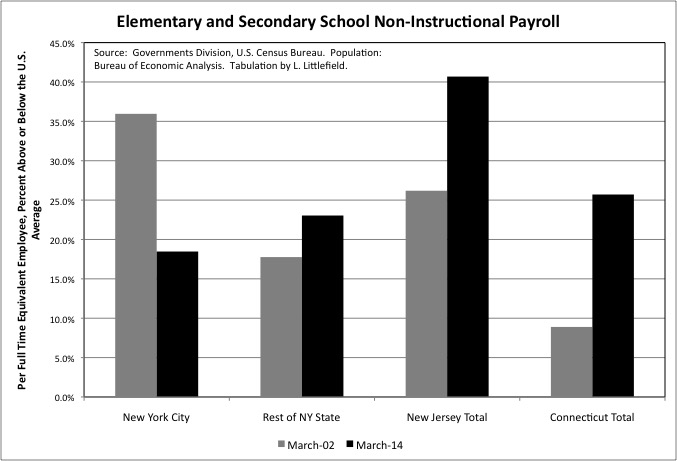
While New York City’s elementary and secondary school instructional employees were arguably underpaid compared with similar workers elsewhere in 2002, if one makes no adjustment for their qualifications, hours, days and years worked and level of effort at the time. One could make the case that NYC’s non-instructional workers – while relatively few in number – were paid quite well back then. Their March payroll per full time equivalent worker was 36.0% higher than the U.S. average that year. Before Mayoral control, there were frequent reports about how much more money school custodians were paid compared with NYC teachers. NYC payroll per non-instructional employee, however, fell to just 18.5% above the U.S. average in 2014.
The Rest of New York State went in the other direction, with payroll per non-instructional worker increasing from 17.8% above average in 2002 to 23.0% above average in 2014. So did New Jersey, where the increase was from 26.2% above average to 40.7% above average. And Connecticut, where the increase was from 8.9% above average to 25.7%, even as non-instructional employment also increased.
The picture of the resources New York City applied to public education is not complete without including the large increase in teachers who are retired, based on a pension that awards one year of paid retirement for each year worked, and the average amount paid under that pension, which was increase hugely and retroactively in 2000. The employment and payroll data, however, show a very low student-worker ratio for instructional workers, and a big increase in pay. In the Rest of New York Sate, however, school employment is extremely high relative to the U.S. average, and payroll per worker is high and going higher. The number of active and retired public employees and their pay that public schools demand to provide the same services as before, or less, continues to increase.