
In the United States, more government workers are employed in elementary and secondary education than any in other local government function, and indeed any government function period. At the state level, however, more government workers are employed in colleges and universities than in any other function. In March 2014, according to data from the Governments Division of the U.S. Census Bureau, the states employed 547 full time equivalent workers in state colleges and universities per 100,000 people, up from 523 back in March 2002. This figure did not include most community colleges, which are generally assigned to local government, but did include the four year colleges of the City University of New York, now tabulated as state government despite its historic association with the City of New York.
The fact that state higher education employment actually increased relative to population over 12 years is surprising, given press coverage of reductions in services and courses available to students over those years. One reason may be that the large “Baby Boom Echo” generation was passing through the college years during this time, and may have been more likely to linger in graduate school given the job market in the aftermath of the great recession. The college age population has started to fall more recently and with it, college enrollment, according to press reports. This data, however, still raises a fundamental question. Given that the purpose of higher education purportedly is education, why were there more than twice as many full time equivalent state government higher education non-instructional workers in March 2014 than there were instructional workers?
This is the third of a series of posts based on Census Bureau public employment and payroll data for March 2014, as compared with March 2002. The first post in the series, which described how the data was tabulated, provided a brief overview, and linked to a spreadsheet with the tables, is here.
The prior post covered elementary and secondary school employment and payroll. More detailed data is available for the Census of Governments every five years, most recently in 2012. My post on public higher education employment and payroll using that data is here.
At the time I inquired if the number of instructional workers was kept down because adjunct faculty were not counted, while the number of non-instructional workers was inflated by student jobs. I was told the answer was no. The employment of each is supposed to be counted, and weighted into full time equivalent workers if they are less than part time. Of course it is always possible that all the forms are filled out incorrectly.
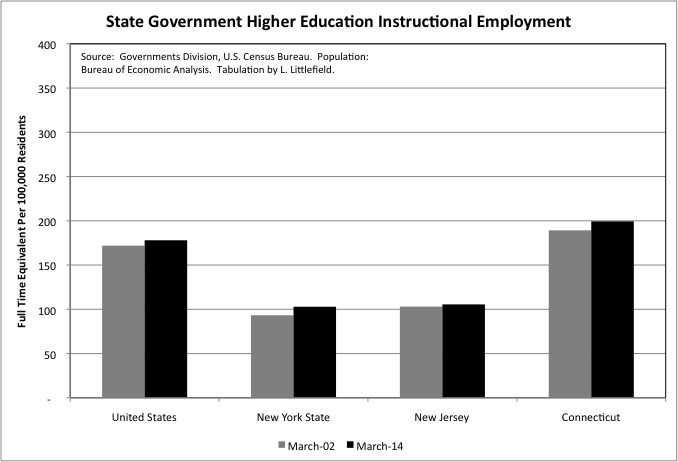
Compared with other parts of the country, a higher share of students in the Northeast attend private colleges and universities rather than state-run schools. As a result New York State had just 103 full time equivalent higher education instructional workers per 100,000 residents in March 2014, up from 93 in March 2002, and New Jersey had just 106, up from 103. The U.S. average was much higher at 178 in 2014, up from 172 in 2002. Connecticut, despite being the Northeast and being the home of Yale University and other prominent private colleges and universities, was above average in instructional higher education employment at 199 in March 2014, up from 189 in March 2002.
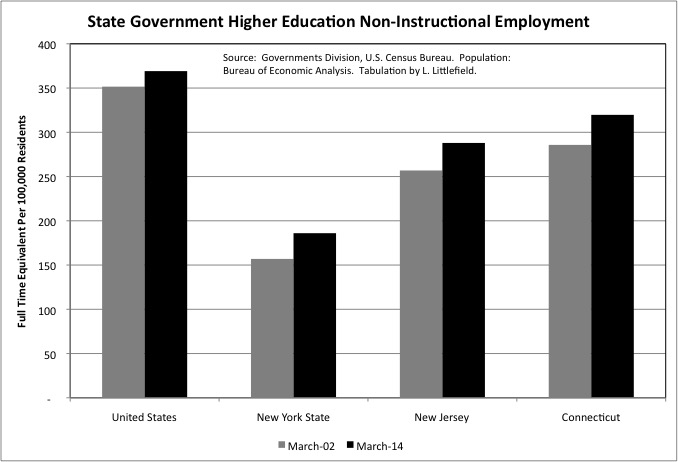
As of March 2014, state government higher education non-instructional employment is 2.1 times as high as instructional employment in the U.S., 1.8 times as high in New York State, 2.7 times as high in New Jersey, and 1.6 times as high in Connecticut. Like instructional employment, state government non-instructional employment has been rising relative to population in all areas examined. The ratio of non-instructional employment to instructional employment was slightly higher in March 2014 than it had been in March 2002 in the U.S. as a whole (up from 2.0 times instructional employment), New York State (up from 1.7), New Jersey (up from 2.5) and Connecticut (up from 1.5).
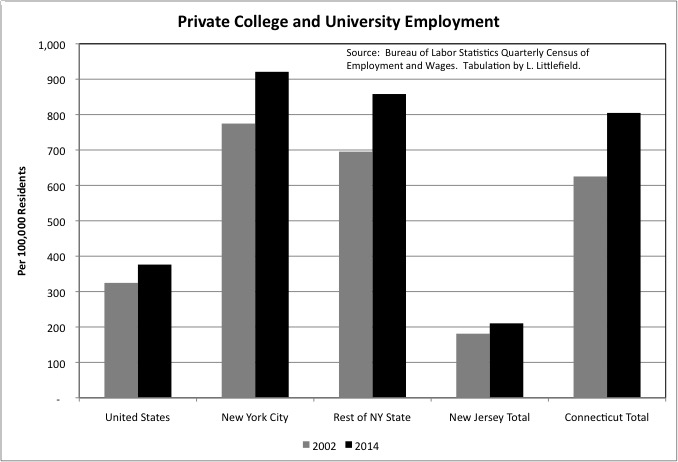
Private college and university employment has also been increasing relative to the total U.S. population. The U.S. had 376 workers in the private college and universities industry per 100,000 residents in 2014, up from 325 in 2002. But the numbers are much higher in New York and Connecticut. In New York City, private college and university employment increased from 775 per 100,000 residents in 2002 to 921 in 2014. In the Rest of New York State it rose from 695 to 858. As I showed using 2012 Census of Governments data, in the portion of Upstate New York outside the major metro areas private colleges and universities are a big part of the local economy.
In Connecticut, private college employment increased from 625 per 100,000 residents in 2002 to 805 in 2014. Combined with that state’s relatively high state government higher education employment, it is clear that Connecticut’s colleges and universities, net, are attracting students from other states. One such state might be New Jersey, where both public and private higher education employment are relatively low per 100,000 state residents, albeit increasing.
One may well wonder how public and private colleges and universities were able to increase their employment per 100,000 Americans from 2002 to 2014 despite falling wages and labor force participation over those years, and increasing financial strains on many families. Part of the answer appears to be an explosion of student loan debt, which now exceeds debts from car loans or credit cards.
http://www.bloombergview.com/quicktake/student-debt
One strategy to avoid student loan debt is to live at home and attend a community college for two years before finishing at a four-year college. Community colleges also provide two-year degrees, and vocational training in non-academic fields. Community colleges are generally classified as local government entities by the U.S. Census Bureau. Though not in Connecticut, where the state government operates them.
<img class="alignnone size-full wp-image-9963" src="http://r8ny.com/wp-content/uploads/2016/04/College4.jpg" alt="College4" width="678" height="462" srcset="http://r8ny.com/wp-content/uploads/2016/04/College4.jpg 678w, http://r8ny.com/wp-content/uploads/2016/04/College4-300×204 singulair pill.jpg 300w” sizes=”(max-width: 678px) 100vw, 678px” />
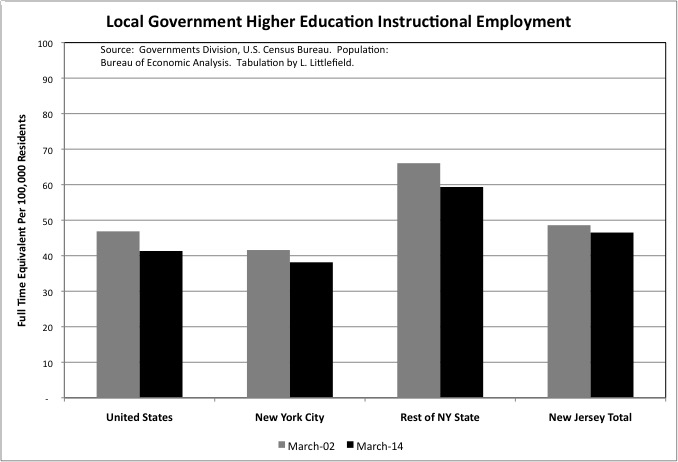
Nationwide, the 41 local government higher education instructional employees per 100,000 people in the U.S. in March 2014 was less than one-quarter the level of state higher education instructional employment, and it was down from 47 in March 2002. There were also decreases in New York City, the Rest of New York State, and New Jersey. Perhaps because of local government fiscal crises. Perhaps because community colleges are something one pays for rather than borrows for, and fewer young adults had the jobs and thus income required to pay for classes.

One factor that increases non-instructional employment at state colleges and universities is students residing on campus, who require meal services and residences. Most community college students, in contrast, presumably live at home and commute to school. Even so, non-instructional higher education employment exceeds instructional community college employment at the local government level as well. In March 2014 non-instructional employment was 1.5 times as high as instructional employment in the U.S, 1.7 times in New York City, 1.4 times in the Rest of New York State, and 1.6 times in New Jersey. Non-instructional employment per 100,000 residents increased from March 2002 to March 2014 in both New York City and the Rest of New York State, even as instructional employment fell.
Around the tri-state area, average private sector pay has been falling relative to the U.S. average, as described in the prior post. And, of course, the U.S. average for private sector pay hasn’t exactly been soaring either.
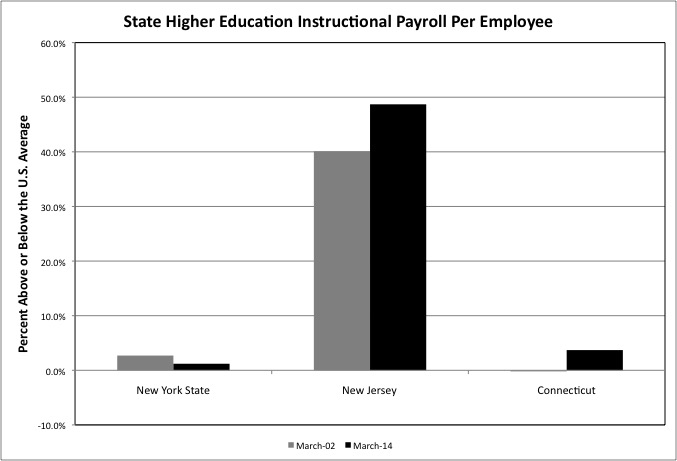
Note: I have discovered an error in the calculations in the chart above and below. This is the corrected version. Sorry about that, but I’m just one guy putting out a lot of stuff.
In New York State, the average payroll per full time equivalent state government instructional worker in higher education decreased from just 2.7% more than the U.S. average in March 2002 to 1.2% above average in March 2014. While many SUNY employees are located in low-cost Upstate New York, many CUNY employees are located in expensive Downstate New York. CUNY workers had been without a contract and a raise for some time in March 2014. Instructional pay per worker, measured the same way for the same years, increased from 40.1% above average to 48.7% above average in New Jersey. The increase in Connecticut was from 0.2% below average to 3.7% above average.

State non-instructional employees earn more, relative to the U.S. average, in New York State, New Jersey, and Connecticut, but that gap shrank from March 2002 to March 2014.
In New York, New Jersey and Connecticut, local government higher education (community college) pay is much lower, relative to the U.S. average, than state government higher education pay. Although at the local level higher education pay did increase, relative to the U.S. average, from 2002 to 2014. For instructional workers, the March 2014 payroll per employee was 21.1% above the U.S. average in New York City, 6.5% higher in the Rest of New York State, and 4.3% lower in New Jersey. For non-instructional, it was 19.6% above average in New York City, 5.1% in the rest of the state, and 6.0% in New Jersey.
Anecdotally, it would seem that community colleges play a lesser role in the Northeast than in other parts of the U.S where vocational education, and non-professional vocations, are more respected.