
One of the big issues in last year’s New York City budget negotiations was the level of police staffing. The Patrolmen’s Benevolent Association and the politicians it helps keep in office asserted that without thousands of additional dues-paying members, New Yorkers would no be longer kept safe. The debate went on and on for months, with many articles and reports from many news sources based on many press releases and statements from many interested parties. Through it all, however, I cannot recall a single report providing objective information on how many police officers New York City already has, relative to its population, compared with other places. In the end the number of officers was increased by 1,000, although I don’t recall any PBA statements conceding that its members were willing to keep us safe in exchange.
This is the fourth post in a series on state and local government employment for FY 2002 to FY 2014, based on data from the Governments Division of the U.S. Census Bureau. The data shows that while police officer employment is down per 100,000 residents in New York City compared with 12 years earlier, mostly due to falling behind the city’s population growth (though the number of officers also decreased), it remains at the same ratio it has been relative to the U.S. average. New York City had 2.8 times as many police officers per 100,000 residents as the U.S. average at a time that New Yorkers were being threatened if they didn’t’ pay up for thousands more, and nobody deigned to even talk about this.
First the usual housekeeping. The first post in the series, which described how the data was tabulated, provided a brief overview, and linked to a spreadsheet with the tables, is here.
This post is about data on state and local government police, fire, and corrections employment and payroll for New York City, the rest of New York State (by subtraction from the state total), New Jersey, Connecticut and the United States. It is survey data and generally only reported at the state level, although individual unit data is always reported for the City of New York. Data for all local areas (most comparable at the county level) is available for the Census of Governments every five years, most recently in 2012. My post based on the Census of Governments for public employment and payroll data for public safety functions, from April 2014, is here.
Public Safety: 2012 Census of Governments Employment and Payroll Data
The Census of Governments allowed NYC to be compared with major urban counties around the country. For this analysis, I’m comparing employment and payroll in March 2002, under the last budget before the administration of former NYC Mayor Bloomberg, with March 2014, the last Bloomberg budget. As discussed previously the period from 2002 to 2014 was one of fiscal constraint, not only in New York City but throughout the nation, as taxpayers became relatively poorer and this put downward pressure on tax revenues, and the public employee pension increases of the 1990s and early 2000s started to be paid for. The general trend in public employment was down relative to population. But how about public safety employment in New York City?
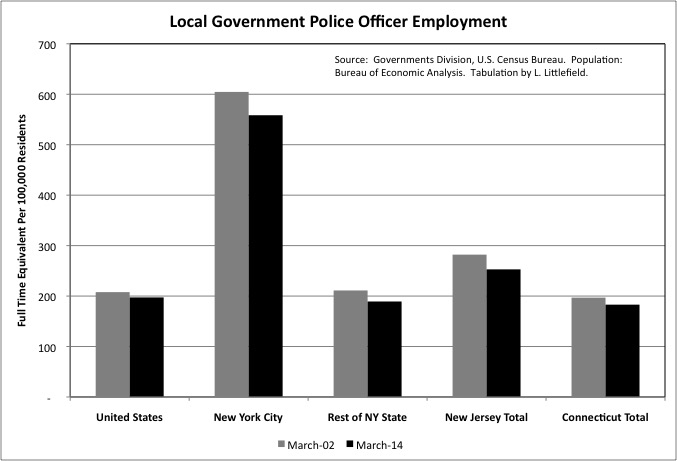
Local government police employment per 100,000 residents fell in New York City, the rest of New York State, New Jersey and Connecticut from March 2002 to March 2014. In New York City the decrease was from 605 per 100,000 residents to 558, but that was still 2.8 times the U.S. average of 197. The rest of New York State and Connecticut are slightly below average in police employment, with New Jersey significantly above average – but less than half the level of New York City. Using Census of Government data, I had previously shown that New York City also had more police officers per 100,000 residents than the other major urban counties across the country, such as Los Angeles, Cook (Chicago), Philadelphia etc.
With half pay retirement after just 20 years of work at any age, something virtually unheard of anywhere else in the U.S., New York City also has far more retired officers than officers on the job, and has since 2002. The most recent pension data was discussed here, and shows the NYC police pension fund had just 0.74 active members for every beneficiary.
With that many officers and that many retirees, NYC is paying for a whole lot of police – more than anywhere else except, perhaps, the District of Columbia (Washington DC).
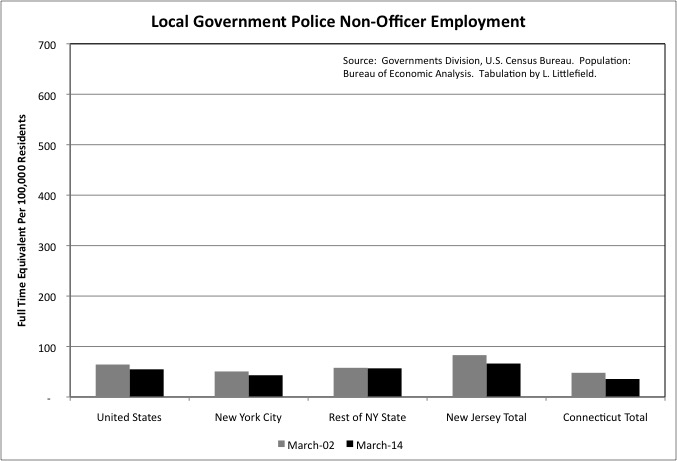
The Census Bureau defines a police officer as someone with the power to arrest people. Thus someone like NYC Police Commissioner Bill Bratton presumably qualifies. To the extent that NYC police staffing has been in the press in the past few decades, the issue has been civilianization. The assertion that the City of New York employs police officers to do work that could be, and elsewhere is, done by less expensive civilian employees.
NYC did employ fewer police non-officers per 100,000 residents than the U.S. average in March 2014, but the number of civilians in the police function is relatively low everywhere, and does not come close to explaining why NYC has so many officers. (The two charts have the same scale). That remains unexamined, although one rumor is that the NYPD quickly promotes most officers from low-paid patrol to higher-paid specialized squads. That would explain why the city, despite already having 2.8 times as many officers as the U.S. average relative to population, required another 1,000 to “put the cop back on the beat.”
http://www.nydailynews.com/new-york/nyc-crime/nypd-hire-800-recruits-move-415-cops-desk-duty-article-1.2271820
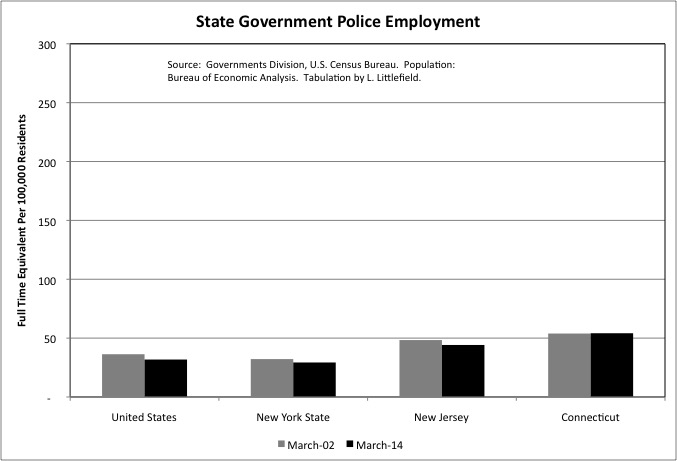
At the national level and in most states state police employment per 100,000 residents, shown here in the same scale, is much lower than local government police employment. New York State is below the U.S. average in state police employment. The state police are more important in rural areas and along state highways, since rural areas have fewer local police officers. This is somewhat of a subsidy for those rural areas, since the state police are nonetheless funded by all state residents. One seldom sees a state police officer in New York City, for example. The state police, and state government workers in general, are more important and larger in number in small states such as Connecticut and New Jersey, where the state capital is not far away and many police services are centralized at the state level.
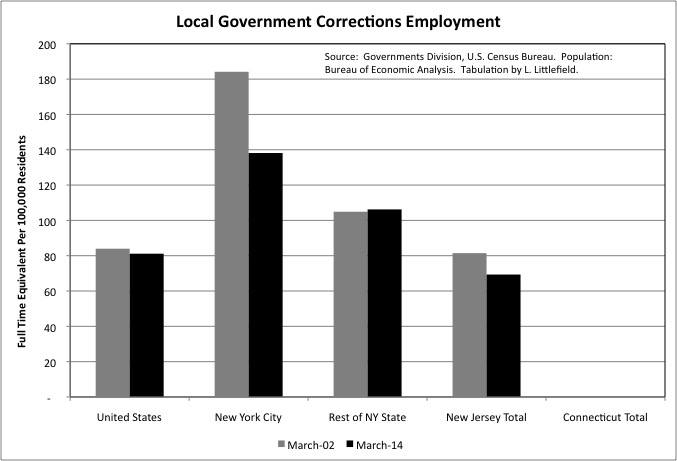
One example of this is corrections employment. In general, local government jails hold prisoners awaiting trials, or convicted of misdemeanors with short sentences, while state prisons hold prisoners serving longer sentences. Connecticut, however, has no local government corrections employment. Corrections employment is all at the state level there.
With 20 years of falling crime since the crack-era peak of the 1990s, and increasing interest in alternatives to incarceration, local government corrections employment has been falling relative to population in most of the U.S. and in the U.S. as a whole. In New York City, it fell from 184 per 100,000 residents in March 2002 to 138 per 100,000 residents in March 2014, a 25 percent decrease. For comparison, the number of police officers in NYC fell by just 7.8% over those years. NYC’s local government corrections employment remains far above the U.S. average of 81, the rest of New York State at 106, and New Jersey at 69. At some points during the peak of the crime wave, New York State forced New York City jails to hold some prisoners that should have been in state prisons, although I’m not sure if that is still true today.
Corrections, like higher education, is a function for which employment and spending are concentrated at the state government level rather than the local government level. For the U.S. as a whole state colleges and universities employ the most state workers of any function, followed by state prisons and then state hospitals, and these three functions together accounted for nearly three-fifths of state government employment in March 2014.
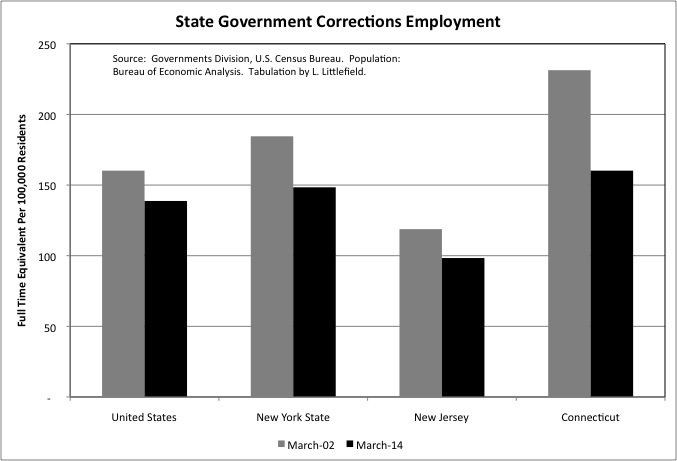
As is the case for local government corrections employment, state government corrections employment fell with the crime rate from March 2002 to March 2014. For New York State the decrease was from 185 full time equivalent employees per 100,000 residents to 148, a decrease of 20 percent. New York was still higher than the March 2014 U.S. average of 139, while New Jersey was lower at 98. Connecticut was higher, but with no corrections employment at the local level.
Crime tends to be low in the Northeast. In 2012, New York State’s FBI index violent crime rate was slightly higher than the U.S. average at 406.8 per 100,000 residents compared with 386.9, but its property crime rate was much lower at 1,922 compared with 2,859. New Jersey and Connecticut were each far below the U.S. average in both violent and property crime. With relatively low crime, New York State tends to have more state prison employees relative to the number of prisoners. Then again, many states have prison overcrowding issues and New York does not. While prisons were once treated as an Upstate jobs program in New York State, the state has recently shifted to trying to expand private employment in that region rather than giving everyone a government job.
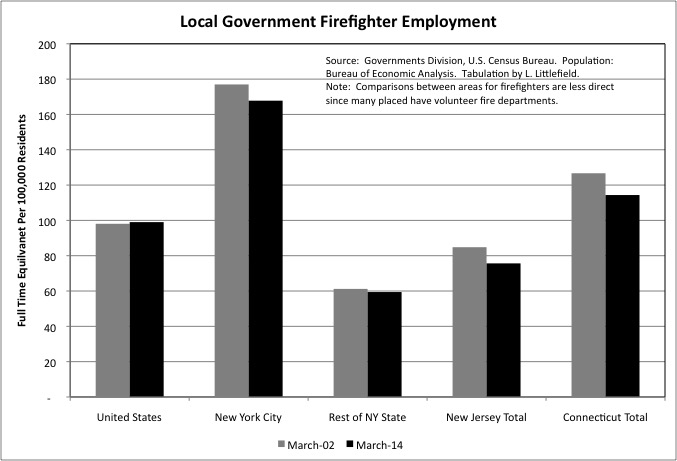
While every jurisdiction has schools and police, the extent of other local government services varies widely, with large cities typically providing more and rural areas providing fewer. Many rural and suburban areas have volunteer, rather than professional, fire departments, or a mixture of professional and volunteers. Thus while New York City has far more firefighters than the U.S. average, at 168 per 100,000 residents compared with 99, and far more than the Rest of New York State, New Jersey or Connecticut, the comparison isn’t as accurate as it is for education or police.
New York City firefighter employment decreased per 100,000 residents from March 2002 to March 2014, as the number of firefighters stayed about the same but the population increased. As is the case for police officers, there are far more retired than active NYC firefighters due to a 20 and out pension. In this case just two active firefighters for every three retired, and 62.7 percent of retired NYC firefighters are receiving more expensive disability pensions.
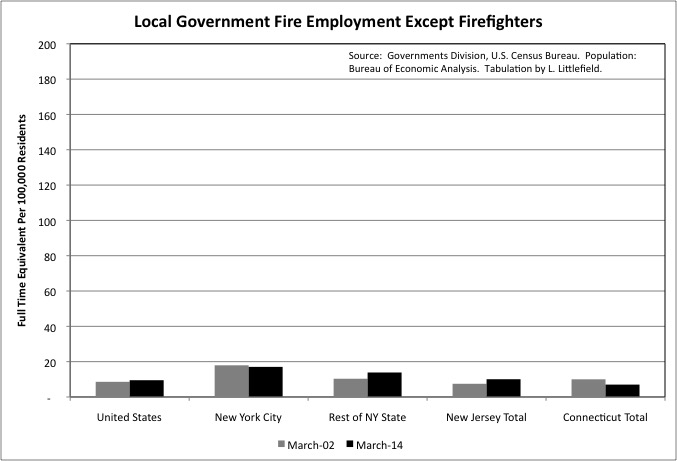
Unlike the case for the police, NYC had more civilian fire department workers per 100,000 residents than the U.S. average in March 2014, and more than the rest of New York State, New Jersey and Connecticut. Although as shown by putting the two charts in the same scale, the NYFD employs far more firefighters than civilians.
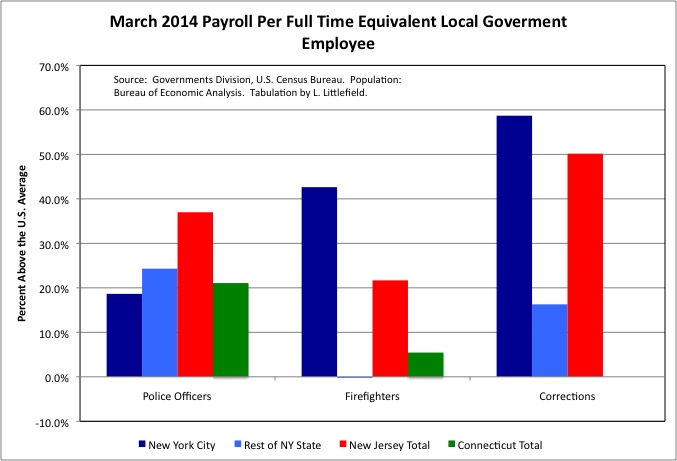
As noted in my introductory post, for New York City police officers, firefighters, and sanitation workers, March 2002 payroll per full time equivalent employee is not comparable with other places, because it was inflated by post-9/11 overtime. So this discussion will focus on March 2014 alone.
At that time the average NYC police officer earned 18.6% more than the average U.S. police officer. Given that the average private sector worker in Downstate New York, excluding the overpaid Finance and Insurance sector, earned 27.9% more than the U.S. average in 2014, one might conclude that police pay was a little low. Part of the reason, however, is that New York’s police officers had not had a raise in several years, while working without a contract and pushing for higher wage increases than private sector workers were getting and other NYC government workers subsequently agreed to. In March 2011, for example, the payroll per employee for New York City’s police officers had been 24.6% above the U.S. average.
It is still fair to say, however, that New York City, in part due to past demands from the PBA, combines relatively low pay in cash, particularly starting pay, with an extremely expensive police force due to high retirement costs and high staffing levels. As I noted in this post,
The Executive/Financial Class, the Political/Union Class, and the Serfs
the average NYC police officer in fact cost the people of the city $212,220 in wages and benefits in 2012, making the average police officer as well paid as the average worker in finance.
This policy reached an absurd conclusion during the mid-2005 when the PBA scored a contract that increased by for veteran officers in the middle of a fiscal crisis by cutting the starting pay for new hires to just $25,000 per year. The firefighters got the same deal. The PBA subsequently fought efforts to increase starting pay, which is still lower than it once was relative to the average officer. While I would assume that having low starting salaries despite high costs overall would be a disaster for recruitment, however, I can’t say that (aside from a few years when the $25,000 was in effect) the quality of recruitment has been low. After all, other police departments recruit NYPD officers with training in our police academy and a few years of experience.
In the rest of New York State, New Jersey and Connecticut the cost of the police is far lower – due to less rich pensions and lower staffing levels – but cash pay is much higher. In the Rest of New York State, Census of Government for March 2012 data shows that the extremely high cash pay levels for police relative to the U.S. average are found in the Downstate Suburbs. In March 2012, the payroll per employee for police officers was 55.9% higher than the U.S. average in the Downstate Suburbs, but just 7.8% above average in Upstate urban counties and 7.4% below average in Upstate rural counties. The average private sector worker earns less than the U.S. average in Upstate New York.
For all of the Rest of New York as a whole, payroll per police officer was 24.3% above the U.S. average in March 2014, up from 19.5% in March 2002. For Connecticut it was 21.1% above the U.S. average, up from 13.8%. For New Jersey it was extremely high at 37.0% above the U.S. average, up from 27.3%
The average pay per NYC firefighter was 42.6% above the U.S. average in March 2014, a pretty sweet deal given the high cost of firefighter retirement benefits and the fact that private sector pay per worker was just 27.9% higher than the U.S. average, finance excluded. In 2012, I found, the pay and benefits of NYC firefighters had cost the City of New York $229,140 each.
One thing that is confusing is how NYC firefighters managed to get ahead of NYC police officers. The firefighters had not settled their contract with the city in March 2014 either…
http://www1.nyc.gov/office-of-the-mayor/news/541-15/mayor-de-blasio-tentative-contract-agreement-uniformed-firefighters-association-
and the custom had always been for NYC police officers and firefighters to get the same deal. One possibility is that firefighter pay is falling relative to police pay elsewhere in the U.S., making NYC firefighters relatively better paid compared with their own kind, but the data implies otherwise.
Unlike the case for the police, NYC firefighters had a far higher payroll per employee in March 2014 than the rest of the state, New Jersey of Connecticut, perhaps because in those other areas taxpayers are prepared to shift to volunteers if the professional fire department becomes too expensive. That is frowned upon in New York City.
http://www.nydailynews.com/news/aviation-volunteer-fire-department-bronx-defy-fdny-respond-alarms-nabe-article-1.1011456
In any event, in the Rest of New York State payroll per firefighter went from 6.4% below the U.S. average in March 2002 to average in March 2014. Payroll per firefighter went from 24.5% above average to 21.7% above average in New Jersey, and from 4.9% above average to 5.4% above average in Connecticut. Adjusted for inflation, mean monthly payroll per employee increased from $5,935 to $6,152 in the U.S. from March 2002 to March 2014, an increase of 3.7%. The increase for U.S. police officers was from $5,868 to $6,026, a 2.7% gain.
NYC corrections workers are extremely well paid relative to the average local jailer, with a March 2014 payroll per employee what was 58.7% higher than the U.S. average of $4,488. Local government corrections pay is much lower in the Rest of New York State, New Jersey and Connecticut.