
Health care and social assistance, along with payments to individuals, account for the largest share of government spending for the federal, state and local governments combined. They are distinguished from other government functions in two important ways. First, most of the funding comes from the federal government, even for programs that are administered by states, cities and counties. And second, most of the work is done by private, often non-profit organizations under contract or voucher systems, rather than by public employees.
This is the fifth post in a series on state and local government employment for FY 2002 to FY 2014, based on data from the Governments Division of the U.S. Census Bureau. Data on private employment in sectors substantially funded by government programs was also included in the analysis, and will be particularly important for this post. New York State in general, and New York City in particular, have had far more spending in these categories than most other places. This is explained in part by the state’s Medicaid program, the most extensive and expensive in the country, and in part by New York City’s relatively high poverty rate, although that gap is closing. And in part by New York’s virtually unique commitment to public intervention in the multifamily housing market, rather than just in subsidies for suburban expansion. The high level of spending on NYC health care, social services and housing, combined with continued high poverty and high housing costs in the city, has, over the years, raised questions about how much value has been received for the tax dollar. While employment data cannot answer those questions, it can provide some insights.
In Bureau of Labor Statistics private employment data, the activities covered by this post are classified as part of the Health Care and Social Assistance sector. In Census Bureau Governments Division data, these activities are classified as part of the Public Welfare, Public Hospitals and Housing and Community Development functions. Public health will be discussed, with other regulatory functions, in a later post.
The March 2014 Census Bureau data for state and local government employment is, once again, survey data and generally only reported at the state level, although individual unit data is always reported for the City of New York. Data for all local areas (most comparable at the county level) is available from the Census of Governments every five years, most recently in 2012. My post based on the Census of Governments for public employment and payroll data for health, social services and housing functions, from April 2014, is here.
The most recent spending data on New York’s Medicaid program, compared with other places, was presented in a series of posts starting with this one.
https://larrylittlefield.wordpress.com/2014/09/04/medicaid-by-state-in-2001-and-2011/
With data on Medicaid no longer being made publicly available by the Centers for Medicare and Medicaid, at least as of the date of this report, it may be a long wait for an update.
The Census Bureau’s “Public Welfare” function includes “employees engaged in all public welfare activities, including those involved in administration of public assistance programs as well as those providing direct assistance,” with public welfare programs identified as those with eligibility based on need. While not all those in need are the poor – the disabled and elderly can also qualify, although those better off may pay for their own care — differences in poverty are associated with greater expenditures and employment in this category. As I noted here:
Poverty Anywhere Leads To Poverty In New York City
In 2014 New York City’s poverty rate was 20.9%, about one-third higher than the U.S. average of 15.5%. Children have become increasingly likely to be poor, both nationally and locally, in recent decades, while senior citizens have become better off in the U.S. as a whole. New York City’s poverty rate for those ages 65 and over, however, was 19.3%, more than double the U.S. average of 9.5%.
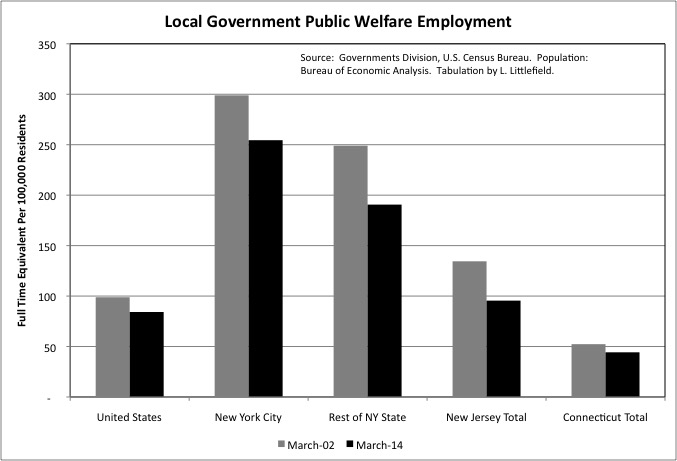
In March 2014 the City of New York had 254 full time equivalent local government workers in the Census Bureau’s Public Welfare function per 100,000 residents, including those working in agencies such as the Human Resources Administration, Department of Children’s Services, and Department of Homeless Services. That was down from 299 in March 2002, but still more than three times the U.S. local government average of just 84.
Local government public welfare employment also fell per 100,000 residents from March 2002 to March 2014 in the U.S. as a whole, the Rest of New York State, New Jersey and Connecticut. The decrease was about 15 percent in the U.S., New York City and Connecticut, but it was much steeper –23.5% — in the Rest of New York State and 29.0% in New Jersey. Even so, in the Rest of New York State local government public welfare employment was still more than double the U.S. average per 100,000 residents in March 2014, at 191. New Jersey was somewhat above average, and Connecticut far below.
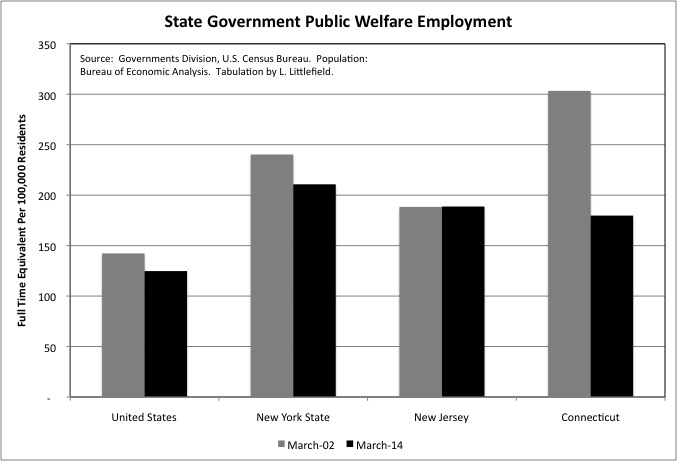
The administration of public welfare programs can take place at the state or local level. In many places, local governments are relatively uninvolved in this function, while in New York State the counties – and the City of New York – directly administer most public welfare programs. Even so, in March 2014 New York State had 211 state government employees in the Public Welfare function per 100,000 residents, down from 240 in March 2002 but still well above the U.S. average of 125. New Jersey and Connecticut state employment in the category was only slightly lower than New York’s, and also well above the U.S. average, but those states had less public welfare employment at the local level.
I have elected not to chart state employment in the smaller Social Insurance Administration function, which includes programs generally assigned to state departments of labor such as unemployment insurance and workers’ compensation. The number of full time equivalent state employees per 100,000 residents in this function in March 2014 was 24 for the U.S., 19 each for New Jersey and Connecticut, and 40 for the State of New York.
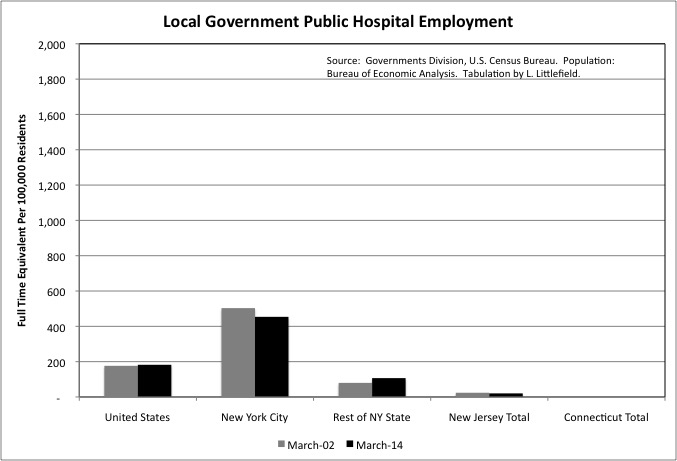
Public hospitals are more common in the southern U.S. than in the Northeast, where private, generally non-profit hospitals were well established before the first public hospitals were built. Connecticut doesn’t even have any local government public hospital employment, and New Jersey has almost none.
New York City, with its Health and Hospitals Corporation, is an exception. It had 454 full time equivalent local government hospital workers per 100,000 residents in March 2014, down from 503 due to a small decrease in employment and substantial population growth. The U.S. average was 182 employed per 100,000 residents in March 2014, up from 176 in March 2002. In the Rest of New York State, public hospital employment increased from 80 per 100,000 residents in March 2002 to 107 per 100,000 residents in March 2014. Nassau Medical Center and Westchester Medical Center are examples of local government hospitals outside New York City. In each case a privatization failed and was reversed.
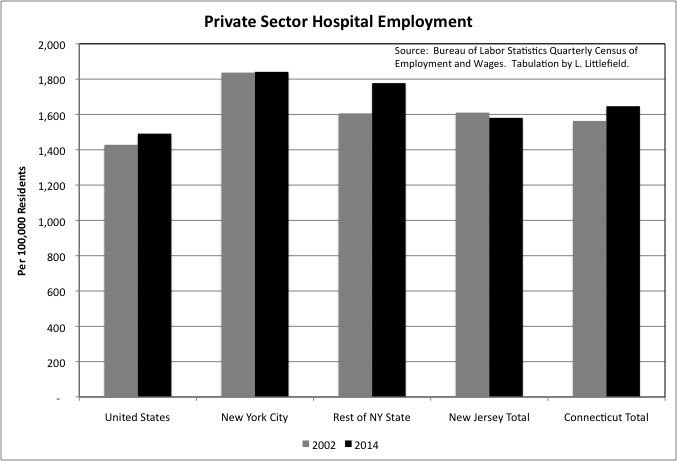
In many places with large public hospital systems, private hospital employment is commensurately smaller relative to population. That is not true in New York City, however. In 2014 NYC had 1,841 private hospital workers per 100,000 residents, well above the U.S. average of 1,491. Despite assertions of a hospital “crisis” due to the restructuring of the industry, moreover, NYC’s total private hospital employment kept up with the growth of the city’s population from 2002 to 2014, increasing from about 148,271 to about 156,342. So taking public and private hospital employment together, NYC’s hospital employment per 100,000 residents remains high.
One possible explanation is that to an extent New York City hospitals serve more than just New York City residents, with residents of the suburbs commuting in to take advantage of the high quality health care in the city. In 2014, however, private hospital employment was also above the U.S. average of 1,491 per 100,000 residents in the Rest of New York State, at 1,777, in New Jersey, at 1,581, and in Connecticut, at 1,647. Private hospital employment per 100,000 residents increased 4.4 percent in the U.S. from 2002 to 2014, and just 0.2 percent in New York City, but it was up 10.7% in the Rest of New York State. It fell 1.8% in New Jersey and increased 5.3% in Connecticut.
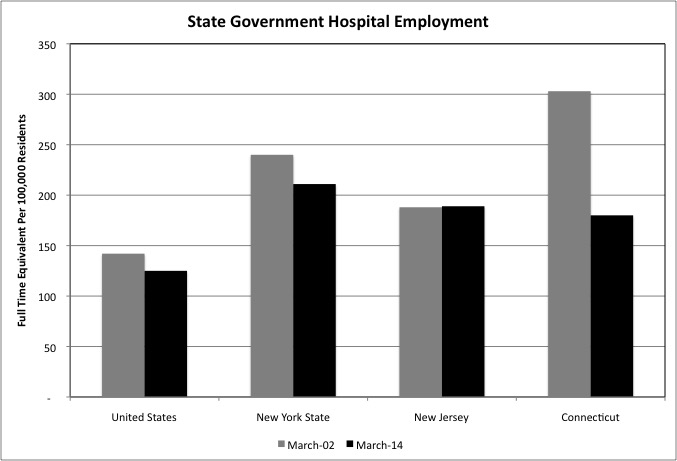
State hospitals generally have served the mentally ill, aside from teaching hospitals affiliated with state universities. New York has two such teaching hospitals affiliated with SUNY, one in Syracuse and one in Brooklyn. State hospitals, as mentioned in the prior post, account for the third most state government employment among functions, behind universities and prisons. With New York State historically having been among the most generous in caring for the mentally ill, its state hospital employment has always been relatively high.
New York’s state hospital employment fell from 240 per 100,000 residents in March 2002 to 211 per 100,000 residents in March 2014, still far higher than the U.S. average of 125 in the latter year. New Jersey, at 189, and Connecticut, at 180, were also above the U.S. average in state hospital employment per 100,000 residents. Connecticut’s employment in the category, however, had plunged from 303 in March 2002. Basically, Connecticut’s health and social service programs, along with other public services, are being gutted as a result of soaring public employee retirement costs.
As I noted in this post
https://larrylittlefield.wordpress.com/2014/09/18/medicaid-by-state-and-age-in-2001-and-2011/
New York State’s Medicaid spending per beneficiary is particularly high, relative to the U.S. average and nearby states, for those ages 65 and over. The impact of this can be seen in the relative level of employment per 100,000 residents in private sector industries serving the elderly and disabled.
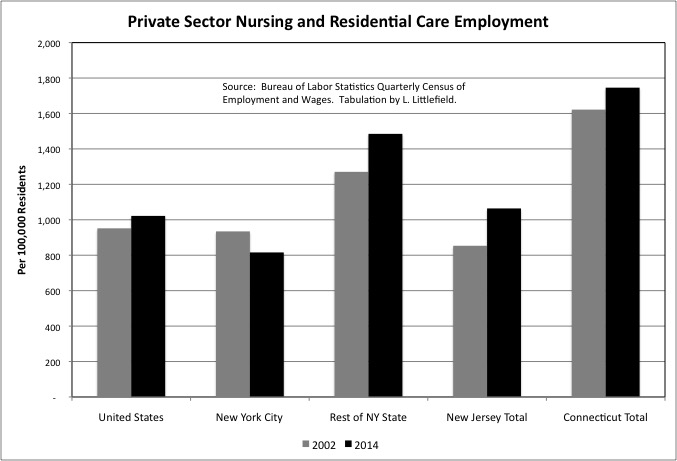
For the private sector Nursing Home and Residential Care industry, U.S. employment equaled 1,022 per 100,000 residents in 2013, up from 952 in 2002. New York City, however, went in the other direction as the city’s employment in this industry fell even as the overall population rose. Measured per 100,000 residents, it fell from 934 in 2002 to just 816 in 2014. In the Rest of New York State, Nursing Home and Residential Care employment increased from 1,271 per 100,000 residents in 2002 to 1,485 per 100,000 residents in 2014, well above the U.S. average. Like New York City’s hospitals, nursing homes elsewhere in the state may be serving non-locals. Under the state’s Medicaid program, if a New York City resident moves to a nursing home in Upstate New York, New York City is billed for the local share of the Medicaid cost.
Taking New York State as a whole, there were 1,197 Nursing Home and Residential Care employees per 100,000 workers, higher than the U.S. average of 1,022 but about the same as the 1,188 in New Jersey and the 1,191 in Connecticut.
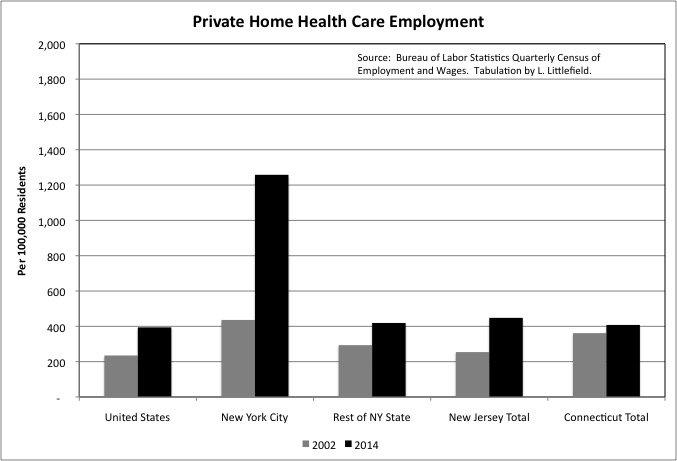
Where New York City really stands out is in the large number employed in the private Home Health Care industry. This industry employed 1,258 workers per 100,000 city residents in 2014, nearly tripling from 436 in 2002. The U.S. average was just 394, up from 235, and the Rest of New York State, New Jersey and Connecticut were all close to that average.
New York City’s high employment level in the Home Health Care industry reflects the city’s longstanding commitment to high public spending on seniors. High spending on seniors relative to other New Yorkers was established during the city’s darkest days from 1970 to 1995, a time when 70 percent of the city’s over 65 population was non-Hispanic white – those left behind in the city when their children moved to the suburbs – and 70 percent of the city’s school children were not non-Hispanic white.
Home Health Care was also designed to be a lower-cost, better quality alternative to nursing homes, but the large increase in NYC home health care employment relative to the small decrease in NYC nursing home employment calls this into question. In addition, the Home Health Care industry has been rife with fraud, with Medicaid billed for services to seniors not eligible for Medicaid, seniors not actually in need of services but willing to accept them, services not actually provided to seniors, home health care for seniors who did not exist, and home health care aides that provided services but did not have the proper training and certification. A quick trip to Google provides a couple of recent articles.
http://www.nytimes.com/2007/08/21/nyregion/21cuomo.html?_r=0
While home health aides are supposed to be trained to provide health care services, personal care aides provide shopping, cleaning, dressing, cooking and related services. Less than 20 year ago I found that New York State accounted for 90 percent of total U.S. Medicaid spending in the “Personal Care” category, although New York’s share has since dropped as other states start providing more services.
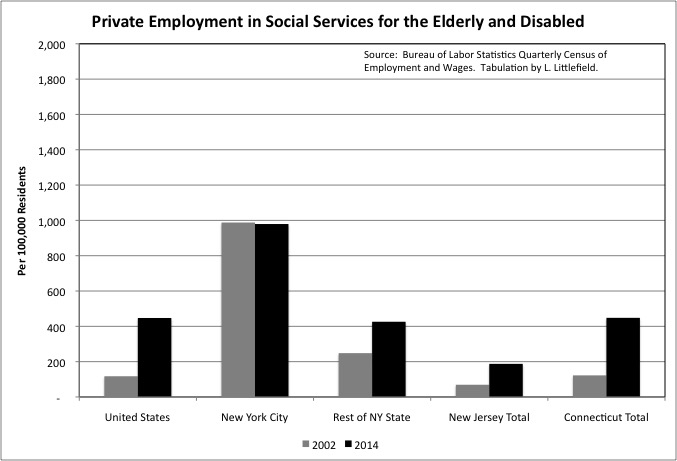
Personal care aides and similar private sector workers show up in the Services for the Elderly and Persons with Disabilities industry, part of the Social Assistance sector. It includes not only aides who work at the beneficiary’s home, but also senior centers and adult day care centers. New York City had 979 employed in this industry per 100,000 residents in 2014, down slightly from 988 in 2002 but still more than double the U.S. average of 447. The U.S. average, however, nearly quadrupled from 117 in 2002. The Rest of New York State and Connecticut are about average in employment in this industry, at 426 per 100,000 residents, up from 248, and 448 per 100,000 residents, up from 122. New Jersey, however, is low at 188, up from 69.
As is the case for home health care, New York City’s high employment in this category reflects both the city’s historically high generosity toward senior citizens, and the abuse of that generosity by scammers, many of whom are affiliated with members of the New York State legislature.
Adding up employment in the private Nursing and Residential Care Facilities, Home Health Care, and Services for the Elderly and Disabled industries, one finds the U.S. had 1,863 employed per 100,000 residents in 2014, up from 1,304 in 2002. New York City had 3,053, up from 2,358. New York City’s employment in these categories, relative to its population, was 80.9 percent higher than the U.S. average in 2002, and 63.9 percent higher in 2014. And with the city’s higher poverty rate among the elderly, the cost of these services was more likely to be paid for by the government – rather than the seniors themselves — in NYC. The Rest of New York State, at 2,330, and Connecticut, at 2,602, were also higher than the U.S. average of 1,863 in 2014, while New Jersey was lower at 1,700.

While public and private hospital employment, and home health care employment, are relatively high in New York City when measured per 100,000 residents, private sector employment in other heath care industries, when added together, is relatively low. These include the Offices of Physicians, the Offices of Dentists, the Offices of Other Health Practitioners, the Offices of Mental Health Practitioners, Outpatient Care Centers, and Medical and Diagnostic Laboratories.
New York City had 1,538 private sector employees in these industries per 100,000 residents in 2014, up from 1,207 in 2002 but still below the U.S. average of 1,682. The Rest of New York State was about average at 1,684 in 2014, while New Jersey and Connecticut were high at 1,926 and 2,011 respectively. Note that these are wage and salary employees, and many medical practitioners are self-employed in their own practice and not counted here (though their nurses and aides are). In all the areas mentioned, other heath care employment per 100,000 residents increased 20.0% to 30.0% from 2002 to 2014, one reason health care costs continue to rise.
Adding up private employment in the Heath Care sector, excluding home health care and nursing and residential care but including both hospitals and other ambulatory care, there were 3,380 private employees in New York City per 100,000 residents, somewhat higher than the U.S. average of 3,173. NYC’s high public hospital employment would be on top of that small difference. The similar 2014 private health care employment totals were 3,461 in the Rest of New York State, 3,507 in New Jersey, and 3,658 in Connecticut.
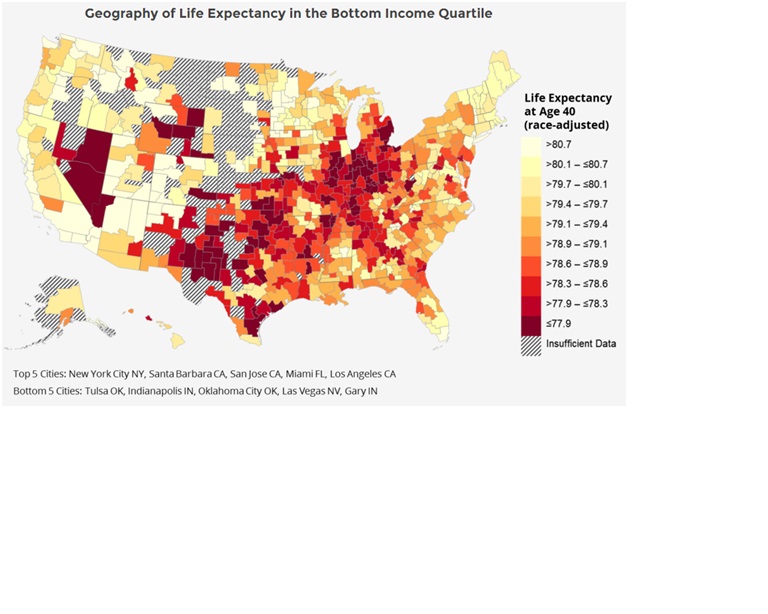
One could make the case that New York, New Jersey and Connecticut are getting their money’s worth. According to a recent study those in the bottom 20 percent of the income distribution, all of whom would be living in poverty in NYC, those living in NYC had the highest life expectancy in the country at age 40. With the east and west coasts faring well by this measure, compared with the areas in the middle.
http://www.marketwatch.com/story/low-income-americans-live-longer-in-these-cities-2016-04-12
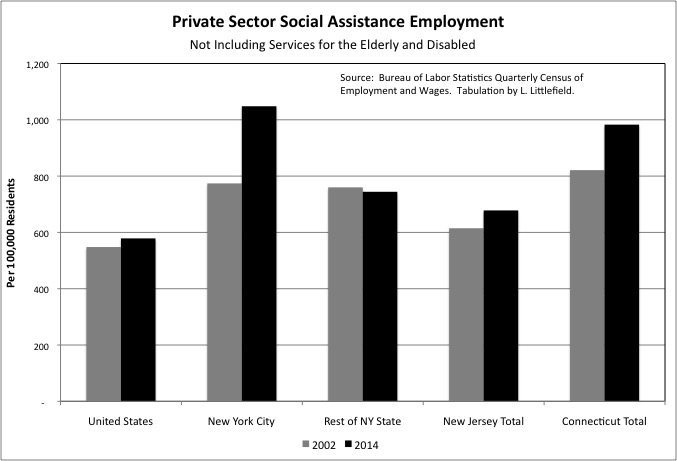
New York City’s private Social Assistance employment outside the Services for the Elderly and Disabled industry was also high in 2014. The industries included here are Child and Youth Services, Other Individual and Family Services, Community Food Services, Temporary Shelters, Other Community Housing Services, Emergency and Other Relief Services, Vocational Rehabilitation Services, and Child Day Care Services. As is the case for private health care, the payment and funding for these services may be private (mostly in the case of child care), taxpayer or charitable. And the workers included in the data are employees, not those who are self-employed.
For these industries combined, New York City had 1,048 private sector employees per 100,000 residents in 2014, up from 774 in 2002 and well above the U.S. average of 579. The Rest of New York State, at 774, and New Jersey, at 678 were also far lower than NYC. Connecticut, however, was almost as high at 983. For anyone who wants to examine these and other private sector industries that rely on government data in more detail, the raw data is available in this spreadsheet.
Covered Employment Gov-Related-14
New York City’s employment is not only higher per 100,000 residents in these Social Assistance categories, but it is rising more rapidly. From 2002 to 2014 the increase was 35.4 percent for NYC, 5.6 percent for the U.S., 10.3 percent for New Jersey, and 19.7 percent for Connecticut. In the Rest of New York State there was a 2.1% decrease. As is the case for Health Care, there is some indication that NYC gets some value from its high Social Assistance employment, and funding. NYC’s suicide rate is well below the U.S. average, and has been for decades.
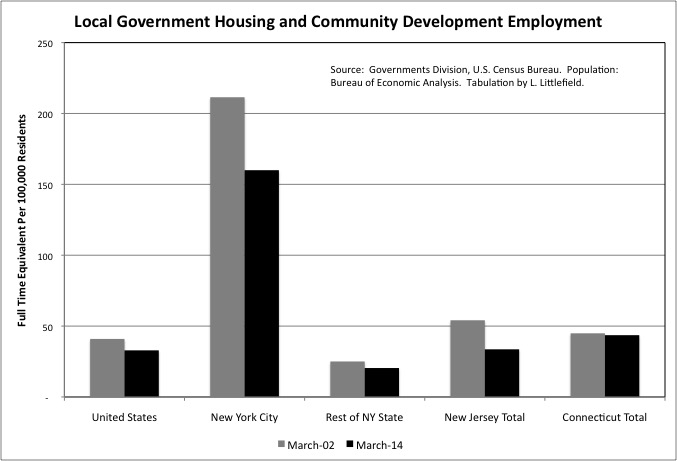
Most of the United States has very little if any public housing, but New York City’s Housing Authority is reportedly home to about 600,000. In addition to its once exclusively funded Housing Authority, which also administers Section 8 vouchers for rent assistance in private housing, New York City has an additional housing agency, the Department of Housing Preservation and Development. This agency is funded by the City and State of New York, and while it was started to manage and subsidize the reuse of NYC’s vacant buildings and lots, it has continued in existence even after private sector housing development returned to nearly the entire city.
Adding it up, New York City had 160 local government workers in the Census Bureau’s Housing and Community Development function in March 2014, down from 211 in March 2002 but many times the U.S. average of just 33. The Rest of New York State, New Jersey, and Connecticut were about average in the category.
Public housing is generally considered a disaster in the United States, for the reasons shown in a recent HBO series on my hometown of Yonkers.
http://www.hbo.com/show-me-a-hero
(If you’ve seen the show, I was a child on the west side, up the hill from City Hall, near the water tower).
Virtually no public housing has been built in the U.S. since 1980, and much has been torn down. In crisis as federal funding keeps getting taken away and its buildings age, the secretive New York City Housing Authority is nonetheless considered perhaps the best in the country. The problems of public housing are so acute that one of the few things I believe one of my favorite movies, “Los Angeles Plays Itself,” got wrong is the assertion that deciding not to any build public housing was a disaster for that city.
The person who made the film was a film professor, not a city planner, though he otherwise did quite the job.
The juxtaposition of high housing prices and extensive local government intervention in the housing market in New York City have allowed some to conclude that it is the very intervention that is responsible for the city’s unaffordability. But other cities that have abandoned intervention in multifamily housing and liberalized the market instead, but have other characteristics similar to New York, are also unaffordable, as I wrote here.
As unaffordable as it seems to be, New York City not only has accommodated a large poverty population, but that poverty population is increasing, much to my surprise, as poor people from elsewhere continue to move in. Perhaps reducing or eliminating poverty is not a reasonable goal at the local level, particularly when combined with the contradictory goal of having many places for poor people to live in the city. Perhaps a more reasonable goal is to improve the way poor people live. With the exception of education, and though at great cost, the City of New York may be doing relatively well in achieving that goal.