
As I noted in my prior post,
The American Community Survey: Economic Changes from 2005 to 2015
the business cycle, with expansions and recessions, means that comparisons over time for data items such as work earnings and income are only meaningful if one compares economically similar years. The press reports an increase in inflation-adjusted work earnings from 2014 to 2015, but that is merely what should be expected in an economic upturn. A comparison between 2005 and 2015, on the other hand, shows falling median earnings over the business cycle. As a follow up, with economic trends for U.S. men compared with women, and less educated workers compared with more highly educated workers, an issue in the Presidential election, I downloaded some additional American Community Survey work earnings data to see that the actual situation is – in the U.S., NYC, and nearby areas.
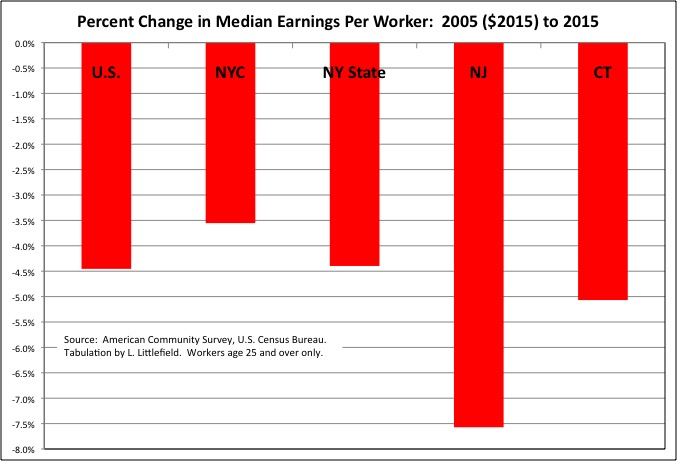
In my prior post, I found that when 2005 (adjusted for inflation into 2015 dollars) is compared with 2015, a similar year with regard to the business cycle, one finds that the inflation-adjusted median work earnings of workers has fallen – by 5.2% for the U.S., 4.8% for New York City, a stunning 8.8% in New Jersey, 6.8% in Connecticut — and 5.4% for New York State as a whole. (I can’t calculate a median for the “Rest of New York State,” but given that the drop in the state as a whole is much higher than the drop for NYC, clearly the drop for the portion of NY State outside NYC is higher still).
That data was from table DP03, Selected Economic Characteristics, and was for all workers. The data to follow is from tabulations of median earnings by educational attainment, and only includes workers age 25 and older. The data I downloaded to produce the following charts is here.
In each case the data is for workers by place of residence: the New York City data is for workers who live in the city, not for those who work in the city, many of whom commute in from the suburbs. And it includes not only wage and salary workers but also self-employed workers: business owners and partners, freelance workers, contract workers, informal day laborers who answered the survey.
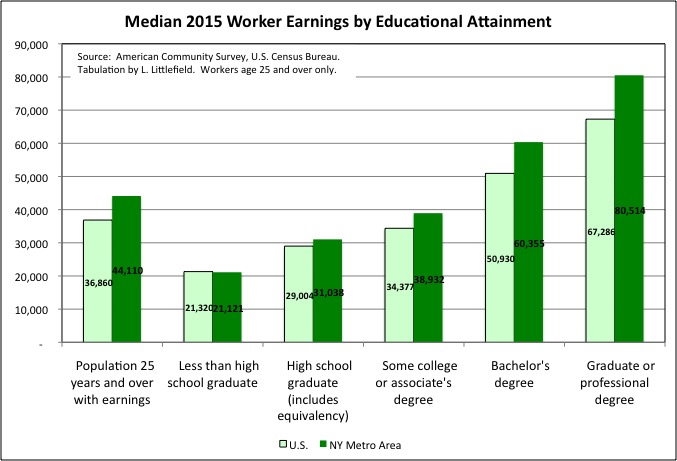
Based on the Census Bureau’s median work earnings by educational attainment cross-tabulation, one finds that as expected the median annual work earnings of workers with higher educational attainment is higher than that median annual work earnings of workers with lower educational attainment. And the median annual work earnings of those living in metro New York in 2015, at $44,110 according to American Community Survey data, was higher than the U.S. average, at $36,110. But the extent to which metro area workers earn more than the U.S. average varies by the extent of their schooling.
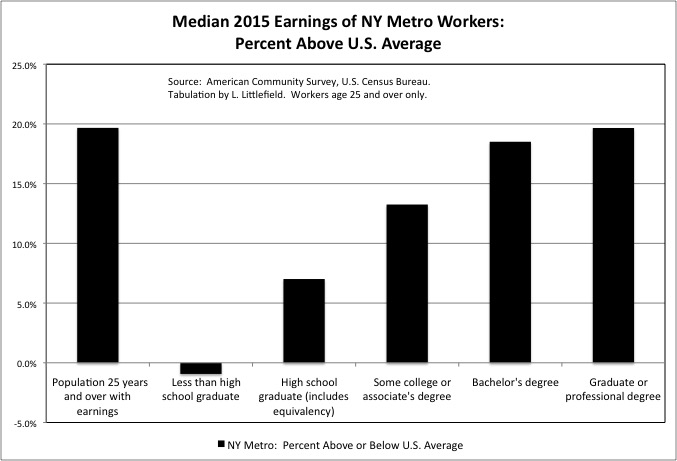
Overall, the median NY metro area worker earned 19.7% more than the U.S. average in 2015. But among those with less than a high school diploma, the median earnings in metro New York was actually less than the U.S. average by $21,121 to $21,320. For those with a high school diploma alone, the median for metro New York residents was just 7.0% higher than the U.S. average, at $3,1028 to $29,004. For those with some college or an associate’s degree, the median for metro New York was 13.3% higher at $38,932 to $34,377. For college graduates, the median for metro New York was 18.5% higher at $60,355 to $50,390. And for those with graduate degrees, metro the median for New York was higher at 19.7% higher at $80,514 to $67,286.
How can the median earnings for all workers living in metro New York be 19.7% higher than the U.S. average, when the median for every educational category other than those with graduate degrees is higher by less than that? Because a higher share of workers living in metro New York, relative to the U.S, are in the higher educational categories. Metro New Yorkers earn more that other Americans, on average, in part simply because they are more highly educated, not just because they live in Metro New York. And given the high cost of living in metro New York those with the less education, and earning less or barely more than they would elsewhere, will clearly struggle.
Recall that the median is the middle worker if they are ranked in order, not what is usually referred to as the “average,” namely the mean. The mean would be a little higher, because of the concentration of workers at the top. And this is the median for all workers, including those who only worked part of the year or part time. The median for full-time, year-round workers would be somewhat higher.
Still, for comparison with, for example, the relative pay levels of public employees, it is fair to say that the typical worker earnings in metro New York is 20.0% higher than the U.S. average. The typical adjustment to I make to NYC local government pay and spending, using mean payroll per worker for those working in Downstate New York’s private sector excluding the Finance and Insurance sector as the factor, came in at 26.4% higher than the U.S. average for 2014.
Because metro area boundaries change with each decennial census, I can’t compare the median earnings of NY metro area workers for 2015 with 2005. So instead I make that comparison for the U.S., New York City, New York State, New Jersey and Connecticut.
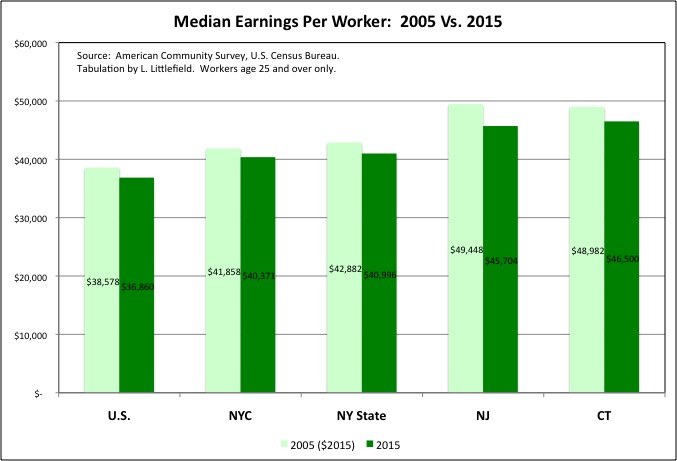
The data show that when adjusted for inflation the median earnings of workers fell in each of those areas from 2005 to 2015. Based on the business cycle alone one might have expected median earnings to be higher in 2015, five years after the bottom of the Great Recession in 2010, than in 2005, just three years after the previous recession hit bottom in 2002. But the reverse it true – median earnings were higher in 2005 than in 2015. One expects median earnings to rise in booms, and fall in busts. But this data shows that median earnings fell over a cycle.
There was no between-census American Community Survey prior to 2005, but based on other data I have seen (Current Population Survey, Survey of Income and Program Participation) or read about in the media, the trend of falling earnings per worker goes back much farther. With the median earnings at the peak of the most recent cycle in 2007 lower than in the census year of 2000, the peak of the cycle before. And the median earnings in 2010, the low point of the most recent cycle lower than in 2002, the prior low point. In fact I believe that median earnings were lower in 2005 than in 1995, lower in 1995 than in 1985, and perhaps even lower in 1985 than in 1975, though in the latter case I’m not as sure.
The median earnings of workers living in New York City fell 3.6%, adjusted for inflation, from 2005 to 2015 – from $41,858 to $40,371. That was actually a relatively strong performance for those ten years, as it has been for NYC based on other economic data as well. The decrease for New York State as a whole was 4.4%, from $42,882 to $40,996. The U.S. decrease was 4.5%, from $38,578 to $36,860.
I can’t calculate a median for the “Rest of New York State” as I could with a mean, but since the median earnings for NYC residents fell by less than the statewide average, one can assume that the median earnings for the Downstate suburbs and Upstate NY fell by more than the statewide average. After all New Jersey and Connecticut took bigger hits than NYC, with the median earnings of Connecticut workers falling 5.1% to $46,500 and the median for New Jersey workers down a stunning 7.6% to $45,704.
There were many workers who lost their jobs in the Great Recession who ended up taking jobs for far less thereafter. But a decrease in median earnings doesn’t have to be caused by the earnings of individual workers going down. It can also be caused by a generational shift.
The generations born between 1930 and 1957 or so, the so-called Silent Generation and the first half of the Baby Boom, were the richest in U.S. history at each point in their lives. Working in 2005, many were retired by 2015. Those workers in the generation to follow, who had moved into the pre-retirement years by 2015, likely had lower earnings than those who were at that same point in their lives in 2005. And those entering the labor force in 2015, as well, were likely worse off that those who entered the labor force in 2005, who were in turn worse off than those entering the labor force in 1995, etc.
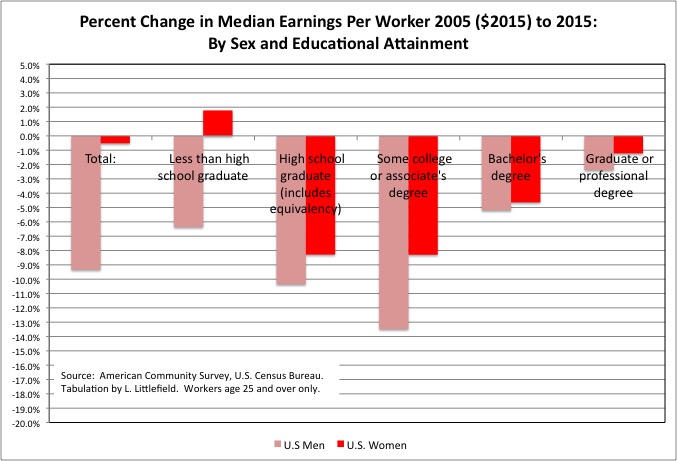
Looking at data for the U.S. as a whole, the median earnings of male workers did fall much more sharply than the median income of female workers. The median earnings of male workers fell a stunning 9.3% from 2005 to 2015, while the median earnings of female workers fell just 0.5%.
The only reason things weren’t worse for working females, however, was their average education attainment was higher in 2015 than it had been in 2005. When you look at each education level individually, the median earnings of females generally fell nearly as much as those of men. The exception was workers without high school diplomas. While the median earnings of U.S. men in this category fell 6.4%, to $25,159, the median earnings of women actually increased 1.8%, to albeit to just $16,151. Perhaps because they worked more hours on average in 2015 than they had in 2005.
Among U.S. workers with a high school diploma, median earnings were 10.3% lower in 2015 than in 2005 for men, and 8.3% lower for women. For those with some college or an associate’s degree, median earnings were 13.5% lower for men and 8.3% lower for women. For those with a college degree, it was 5.2% lower for men and 4.6% lower for women. And for those with graduate degrees, it was 2.4% lower for men and 1.2% lower for women.
Let me rehash earnings history as I have come to understand from other sources. Starting with the back-end of the Baby Boom, each generation of Americans has been paid less than the one before, adjusted for where they are in their lifecycle. The negative trend worked its way up the educational ladder, starting with high school dropouts after 1973, the year median wages for males peaked in this country, and moving on to high school graduates in the 1980s, after the “deindustrialization” recession early in that decade, and college graduates in the 1990s, after the early 1990s recession that was the first to really affect them. In the 1990s only those with graduate degrees were getting ahead, and by the 2000s it was just the “one percent.” But since the financial crisis only the .01 percent has been getting ahead, and perhaps soon not even them.
The data for 2005 to 2015 shows that even among those with graduate degrees median earnings are falling, as I would have expected. But it also shows that the median earnings of less-educated workers, which has been falling longer, is still falling faster.
Moreover the situation of U.S. women is kind of like the situation of workers in the first half of the Baby Boom, the 1960s generation, in general. Like the generations to precede them, they have been richer on average at each point in their lives than the generation before. But the Federal Reserve Bank of St. Louis has found that if you adjust for educational attainment the early boomers – like the generations to follow – in fact earned less than the richest generation – the Silent Generation born 1930 to 1946. It was only their higher educational attainment that allowed the early Boomers to get ahead. By the time of the late Boomers even that was not enough.
The same may be said of U.S. women. Their rising educational attainment and expansion into different occupations may have once insulated them from the trend of falling earnings experienced by men. But from 2005 to 2015 that was no longer the case, albeit with a mere 0.5% median earnings decrease for women during the decade.
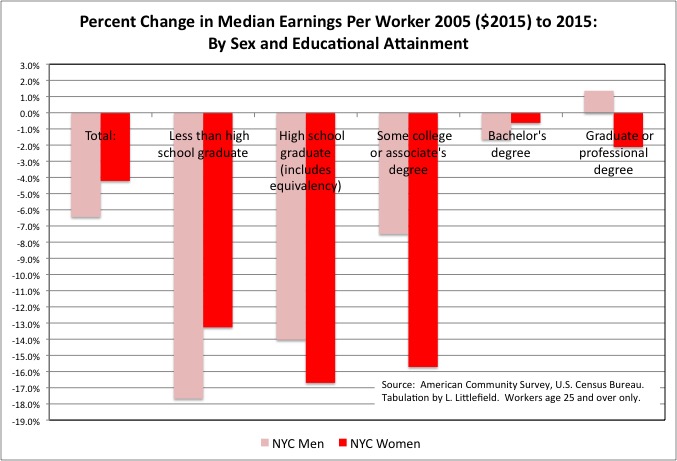
Women fared even worse in New York City that the U.S. average, perhaps because so many have been pouring into the city and competing wages down. The median earnings per worker for city residents fell 6.4% from 2005 to 2015 for men, to $42,453, and 4.2% for women, to $36,426.
For those with lower educational attainment, the NYC decreases in median earnings are huge. By 17.7% for men and 13.3% for women for those with less than a high school diploma. By 14.0% for men and 16.7% for women for high school graduates. By 7.5% for men and 15.7% for women for those with some college or an associates degree.
On the other hand, those with higher educational attainment lost less in earnings in NYC that the U.S. average, perhaps explaining why so many educated young people continued to come here despite soaring rents. The inflation-adjusted decrease from 2005 to 2015 was 1.7% for men and 0.6% for women for those with college degrees. NYC women with graduate degrees had a 2.1% decrease in median earnings, but men with that level of education managed a 1.4% increase.
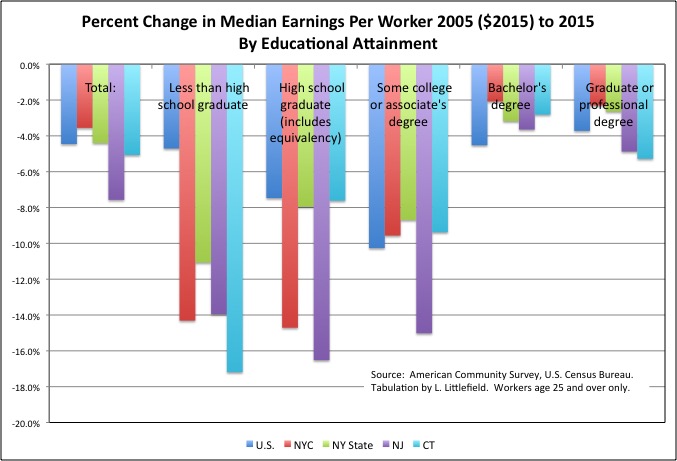
The trend of very large decreases in inflation-adjusted earnings from 2005 to 2015 for those with an associate’s degree or less, with decreases generally of 8.0% or more, was also present in New York State as a whole, New Jersey, and Connecticut. Those with college degrees and graduate degrees generally saw their median earnings fall by 5.0% or less – not by as much, but also not what people expected when they pursued and paid for higher education.
New Jersey and Connecticut stand out for the larger decreases in median earnings for their residents with graduate degrees – by 4.9% and 5.3% respectively. That is not a cyclical decline, from an economic peak to a bottom. That is an over-the-cycle, structural decline. No wonder state income tax revenues have been weak in those states, and a fiscal crisis is ongoing.
Unless there was a shift in people’s honesty in answering work earnings questions between 2005 to 2015, this data shows a massive decrease in people’s inflation-adjusted work earnings over a cycle. Perhaps when a smaller decrease happened in the cycle before that and the cycle before that, people forgot their anger when they benefited from a short-term income gain as the economy recovered. Not this time, according to what is going on in the election.
Given that the U.S. economy was for 30 years characterized by soaring debt for consumption, moreover, the decrease in work earnings underestimates the decrease in spending power and the standard of living.
http://www.bloomberg.com/news/articles/2016-04-01/the-credit-collapse-opened-the-door-for-trump-and-sanders
Even better off, more highly-educated workers who have suffered smaller decreases in work earnings over a shorter period of time may be trapped into poverty in old age by their own high spending and inadequate savings. After having spent more, they face having to spend rest the rest of their lives.
https://www.bloomberg.com/view/articles/2016-07-19/why-trump-s-prosperous-supporters-are-angry-too
Despite the fact that the workers who support them are falling further and further behind inflation the richest generations in U.S. history, those now in or close to retirement, resent the fact that their Social Security income is merely keeping up with inflation.
http://bit.ly/2ecvaj9
COLAs have flat – lined at unprecedented lows over the past 7 years, averaging just 1.2 percent a year. That’s less than half the 3 percent that COLAs averaged from 2000 to 2009.
Because inflation has been lower.
“Unfortunately this financial impact is not fully understood by the vast majority of the public and Members of Congress — The Senior Citizens League is working to change that.”
The vast majority of the working American public, however, is heading for a 25.0% cut in Social Security benefits in 2030, as a result of the debts and inadequate savings richer generations have bequeathed to them collectively. That is on top of the fact that on average their benefits would have been lower anyway, because they earned less while working.
Look beyond the business cycle, look beyond the political rhetoric, and this is the reality. Why are U.S. businesses not investing? “Uncertainty?” “Regulations?” “Taxes?” How about certainty. Who are they going to sell to? The market is shrinking as people with lower incomes are forced to pay off the debts from Generation Greed’s party.
While lower, the work earnings of U.S. workers are not low by global or historical standards. While down from its prior unsustainable level, the standard of living those earnings could buy would have been perfectly respectable and middle class 40 or 50 years ago. The problem is in part psychological, and spiritual. What seems to matter most to people is that younger generations are poorer than their parents, on average, and many older people are poorer than they once were. Those older don’t want to face their role in this. Those younger don’t see a positive future.
Unemployment is low, inflation is low, and in the short term wages are rising. But you can’t ignore the fact that the U.S. standard of living is down, big time, after decades of the advertising industry programming Americans to believe they had to spend more and more and more just to be considered middle class rather than poor.