
Perhaps the most important reason that New York’s state and local tax burden is so high, as discussed here,
https://larrylittlefield.wordpress.com/2015/04/14/taxes-2012-census-of-governments-finance-data/
is that its public school spending is high as well. High not only per student, but also per $1,000 of state residents’ income, the income they must use to pay for those public schools. High not only compared with the U.S. average but also with adjacent states in the Northeast. High not only in affluent suburbs, but also just about elsewhere in the state.
The U.S. averaged $40.76 in elementary and secondary school spending per $1,000 of personal income in FY 2012, according to the Census of Governments from the U.S. Census Bureau. The New York State average was $52.38 psf, which ranked fourth even though New York City’s teacher pension contributions, which are considerable, are excluded from the calculation. The states with higher spending as a share of their residents’ income were Alaska and Wyoming, where high spending is funded by oil, gas and mineral extraction taxes rather than other businesses and residents, and (barely) Vermont. The teachers’ union calls New York State’s schools “underfunded.” That means that if any of the other states decided to fund a huge school spending increase funded by big tax increase, like New York City over the past 15 years, it would still face claims that the schools had limited obligations because spending wasn’t high enough.
Let’s start with some housekeeping. A spreadsheet with Census of Governments local government education finance data for all U.S. states (the “Education All State” tab on the bottom) and all New York and New Jersey counties (and selected counties elsewhere) (the “Education All County” tab) is here:
Spreadsheets with the overall Census of Governments finance data, with notes on how it was compiled, are in this post.
https://larrylittlefield.wordpress.com/2015/04/12/background-and-databases-2012-census-of-governments-state-and-local-finance-data/
A post analyzing education using Census of Governments employment phase data for FY 2012 is here.
https://larrylittlefield.wordpress.com/2014/04/15/public-schools-2012-census-of-governments-employment-and-payroll-data/
And the separate data the Bureau compiles specifically on public elementary and secondary schools, which more accurately accounts for the cost of pensions and other employee benefits, was analyzed for 2012 here:
https://larrylittlefield.wordpress.com/2014/06/01/new-yorks-sky-high-public-school-spending/
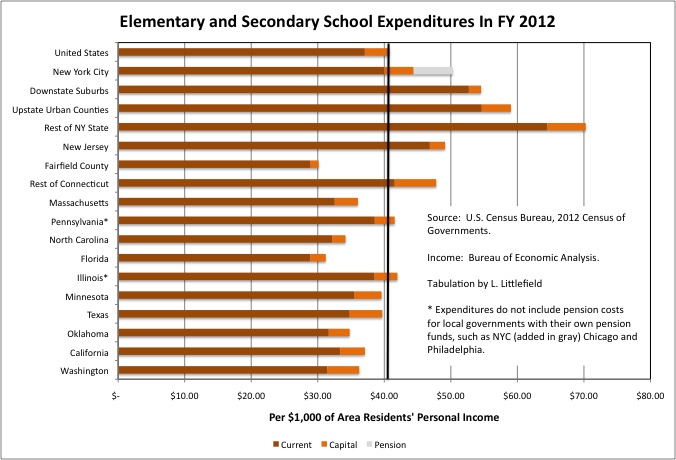
According to the 2012 Census of Governments finance data, total spending on public elementary and secondary schools averaged $40.76 per $1,000 of residents’ personal income in the U.S., $54.55 in the Downstate Suburban counties of New York State, $59.03 In the Upstate Urban counties and a whopping $70.71 in the primarily rural and small town rest of New York State. The figure for New York City was $44.41 psf, but that does not include its pension contributions, because the finance phase of the Census of Governments considers such payments “internal transfers.” With pension contributions included, the NYC figure would be $50.29.
Expressed as a percentage, this shows that about 4.1% of the income of all U.S. residents was collected in taxes and other revenues and spent on public schools in FY 2012, compared with 5.0% for New York City, 5.5% for the Downstate Suburbs, 5.9% in the Upstate Urban Counties and 7.1% in the rest of New York State.
Since public education is the largest component of state and local government spending, taxes have to be high as a share of income too. At the local level schools may be funded by state taxes collected elsewhere. Assuming the level of state aid is not affected by the level of spending, however, NYC residents are paying 1.0% of their income more than the national average in local taxes for schools, residents of the Downstate Suburbs are paying 1.4% extra, those in the Upstate Urban counties are paying 1.8% extra, and those in the rest of the state are paying 3.0% extra. Recall from the prior post on taxes that residents of NYC paid 5.7% of their income more than the U.S. average in state and local taxes in FY 2012, with the Downstate Suburbs at 3.9% above average, the Upstate Urban Counties at 2.4%, and the Rest of New York State at 3.0%.
Elementary and secondary school spending is a much lower share of personal income in virtually all other states, including those of the Northeast. New Jersey, at $49.13 in public school spending per $1,000 of state residents’ personal income, and the portion of Connecticut outside of high income Fairfield County, at $47.80, come closest to New York. Massachusetts at $36.06 and Pennsylvania at $41.56 are more typical.

Using the other Census Bureau source on public education finances confirms that spending is high as a share of local residents’ personal income in all parts of New York State. This source properly includes all employee benefits data, and shows elementary and secondary school spending at $43.63 per $1,000 of personal income in the U.S., $52.26 in New York City, $56.04 in the Downstate Suburbs, $60.81 in Upstate Urban counties, and $72.63 in the rest of New York State. New York City’s spending was about the same as in the Downstate Suburbs and New Jersey (at $54.26), and far higher than in Connecticut ($45.27) and Massachusetts ($41.65).
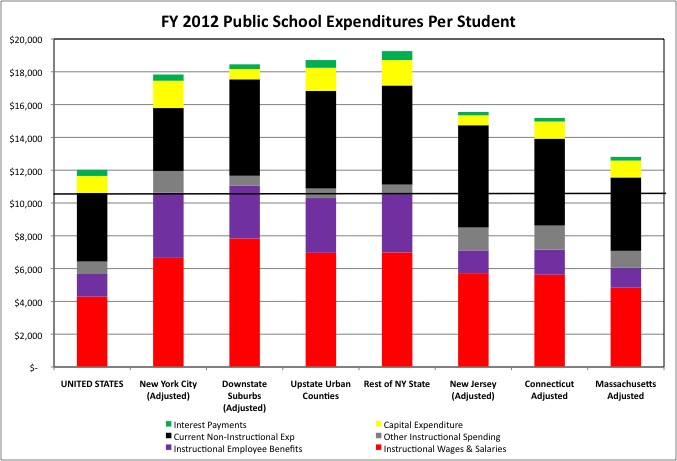
Again using the public education finances data, recall that since so many NYC parents move to the suburbs when their children reach school age, and so many enroll their children in private school, New York City’s spending is even higher compared with other places when measured per student. Even when the city’s per student spending is reduced to account for the higher average wage and cost of living here. One might say that the low quality of the city’s schools, and the large number of childless young adults working and paying taxes, is the only reason the city can afford them.
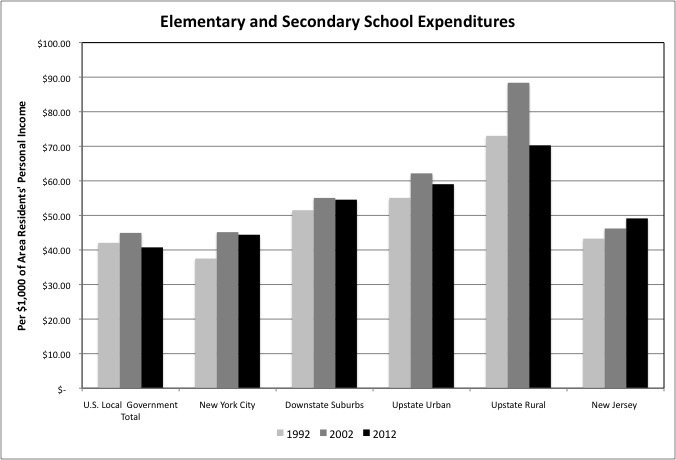
Returning to the Census of Governments, in general elementary and secondary school expenditures increased relative to personal income from 1992 to 2002, and then fell from 2002 to 2012. At the national level the increase was from $42.07 in spending per $1,000 of personal income in FY 1992 to $44.94 in 2002, with a subsequent decrease to $40.76 in 2012. Elementary and secondary school spending was thus lower per $1,000 of U.S. residents’ personal income in FY 2012 than it had been In FY 1992. For New York City (excluding pensions), the Downstate Suburbs, and Upstate Urban counties, the decrease from FY 2002 to FY 2012 was much smaller, and the FY 2012 spending levels as a share of area residents’ incomes were higher than in FY 1992. In New Jersey public school spending continued to increase through 2012.
The main reason for the increase and then decrease in school spending is demographic. The school-age population increased and then fell as a percent of the population as the large “baby boom echo” generation entered and left school.
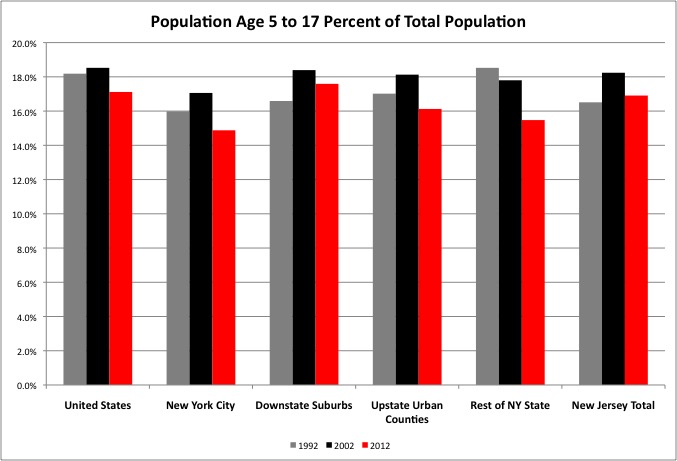
With falling enrollment, one might expect public funds to shift from the schools to other priorities. The huge increase and decrease in spending in rural parts of Upstate New York was also driven by a public school construction binge, generally funded by state money during the Pataki Administration, around 2002.
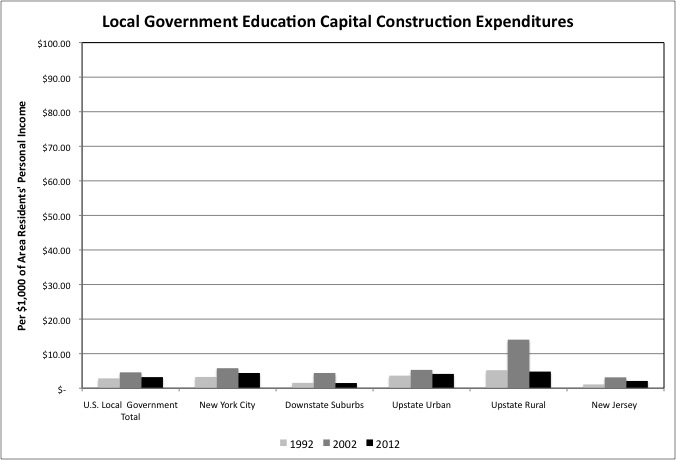
Although school spending remains high as a share of local residents’ income in rural and small town New York, falling enrollment and an end to that construction binge have led to a big drop in spending as a share of income there. Unfortunately, state-funded school spending is as much a job program as an education system in the part of New York outside New York City, which explains some of the backlash over “low” spending.
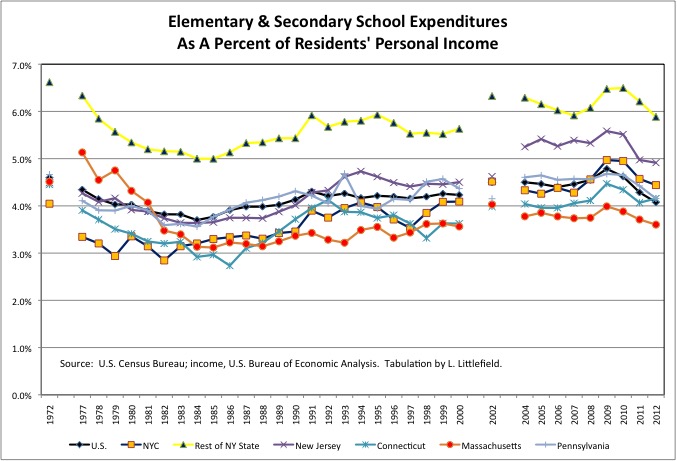
Measured year-by-year, public elementary and secondary school spending has been very high as a percent of personal income in the portion of New York State outside New York City for decades. Far higher not only than the U.S. average, but also than the averages for Massachusetts, Connecticut and New Jersey.
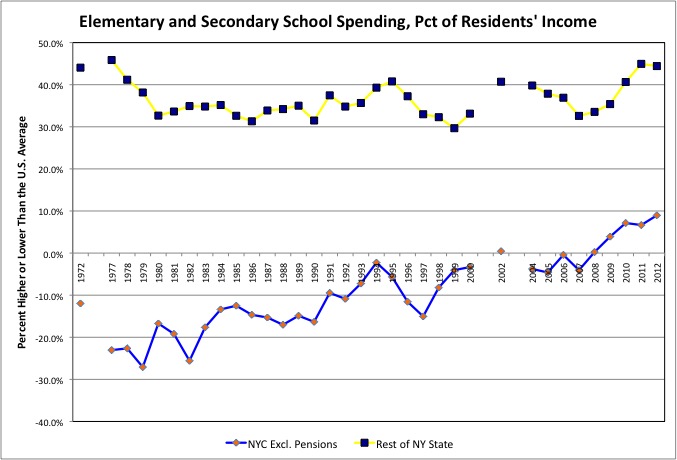
Excluding pension costs, New York City’s public school spending was below the U.S. average — often far below — as a percent of city residents income for decades. Despite high taxes. Until it soared after the year 2000.
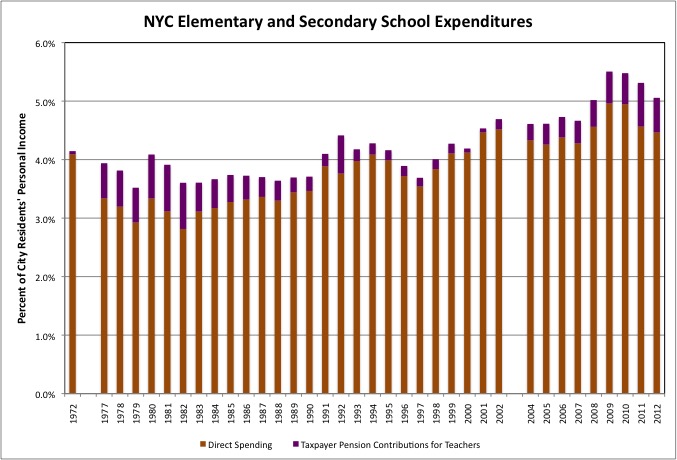
Data on taxpayer contributions to the NYC teacher pension fund are available in another Census Bureau database, one specifically on pensions. After pensions were retroactively increased in the late 1960s and pension costs soared, one can see rising pension costs squeezing out classroom spending between 1972 and 1980 when measured as a percent of city residents’ personal income. Since the income of city residents was also plunging during the 1970s, that was a double-barrel hit to money available for the classroom.
By the late 1980s pension costs had fallen and classroom spending had risen, only to have additional retroactive pension increases for teachers cause pension costs to soar again. This time, however, the income of city residents has not yet plunged, as an increasing population has offset falling inflation-adjusted earnings per worker. For now classroom spending remains high despite falling enrollment and soaring payments to the early retired.
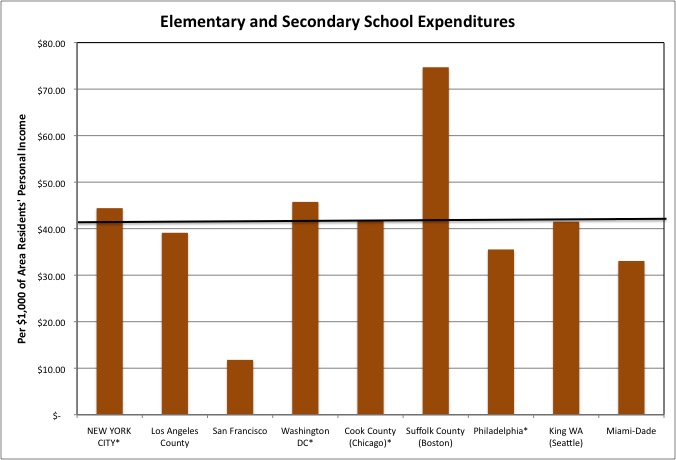
For most major urban counties, a public school spending level in close proximity to U.S. average as a percent of local residents’ incomes, as in New York City, seems to be typical. Having relatively few children compared with the total population is also characteristic of older central cities. In San Francisco, there are virtually no children left, and Boston’s public school population never recovered after plunging in the 1970s. Note that the data for Philadelphia and Cook Counties excludes pension contributions by the cities of Philadelphia and Chicago, because like New York they have their own pension fund for teachers.
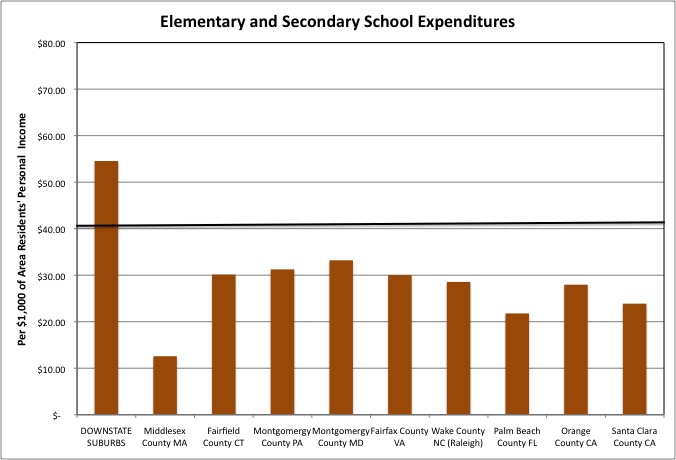
Affluent suburban counties generally have low elementary and secondary school expenditures per $1,000 of their residents’ personal income, because that income is so high. But not Nassau, Suffolk, Westchester, Rockland and Putnam, the Downstate New York suburbs. While Westchester is moderate at $44.98 spent on schools per $1,000 of county residents’ personal income, spending in the rest of those counties is quite high. Note that although spending is lower in the affluent suburban counties of northern New Jersey, at $37.66 per $1,000 of personal income in Bergen County for example, that also does not include taxpayer contributions for teacher pensions, which are made (or not made) by the State of New Jersey.
The suburban counties included in this chart are aspirational, and include some booming areas such as the part of the Triangle in North Carolina, Fairfax County in Virginia, and Santa Clara County in California, the Silicon Valley. Public school spending is lower there. Almost all these counties are thought to have good schools, and yet their elementary and secondary school spending (excluding the outlier of $12.58 in Middlesex in Massachusetts) varies between $21.78 and $33.20 per $1,000 of their residents’ personal income, compared with the average of $54.55 for New York’s Downstate Suburbs.
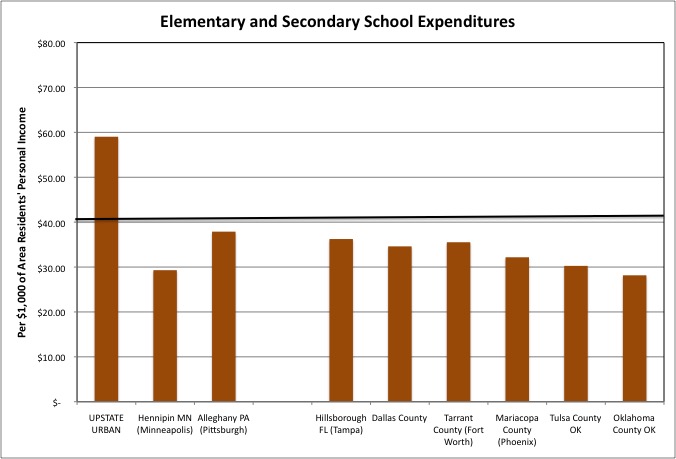
The Upstate Urban counties — Albany, Broome (Binghamton), Dutchess, Erie (Buffalo), Monroe (Rochester), Niagara, Oneida (Utica), Onondaga (Syracuse), Orange, Rensselaer (Troy), Saratoga and Schenectady – also have very high public school spending per $1,000 of their residents’ personal income. High compared with other Rustbelt counties with recovering post-industrial economies, such as Hennipin (Minneapolis) and Alleghany (Pittsburgh). And high compared with Sunbelt counties with growing back office and industrial employment. Elementary and secondary school spending in a sampling of these counties varies between $28.16 and $37.89 per $1,000 of their residents’ personal income, compared with $59.03 on average for New York’s Upstate Urban Counties.
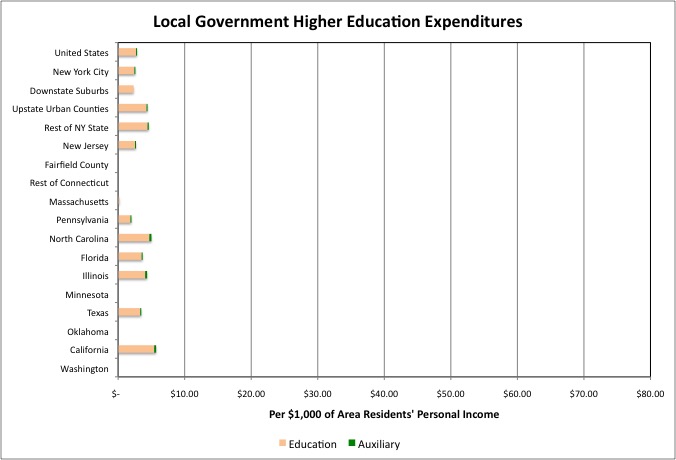
In many but not all states, local governments operate institutions of higher education, generally community colleges. Rarely, these community colleges have extensive “auxiliary enterprises.” The chart above uses the same scale as the first chart for elementary and secondary school spending, and as one can see, FY 2012 local government spending on this government function is not high at $2.85 per $1,000 of personal income in the U.S. as a whole. Even though New York is one of the states where local governments are credited with spending on community colleges, however, New York City’s spending in the category is below average at $2.47 per $1,000 of city residents’ personal income. The Downstate Suburbs are low as well at $2.32 per $1,000, but spending in Upstate New York is high at $4.34 on average in the Urban Counties and $4.60 in the rest of the state.
Although New York’s elementary and secondary school spending is very high compared with the U.S. average, therefore, the downstate New York local governments are spending less on community colleges than the U.S. average. Community colleges have been proposed as solutions to several education and education finance problems. With so many high school students taking Advanced Placement courses for college credit, and high school vocational education having been de-emphasized over the past few decades, some believe that substituting a year or two of community college for New York’s high-priced public schools could be both better and cheaper. And with college costs having soared, many suggest substituting two years of community college for the first two years of four-year college or university.
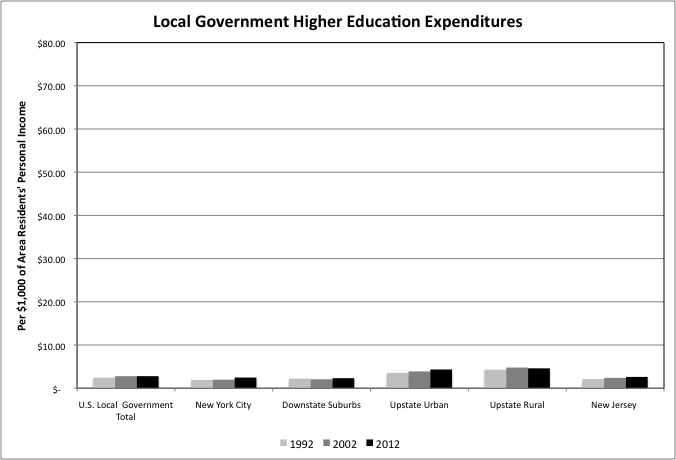
Focusing on education (and excluding “auxiliary enterprises,”) downstate New York community college expenditures per $1,000 of personal income did in fact increase from FY 2002 to FY 2012, from $1.96 to $2.47 in New York City and from $2.07 to $2.32 in the Downstate Suburbs. Spending in this category also increased from $3.88 to $4.34 in the Upstate Urban Counties, while falling from $4.78 to $4.60 in the Rest of NY State. Spending was flat per $1,000 of personal income nationwide.
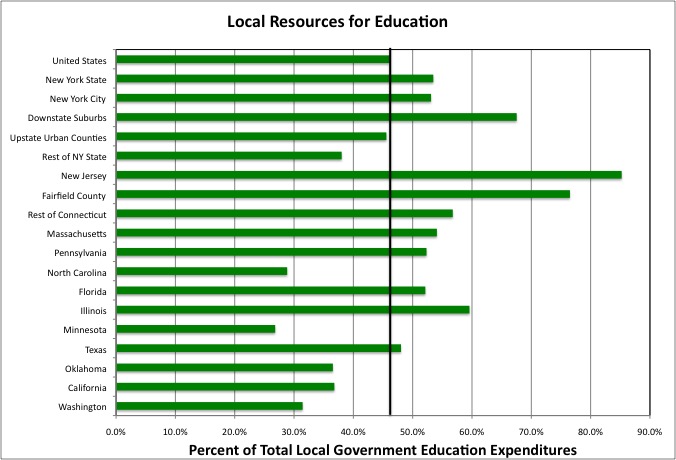
In FY 2012, local resources – primarily taxes but also fees – paid for 46.1% of local education expenditures (elementary and secondary schools and community colleges together). The local share for New York State was higher at 53.5%, with 53.1% for New York City and 67.5% in the Downstate Suburbs, but below the U.S. average at 45.6% in the Upstate Urban Counties and 38.0% in the Rest of New York State. The local share of education funding tends to be high throughout the Northeast, as is the local share of the state-local tax burden. New Jersey’s figure is inflated by the fact that the state makes teacher pension contributions in lieu of school aid (or at least it is supposed to) and directly operates the schools of some of its largest cities.
Outside the Northeast, limits on local school funding and, in some states, countywide school districts, reduce education inequality.
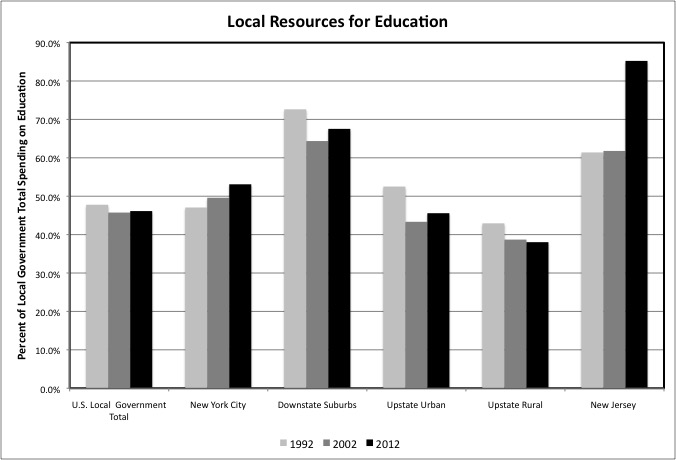
The local share of education spending has fallen slightly over the years for the U.S. as a whole. It fell substantially in the Downstate Suburbs, Upstate Urban Counties, and the Rest of New York State from FY 1992 to FY 2002. This was a result of the STAR program, which directed state school aid away from New York City. The local share of education spending increased somewhat in the Downstate Suburbs and Upstate Urban counties from FY 2002 to FY 2012, and soared in New Jersey. For New York City, the local share of education spending has increased steadily, even with the city’s soaring teacher pension costs excluded.
The local share of education funding is high in New York because elementary and secondary school spending is so high, not because state aid is low. (In this database, state aid includes most federal because it passes through the states. Direct federal aid is limited to federal aid for “federally-impacted areas;” migrant and bilingual education; Indian education; Head Start program; Federal grants for school nutrition and milk programs; and grants and contractual amounts received by institutions of higher education for education or for research and development programs.”)
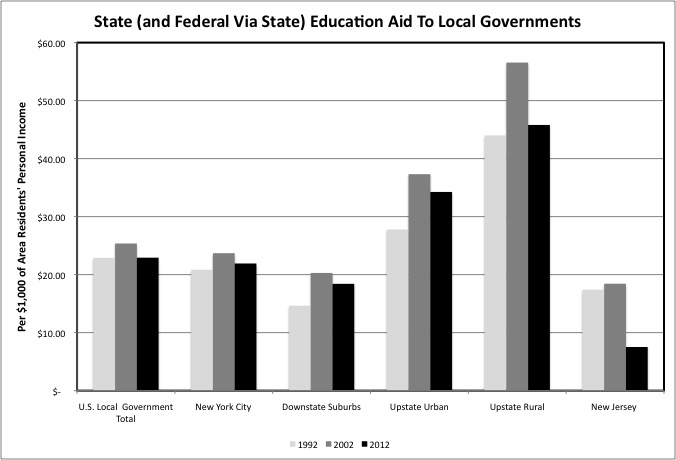
In FY 2012 state and indirect federal aid for local government education equaled $22.92 per $1,000 of personal income in the U.S. as a whole. New York State was above average at $25.62 in state education aid to local governments per $1,000 of state residents’ personal income. And state taxes were funding almost all of that difference, as federal education aid to the states averaged $6.51 per $1,000 of personal income in the U.S. as a whole, and a nearly identical $6.56 per $1,000 in New York State.
Within New York State, state and indirect federal education aid equaled $21.92 per $1,000 of city residents’ personal income in New York City, and averaged $18.41 per $1,000 of personal income in the Downstate Suburbs, $34.25 in the Upstate Urban Counties, and $45.80 in the Rest of New York State. State education aid soared per $1,000 of personal income from 1992 to 2002, and fell from 2002 to 2012, tracking enrollment, in the U.S. and all parts of New York State.