
It is too bad that people don’t pay as much attention to state and local government policy, and the politicians that control those governments, as they do to sports in general and baseball in particular. The sort of passionate if only superficially informed attention of the average WFAN listener. Or better yet, the time consuming analysis of many Amazin Avenue readers. After all the City of New York, the share of the State of New York that can be assigned to New York City, and affiliated public authorities combined spend about one-third of all the personal income earned by all the residents of New York City each year. One-third of your income, my income, David Wright’s income, even Fred Wilpon’s net income, assuming he still has net income. What do we get in return? Not what is deserved if people don’t pay attention.
In an attempt to improve things, I’ve posted the equivalent of Fangraphs Baseball on the employment (by public service), expenditures (by public service), revenues (by type) and debts of state and local governments around metro New York and around the U.S. Based on data from the 2012 Census of Governments from the U.S. Census Bureau, and similar datasets I’ve worked with over the decades. Want to know how the number of NYC police officers compares with the U.S. average and other major urban counties around the country, per 100,000 area residents? Or how tax burdens and public school expenditures compare in the Northeast, as a percent of each area’s residents’ personal income? Want to know what share of public transit costs are covered by fares, or public college and university costs are covered by tuition, here compared with elsewhere, or now compared with 10 or 20 years ago? I can show you. In fact, starting with this page
https://larrylittlefield.wordpress.com/the-latest-public-finance-spreadsheets/
I already have.
The last step in my analysis was a ranking of how much each state’s future has been sold out, with regard to debts, inadequate past infrastructure investment, and pension underfunding, with data for NYC and the Rest of the State compiled separately. It is this analysis that showed me how similar the management of our team, the New York Mets, and the management of New York City, New York State and New Jersey, have been over the past 25 years or so. To the point where as far as I’m concerned the Mets are New York’s team.
That analysis began with this post.
https://larrylittlefield.wordpress.com/2015/06/24/sold-out-futures-a-state-by-state-ranking-based-on-the-census-of-governments/
For example, consider the level of debt. Everyone knows the Mets are extremely burdened with it, compared with most other baseball teams, with the team itself, its stadium and its sports network all mortgaged to the hilt. Well the same is true of New York City!
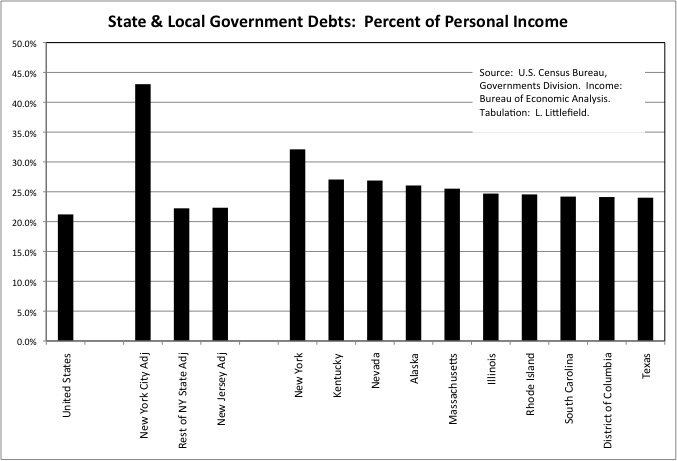
Taking into account the debts of the City of New York, New York City Transit, and an allocation of New York State and Port Authority of New York and New Jersey debts, NYC’s government debt in FY 2012 equaled 43.0% of the total personal income of all city residents in 2012, which would have ranked last (worst) if NYC was a separate state. Thanks in large part to the city, New York State in fact ranked last among states in the worst debt burden as a percent of its residents’ income that year. And the debt burden is much worse than in the past.
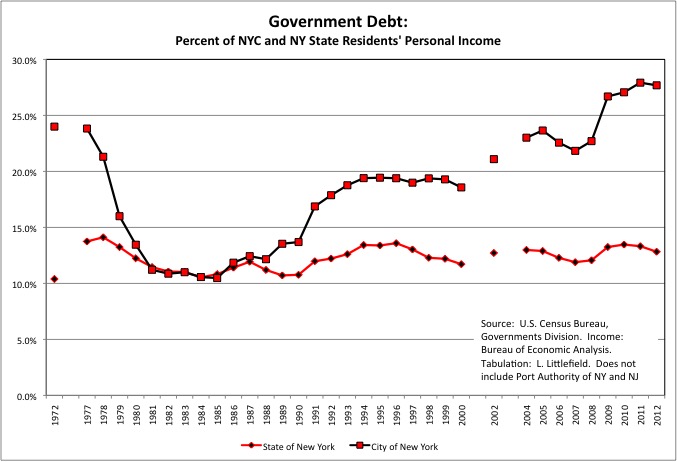
Taking the City of New York alone, the FY 2012 debt level was 27.7% of city residents personal income, higher than the 24.0% in FY 1972 – just before the city’s 1970s financial crisis devastated public services to the point where the infrastructure and school system collapsed, old women (the Bag Ladies) were left to die in the street, and 1 million people and 600,000 jobs fled.
Moreover, part of New York City’s debt and the part of the Mets’ debt are one and the same. Municipal bonds were floated to fund the construction of Citifield, bonds that in theory the Mets are obligated to repay (we’ll see what happens to the Yankee Stadium parking garage municipal bonds, which are in default). This debt presumably falls into the Census Bureau’s “public debt for private purpose” data item. The City of New York had $17.7 billion of that kind of debt in FY 2012, down from $19.2 billion in FY 2010 but up from just $5.1 billion in FY 2002.
For the Mets as well as New York’s governments, some of that debt has gone to actual capital investments with long-term payoffs. The Mets replaced a 44-year-old stadium, one with few modern amenities for high rollers, with a state-of-the-art ballpark for the fans to enjoy. And, similarly, over the years from 1980 to the present virtually every road, bridge and transit line in NYC has been substantially rehabilitated, and several sewage treatment plants and a third water tunnel have been added.
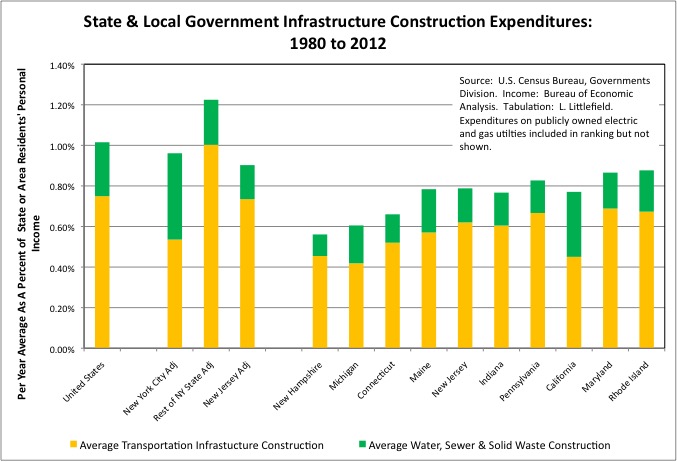
Not that any of this is exceptional, however. At the nationwide rate of infrastructure construction as a percent of U.S. residents’ personal income from FY 1977 to FY 1981, NYC would have spent an additional $40 billion on infrastructure (in $2012) from FY 1980 to FY 2012. And the crowding on the subways, the lack of any major subway expansions over those years, the potholes in the roads and the occasional water or sewer main breaks show the effect of that missing $40 billion. Still, many other states are far worse with regard to past infrastructure investment, including New Jersey, Connecticut, and most of the rest of New England.
The bigger problem, however, is that most of the infrastructure investment in New York and New Jersey over the past 30 years has been funded by debt, and now most or all available revenues (dedicated taxes, tolls, etc) are going to debt service. That leaves little or no revenue available for reinvestment in transit, roads and bridges in the future via the unfunded MTA Capital Plan, the New York State Transportation Trust Fund, and the New Jersey Transportation Trust Fund. The only level of government that has been putting up actual cash over the past few decades is the federal government, but the federal transportation trust fund is also empty. This is a crisis no one wants to face. A lack of ongoing reinvestment in the infrastructure, which is what metro New York now faces despite high taxes, is exactly what led to the NYC infrastructure collapse of the 1970s. And this time it affects more than just NYC.
Come to think of it, can the Mets afford to maintain and reinvest in Citifield? At least they have found the money to move the fences around. For my own part, it’s a good thing I can bike the 13 miles each way from my home to Citifield given what might happen to the subway system (again). Although as I approach age 54, I wonder for how much longer that will be the case.
It isn’t just on-the-books debt, and infrastructure debt, that burden the New York Metropolitans and metropolitan area governments, but also pension debts.
One famous way the Mets robbed their future is via deferred contracts with past players. In the worst example, rather than pay Bobby Bonilla $5.9 million in 1999, the team and player decided to put off any payments until 2011 and then spread the much higher level of money that would be owed – as a result of a stiff 8 percent interest rate — out over 25 years. Team ownership assumed that investment returns that were even higher than 8 percent, starting from the inflated peak of the wild stock price bubble of the 1990s, would pay for it all and them some. But the entire U.S. economy has just been a larger version of Bernie Madoff over the years.
http://r8ny.com/2015/03/18/the-american-economy-hair-of-the-dog-means-more-debt-for-the-doomed/
And as a result the Mets are strapped paying for players who departed long ago in a lower return, lower interest rate environment.
Ironically at nearly the same time, in the year 2000, New York City and New York State politicians cut deals with the public employee unions to retroactively increase public employee pensions. Massively. They claimed that it would “cost nothing” in higher taxes and diminished public services — after raising their estimate of future pension plan investment returns to that same 8.0 percent. In exchange for union political support for Governor Pataki for President, Mayor Giuliani for U.S> Senate, and State Comptroller Carl McCall for Governor, along with steak dinners, campaign contributions, and help keeping challengers off the ballot for state legislators.
New York’s public employees got huge increases in their pensions as they were cashing in and moving out. Even though the pensions that were promised when they were hired were already far richer than the retirement benefits private sector workers receive, and even richer than the retirement benefits public sector workers in other states receive. Wall Street was supposed to pay for the 2000 deal. And for the 1995 retroactive pension increase, the 2008 retroactive pension increase (for NYC teachers), and all the pension increases in between. But of course that was never going to be true.
As a result, despite NYC taxpayers putting up more as a percent of public employee wages and salaries than taxpayers anywhere else during the 1980 to 2012 period…
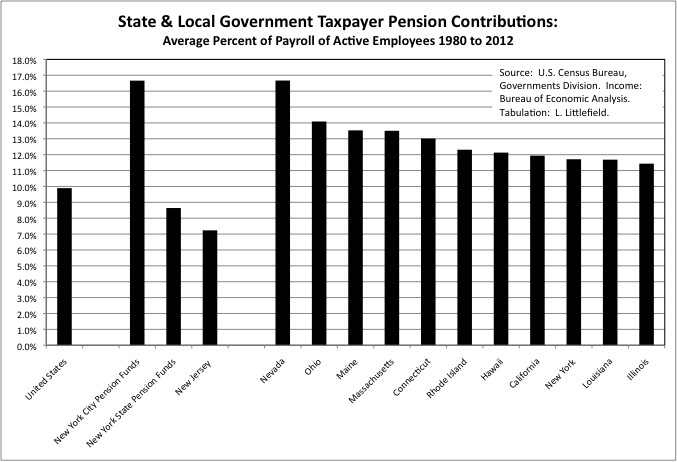
New York City’s public employee pension funds were are among the most underfunded in the U.S. in FY 2012. Right down there with New Jersey, where taxpayers had put little or nothing into the public employee pensions for years, the proceeds of pension bonds (more debt!). And NYC’s taxpayer pension contributions, though still not enough to get out of the hole, have soared as a result.
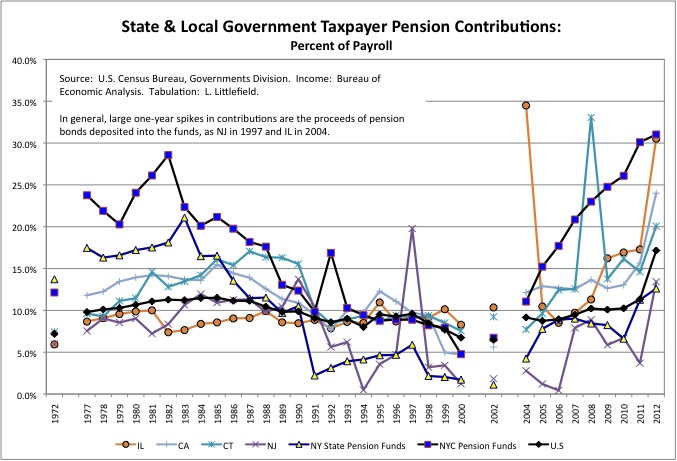
In fact NYC taxpayer pension contributions had soared to 31.0% of payroll by FY 2012. Compare that with your employer’s contribution to your 401K. That is even higher than the prior pension peak of 28.6% in FY 1982, when the city basically lay in ruins as a result of cuts in public services as money was diverted to the early-retired.
The only thing that has saved the debt-laden Mets is the Federal Reserve’s zero percent interest rate policy. This allowed its owners to refinance its massive debts at a relatively favorable interest rate of 3.25% more than the rigged benchmark LIBOR. Low interest rate policies by the Central Banks, to fight against to total collapse of asset prices and consumer demand worldwide, are keeping LIBOR rates low.
http://nypost.com/2014/02/22/mets-250m-refinance-deal-closer/
Just as low interest rates have saved the Wilpon’s ownership of the Mets, for now, so they have limited the damage of all that debt to the NYC, NY State and New Jersey budgets. Although the City of New York’s debts are as high as in the “Bronx is Burning” days, its FY 2012 interest payments equaled just 1.16% of city residents’ personal income that year. Compared with city interest payments at 1.34% of personal income in FY 1977. Moreover, zero interest rates have inflated another stock market bubble, allowing the City of New York to cover up just how underfunded its public employee pensions plans have become.
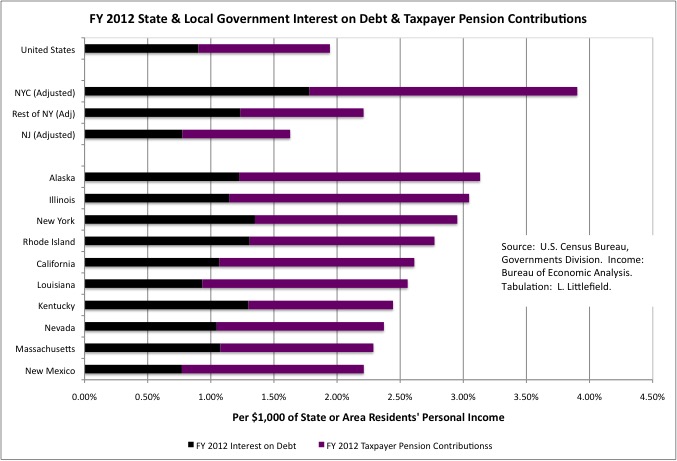
Even so, however, including the city’s share of State of New York and Port Authority debts city residents ended up paying 1.78% of their personal income, on average, in taxes in FY 2012 just for interest on state and local debts. Double the U.S. average of 0.90%. And NYC residents were also paying 2.12% of their personal income in taxes for state and local government taxpayer pension contributions, double the U.S. average of 1.04%.
That is nearly 4.0% of NYC residents’ personal income paid in state and local government taxes but sucked into the past, rather than being used for today’s public services and benefits. The average state and local tax burden in the U.S. is only about 10.0% of income, so at the national average tax burden 40.0% of NYC’s total state and local taxes would be going to the past. But of course NYC’s actual state and local tax burden is much higher.
With so much money going to high debts and past players, the Mets have far less money to pay today’s players. The opening day payroll in was $101 million in 2015, down from $149 million in 2009, according to Baseball Prospectus.
https://www.baseballprospectus.com/compensation/cots/national-league/new-york-mets/
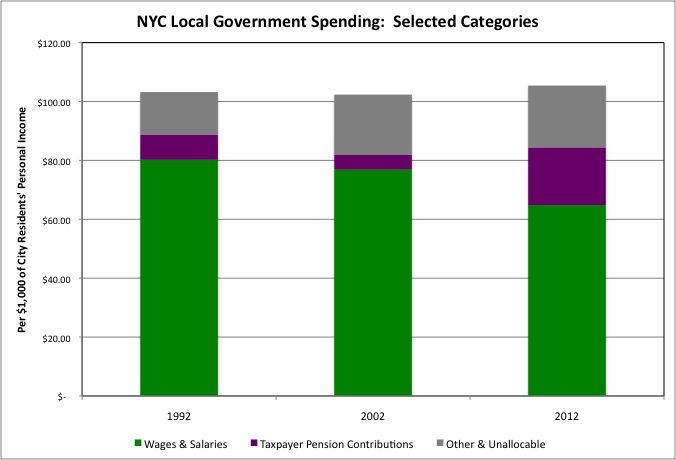
Similarly, as the cost of early retired public employees has soared, relative to the total personal income of all city residents, the wages and salaries of active public employees of the City of New York have been squeezed down. The cost of retiree health insurance ends up in the Census Bureau’s “Other and Unallocated” category. Including that category, wages and salaries, and taxpayer pension contributions city residents ended up paying a little over 10.0% of their personal incomes for NYC public employees in FY 1992, FY 2002, and FY 2012. But the share going to City of New York public employee wages and salaries has fallen from around 8.0% of city residents’ personal income in FY 1992 to just 6.5% in FY 2012.
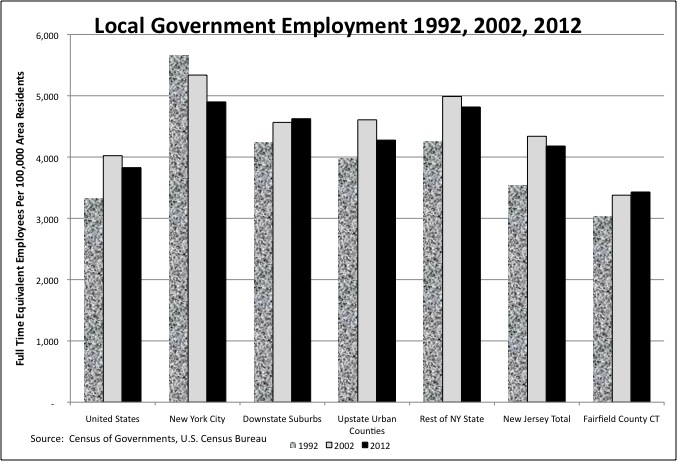
On the Mets, today’s players are paid less, on average, than yesterday’s, but you still have a 25-man roster. In state and local government the unions often cut deals for lower pay and benefits for new public employees balanced by ever-richer deals for those cashing out and moving to Florida. At one point the starting pay of NYC police officers and firefighters was cut to just $25,000. Mostly, however, lower payroll has meant fewer NYC public employees relative to the city’s population, and that has meant large class sizes in the schools, and more crowded trains and buses.
Not only are the Mets now playing with a small market payroll in the big city, but injuries have meant a large share of that payroll is currently on the disabled list.
http://metsblog.com/metsblog/mets-are-getting-hammered-by-injuries/
New York City has a similar problem. While police and firefighters who retire without disabilities receive a pension equal to 50.0% of their final year’s salary after working for 20 years, those who claim disabilities receive pensions equal to 75.0% of pay. And NYC police officers and firefighters are far more likely to retire with disabilities than police officers and firefighters elsewhere.
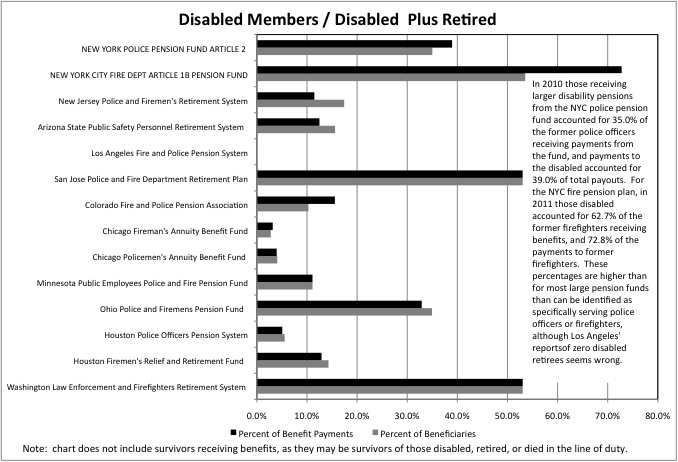
And while there is no doubt that injured Mets players want to get back on the field, there are some questions about New York City’s high level of disability pensions, particularly among those who retired prior to 9/11.
http://nypost.com/2015/06/10/andrew-cuomos-ugly-pension-gambit/
Although everyone in NY politics seems to be in these kinds of deals, a federal prosecutor did catch a few of them.
Schemes like this limit the city’s ability to pay for those who legitimately disabled, and limit the funds available for active workers. As a result New York City only had 2.8 times as many police officers per 100,000 residents as the U.S. average, and the PBA threatened to stop protecting New Yorkers as a result until they got another 1,000-plus dues paying members.
The Mets may have a small market payroll for those playing baseball today, but they still have big market costs when their debt and deferred contract costs are included. Thus they need to keep ticket prices high. But there is a catch. The Mets cannot force people to pay them money, and high ticket prices and bad baseball have led to falling attendance and falling revenues, adding to the team’s cash crunch.
The City and State of New York are in a much different position. They can simply force people to pay more in taxes even as services decline. Pay up or have legal action against you. Comply with the legal action or get arrested and jailed. Resist arrest and perhaps get shot.
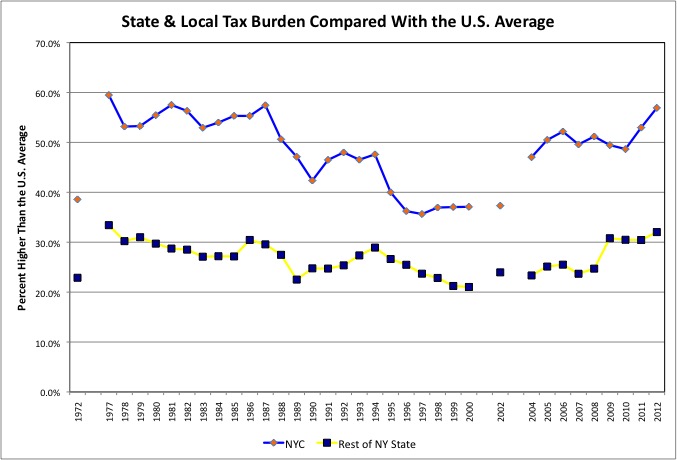
New York’s state and local government tax burden is sky-high. The only states where the state and local government tax burden is a higher share of state residents’ personal income than in NYC as of FY 2012 are Alaska, Wyoming and North Dakota, where taxes on fossil fuel extraction, not residents and other businesses, are carrying most of the weight. And NYC’s state and local tax burden has soared in recent years, compared with the U.S. average, to the point where it was 56.9% above average in FY 2012. That is nearly as high as the 59.5% above average in FY 1977, about the time the Mets traded Seaver to the Reds.
Fred Wilpon’s other business is real estate. And real estate is one big difference between the dark days of the 1970s in New York City and today. Back when the Bronx was Burning, New Yorkers may have paid high taxes for bad services but at least the cost of real estate was cheap. Today, however, since the city is only of the few places in the country that the younger generation wants to live in, the cost of real estate is sky-high.
https://larrylittlefield.wordpress.com/2014/11/23/the-new-urban-crisis/
Perhaps never in history have the two sets of interests that contribute the most money to New York City and State politicians, the public employee unions/contractors and the real estate industry, been able to suck as much money out of the serfs at the same time. In exchange for so little. And if you think the high rents paid by the hundreds of thousands of young and immigrant New Yorkers living four to a room (while working for nothing as interns based on a promise to maybe move up to freelancers without benefits later)…
https://larrylittlefield.wordpress.com/2013/10/06/new-york-city-economic-refugee-camp/
might be available to help the NY Mets, think again. The Wilpon real estate empire, AFAIK, is heavily geographically weighted to the preferences of Fred’s generation. Suburban. And young adults, who determine the relative value of places on the margin, are going elsewhere.
The correlation between the Mets and their city is not a surprise. It has to do with the values and economic choices of an entire generation, the generation now in charge.
If Fred Wilpon, a man who hopes to gift the New York Mets to his son and Citifield to its fans as a legacy, is so willing to rob from his own future. And his “friend” Bernie Madoff, who could have been rich and respected, chose instead to be even richer and a criminal, even ripping off the Wilpons. Then how can we expect our amoral political hacks to place any priority on our common future, given scarce resources and the drumbeat of special interests knocking on their doors looking for one more big score on their way to Florida – at the expense of people who don’t matter?
Particularly when the serfs don’t even pay attention.
But I do have hope. About the Mets.
The Alderson regime has shown that even if past deals and non-decisions have left younger generations far worse off, and even if nothing can be done about it, by being honest about this, preventing additional ripoffs, accepting diminished circumstances, and reinvesting in less well off younger generations…
https://larrylittlefield.wordpress.com/2013/11/10/donald-trump-the-man-of-his-generation/
Things can eventually turn around. The Mets turnaround happened as soon as the team had no choice to admit that the future was screwed. At that point painful steps were taken, diminished circumstances accepted and adjusted to, and rebuilding began. Instead of sacrificing the future, the Mets started sacrificing the present to rebuild a future. The Mets had to wait for dead money contracts to come off the books, and may have to wait even longer for those SNY, Mets and Citifield debts to be paid back to really have assurance of quality baseball. But at least a turnaround has begun.
And Americans may have to wait for the most affluent generations in U.S. history, those born from 1930 to 1957 or so, who feel entitled to everything they have promised themselves but were unwilling to pay for, to die off before the country turns around. But as long as they understand they will be worse off, and will spend their lives paying for the selfish members of Generation Greed who came before, perhaps our children and grandchildren can make a go of it.
Sandy Alderson for Governor (or NY or NJ)? Paul DePodesta for Mayor? We could do worse. The data says that in general, we already have.