
Imagine the following on a postcard sent to every taxpayer and public school employee in Syracuse, NY: “In FY 2013, according to the U.S. Census Bureau, the Syracuse City School District spent $20,882 per student. That was higher than the Upstate NY average of $19,116 per student, and the average for Vermont at $19,482 per student, and far higher than the U.S. average of $12,300 per student, the Pennsylvania average of $17,184 per student, or the Ohio average of $13,008 per student. The average private sector worker in Ohio and Pennsylvania earns about the same as the average private sector worker in Upstate NY. On instructional wages and salaries and benefits alone, the Syracuse City School District spent $10,946 per student, which is $218,912 per 20 students or $131,347 per 12 students.”
Imagine the following on a postcard sent to every taxpayer and public school employee in the Northport-E. Northport Unified School District. “In FY 2013, according to the U.S. Census Bureau, the Northport-E. Northport Unified School District spent $24,649 per student. That was higher than the Downstate NY average of $23,549 per student, and far higher than the average of $19,121 for New Jersey, $18,312 for Connecticut, or $16,549 for Massachusetts. These are all high wage, education-oriented states on the Northeast Corridor. On instructional wages and salaries and benefits alone, the Northport-E. Northport Unified School District spent $15,222 per student, which is $304,442 per 20 students or $182,665 per 12 students. Downstate NY is a relatively high-wage area, but even adjusting Northport-E. Northport per student spending for this factor down to $20,283 per student, it is still vastly higher than the U.S. average of $12,300 per student. ”
Imagine similar postcards being sent to taxpayers and public school employees in every part of New York State. Where would the sender get the data? Perhaps from the spreadsheets linked below.
I’ve just completed a comprehensive analysis and database of state and local government employment, revenues, and expenditures over the decades, for New York, New Jersey, and other areas, based on the 2012 Census of Governments and earlier data. And frankly I’m a little burned out. So I’m not going to do a detailed analysis of the Census Bureau’s most recent detailed public education finance data for FY 2013. You can find last year’s information for FY 2012, 2002, and 1992 here
https://larrylittlefield.wordpress.com/2014/05/28/census-of-governments-public-school-finance-data-fy-2012-2002-and-1992/
with a detailed analysis here.
https://larrylittlefield.wordpress.com/2014/06/01/new-yorks-sky-high-public-school-spending/
Then again, I shouldn’t have to do much work for people to have access to this data. While extensive analysis was required get the data from the 2012 Census of Governments into comparable and usable for, the Bureau’s public school finance data is pretty easy to work with, and can be found here.
http://www.census.gov/govs/school/
When it was released for FY 2013 there was some news coverage in Upstate New York and the suburbs, but the information was not presented in any detail. The data includes relative spending on instructional staff (ie. teachers) wages and salaries and benefits, school and district administration, student transportation, building maintenance and services, etc. The Empire Center may be preparing to release an analysis.
But here in NYC, as far as I was able to see, this information was not analyzed and presented at all. Not by the New York Times, the tabloids, New York 1 or it seems anywhere else. It appears to be under Omerta; it is that which must not be spoken of. Perhaps because it raises too many questions.
http://ny.chalkbeat.org/2015/06/25/senate-leader-says-questions-about-nyc-ed-spending-fueled-one-year-mayoral-control-deal/#.VaqY_lzR8U4
In the debate over renewing mayoral control of the New York City schools, the new State Senate Majority leader John Flanagan was quoted as saying the following.
http://ny.chalkbeat.org/2015/06/25/senate-leader-says-questions-about-nyc-ed-spending-fueled-one-year-mayoral-control-deal/#.VaqY_lzR8U4
“The city of the New York needs a significant round of school aid, which they’re getting,” Flanagan said at a press conference at the Capitol in Albany. “And if it’s a $9 billion check, I think it’s within our purview and our responsibility to ask appropriate questions of, where is the money going?”
Really? Do you really not know, Mr. Flanagan? He lives in the Northport-E. Northport Unified School District, and I made it an example in his honor. His rival for his new post in the State Senate was from Syracuse, also cited above. The new head of the State Assembly is from New York City: both our long-time legislative leaders are under “Capone on tax evasion” indictments. And here is the postcard that our legislative leaders would never allow NYC taxpayers and school employees to receive.
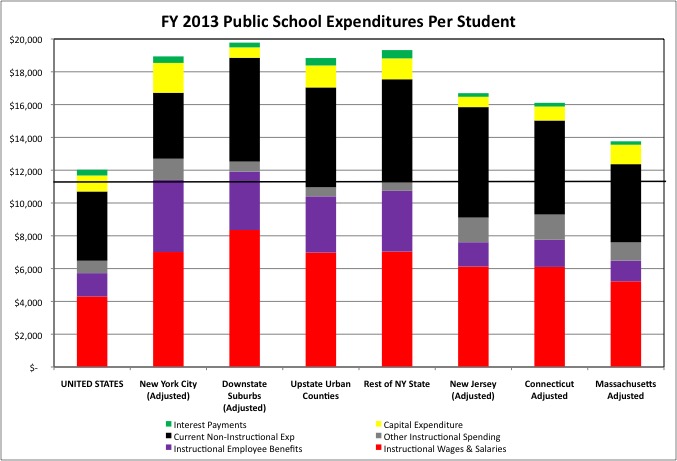
“In FY 2013, according to the U.S. Census Bureau, the New York City School District spent $23,056 per student. That was slightly lower than the Downstate NY average of $23,549 per student, but far higher than the average of $19,121 for New Jersey, $18,312 for Connecticut, or $16,549 for Massachusetts. These are all high wage, education-oriented states on the Northeast Corridor. On instructional wages and salaries and benefits alone, the New York City School District spent $13,865 per student, which is $277,300 per 20 students or $166,380 per 12 students. Downstate NY is a relatively high-wage area, but even adjusting New York City per student spending for this factor down to $18,965 per student, it is still vastly higher than the U.S. average of $12,300 per student. ”
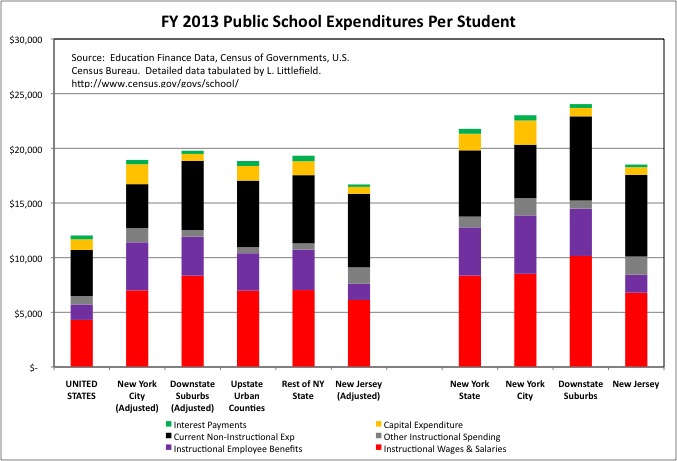
Actually, after adjustment for the higher wage/cost of living in Downstate New York, per student spending for New York City ($18,965), the Downstate Suburbs ($19,982), the Upstate Urban Counties ($18,926) and the rest of New York State ($19,418) are very similar to each other. But all are vastly higher than almost anywhere else.
A summary of this data is in this spreadsheet.
Census Public School Finance Per Student FY13
And data for every school district in New York State and New Jersey can be found in this spreadsheet.
Census Public School Finance Per Student FY13
All the per student data (by category) for individual school districts in Downstate New York and New Jersey is adjusted downward based on the higher level of average private sector wages there, excluding the overpaid Financial Activities sector. To get the data without that adjustment, just change the numbers in cells AC7 and AC 12 to the number 1.
What we have, however, is the case of a disappearing adjustment. From FY 2012 to FY 2013, New York City’s school spending per student went up by $172. But its adjusted school spending per student went up by $1,100. Why? Because the downward adjustment for private sector workers earning more than the U.S. average here keeps getting smaller. Because the extent to which non-financial private sector workers in Downstate New York earn more than the U.S. average keeps getting smaller. And including the cost of their benefits, New York’s public sector workers keep getting richer. And thus their burden relative to serfs keeps going up.
Even with adjustment, there is not one school district in New York State with per student spending that that is as low as, or anywhere close to, the U.S. average. The lowest in FY 2013, according to the U.S. Census Bureau, was Royalton Hartland Central School District at $13,379 per student. A while back I wrote to the Victor Central School District and told them they were the only school district in the state that was below the U.S. average. Corrective action seems to have been taken, and that district’s spending is now much higher at $15,460 per student. But corrective action is never taken in the other direction. Which is probably why the powers that be keep this data under Omerta.
Senate Majority Leader Flanagan can download these spreadsheets and get all the information on where New York City’s school spending, and the school spending or any other school district in the state, that he wants. But perhaps I can make it easy for him.
Remember that massive retroactive pension increase for New York City teachers you voted for back in 2008, Mr. Flanagan?
https://larrylittlefield.wordpress.com/2014/07/15/the-2008-nyc-2555-united-federation-of-teachers-pension-deal-an-investigation/
The one that allowed your constituents, who had been driving in to get paid by the NYC schools every day (except the maximum allotment of sick days), to be able to get the hell out and move to Florida after working (or not) for 25 years rather than 30, at age 55 rather than age 62? The one you voted for in exchange for the United Federation of Teachers helping the State Senate Republicans in a special election for a swing seat in the North Country up near Canada?
http://www.nysun.com/new-york/teachers-get-big-gift-from-gop/71371/
The deal that (snicker snicker) “cost nothing” even though NYC would be paying for retiree health insurance for former teachers for ten years before Medicare starting picking up most of the weight, instead of three? The deal that, multiplied by prior deals and early retirement “incentives,” left the NYC teacher pension fund one of the most underfunded pension funds in the country? Remember that deal now, Mr. Flanagan?
That’s where NYC’s school spending, or a growing share of it, is going. That’s what you intended, isn’t it? It is certainly what the United Federation of Teachers intended. And it is going to keep getting worse.
For decades, the NYC schools were robbed by a state aid formula that cheated its children. As soon as that ended (and it has ended – for now) the city’s schools started getting robbed by retroactive pension increases for those who already had far richer retirement benefits than most workers. Robbed and robbed and robbed, but we can’t talk about that can we? Why stir up the serfs?
Some people just can believe the data on instructional spending, the $277,000 of instructional wages and benefits per 20 students in NYC, as reported by the U.S. Census Bureau. After all teachers are underpaid and work 80 hours a week, according to information put out by the New York State United Teachers and the United Federation of Teachers. How can their cost be that high?
According to the NYC Comptroller, the New York City schools have about 109,000 “pedagogical” workers; according to the Census Bureau the city’s schools have about that many “instructional” employees.
But considering the average class size in NYC elementary schools and the city’s school enrollment, as best as I can determine from this source…
http://schools.nyc.gov/AboutUs/schools/data/classsize/classsize.htm
only about 41,000 teachers are actually teaching at any one time during the city’s 6 hour school day, or 37.6 percent of them.
Now that figure of 109,000 must include school librarians, gym teachers, etc. (It does not include principals and other administrators, which are tabulated in the Census Bureau data separately). But just based on a figure of around 80,000 classroom teachers I’ve heard, little more than half of New York City teachers are teaching at any time. Where are the rest?
The rest are on break, in “preparation periods,” out sick, in out of classroom assignments, etc. Now you have probably heard propaganda claiming that New York City teachers work 80 yours a week, grading papers and preparing lessons at home outside of the 6 hour 20 minute work day (with a 50 minute lunch break). But what do they do in those preparation periods? It may be that novice teachers, preparing lessons for the first time, end up spending lots of extra time doing it, but not veterans. The reality is different.
Do people get sick, take breaks, get sick, and do other work in other school districts across the country, and in the private sector? Or course. But few do as little as NYC teachers.
Following the Circular 6 teacher work cuts agreed to by the administration of Mayor David Dinkins (he fired his labor negotiator when he found out what it did to the schools), widely reported studies in the 1990s found that NYC teachers spent less time teaching than those just about anywhere else. Moreover, the city kept adding more and more half days to the schedule, allowing teachers to work even less.
Mayor Bloomberg’s early contracts with the United Federation of Teachers provided big raises, far in excess of inflation, in excess of what private sector workers were getting, and in excess of what other city workers were getting, in exchange for more time with students. But even at that, New York City still had to pay two teachers – and provide them with non-wage benefits such as health insurance – for each one actually teaching.
And once the UFT got Mayor DeBlasio in office, it also got a contract that cut the amount of time teachers spend with students even future, while keeping the much higher pay. The justifications for the reduction in time spent teaching – the need for “collaboration,” “training,” etc.
New York City teachers also spend fewer years teaching than other teachers. I was once told by an older city teacher that the goal of every one of them was to get out of the classroom as soon as possible, to a cushy non-teaching assignment. Again in exchange for much higher pay, which leads to much higher pensions, Mayor Bloomberg required more teachers to actually teach. Mayor DeBlasio recently reversed that too, to provide a “career path” for teachers.
The days worked by NYC teachers were also cut recently. After agreeing to a huge pension increase in 2008, probably in exchange for tacit support for or at least no opposition to a possible run for President, Mayor Bloomberg found the NYC teacher pension plan was heading for collapse, a collapse whose cost will gut the schools. So he and the UFT agreed to lower pension benefits, and lower take home pay, for newly hired teachers in exchange for fewer days worked each year for all teachers. Down to something like 182 (my more typical work schedule – 225 days).
So you needed two active NYC teachers for one to be actually teaching. In the future, however, thanks to Mayor DeBlasio cutting the same sort of deals as his mentor Dinkins, you will need more than two active teachers for each one working. Even though NYC taxes were raised, other services were cut, and the infrastructure is being disinvested in to increase teacher pay in exchange for the work they are no longer doing.
How about retired teachers?
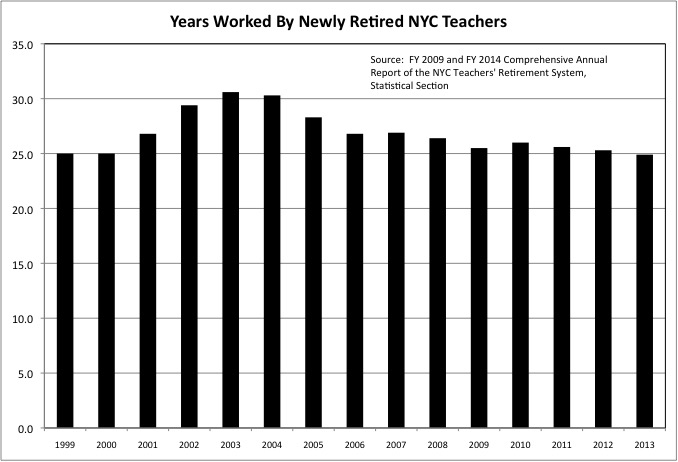
Most current and recently retired New York City teachers were promised full retirement at age 62 after 30 years worked, based on rules put in place in 1973 – after the cost of retroactive pension increases in the late 1960s devastated the city schools. But did any NYC teachers actually work 30 years? Not many. As teachers began to reach 25 years worked the UFT cut a series of deals to allow city teacher to retire years earlier than they had been promised, even in the fact of a national teachers shortage that had the city struggling to get certified teachers in its classrooms.
http://www.nytimes.com/1996/07/29/nyregion/buyouts-leave-school-board-racing-to-fill-3000-jobs.html
According to a list in the 2014 Comprehensive Report of the New York City Teacher’s Retirement System, one I have saved because I expect this sort of information to be hidden and wiped out as the pension crisis intensifies, there was “early retirement incentives” to allow New York City teachers to retire earlier than they had been promised – at a cost far greater than the pension fund had been funded to support – in 1991. And in 1995, 1996, 1997, 1998, 1999, 2000, and 2002. (There were other types of pension increases every year).
Then in 2008, the UFT cut a political deal to retroactively award a full pension at age 55 after just 25 years of work. There were only a few years in which newly retired NYC teachers had actually worked 30 years before retiring.
And as a result, the ratio of working to retired teachers, which had been 2.5 to 1, is less than 1.5 to one and going down.
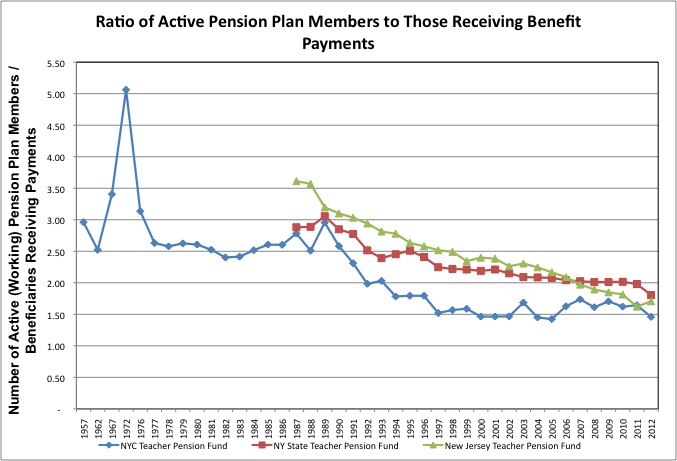
It will go down further, because 25/55 means one year in retirement or more for each year worked.
Just as a lower pension for new hires was enacted in 1973 after the schools were wrecked by soaring pension costs, so another lower pension for new hires was enacted a few years ago. And as a result, less is being contributed to the NYC teacher pension, which currently has less than half of the money it needs to pay the retroactively enriched benefits for older and retired workers. Which means that given the certainty of future retroactive pension increases, the city’s pension costs are likely to continue to soar, and money for the classroom is likely to be gutted, just as the UFT has worked and politicked and lied and manipulated to achieve.
Adding in the fact that half of all “working” teachers are actually with students at any time, there will soon be four teachers getting paid for every teacher in the classroom. Because with their “career ladder” teachers only expect to teach half a day for 20 years – and to be retired for 25 or more. That’s how you get resentful teachers who feel they are underpaid at $277,000 per 20 students, with larger class sizes than that. And it is going to get worse and worse.
With our legislature and the United Federation of Teachers, we are going to pay more and more but never get more. We are going to get less. It has been round and round for 50 years. Any deal to allow the NYC teachers to do less work and less good work is permanent. Any deal for the reverse is temporary, to be repealed soon after those who made it are gone.
If most teachers are good-hearted people who do their best, why is the union so selfish and evil? Because it doesn’t represent most teachers. It represents the lazy, the incompetent, the complainers, the grifters, those retired, and those soon to retire. In fact, it recently changed its bylaws to increase the voting power of retired teachers relative to working teachers. And the retired outvoted those working in the union election.
The union works relentlessly to make New Yorkers worse and worse off. Parents, and any politicians who might actually represent them one at a time, are here and gone. And no one in the media ever looks back to the past, and blames the UFT for what it has done. Well almost no one – progressive legend Wayne Barrett is prepared to tell it like it is.
http://www.nydailynews.com/opinion/unholy-alliance-article-1.1838112
The entire “school reform” war is joke given the financial devastation. It’s time to admit the union controls the schools, it will always demand more and more, and people will never be able to afford it. Deferring costs to cover this up just makes it worse, and that is what is happening right now.