
It is once again time for a major federal election, and I am once again doing my best to avoid listening to the nonsense being spoken by the Presidential candidates. I have not watched any of the past debates, and based on what I hear don’t want to watch any future debates either. Despite our nation’s challenges, the candidates are promising to hand out more goodies, and promising the people who would benefit would never pay for them. Bernie Sanders claims that everyone can have everything, and the only people to pay would be the rich. Ignoring the fact that the Bush tax cut for the rich has already been repealed, and we are still facing a national fiscal disaster. Republicans are once again promising tax cuts for the rich, and promising that the only people who would face sacrifices would be the poor and those in younger generations. The same people Republicans have made worse off in federal policy for the past 35 years, with no acknowledgment of that fact.
Only Donald Trump speaks as if he realizes how much worse off the younger generations following in the wake of Generation Greed actually are. But he doesn’t really explain it, almost certainly doesn’t understand it, and instead panders by creating scapegoats, blaming the Chinese, Mexicans and Muslims for all of the nation’s problems instead. The way the poor, immigrants and those living in older central cities were blamed 20 years ago. And he promises that all people have to do is elect him, and the unsustainable consumer debt-driven phony economy that floated his casinos, before they went under, will somehow return. None of this has anything to do with anything any of them actually would, or could, do if elected. So rather than listen to what they say, I have once again tabulated some federal budget data to what the federal government has actually done over the past 35 years-plus. To see how the choices of the past have affected our real future.
Gradually, it seems, more and more people are looking over my compilation of state and local government finance data from the Governments Division of the U.S. Census Bureau, and even following links back to the Bureau’s site. That dataset is not nearly as well understood, and not nearly as frequently cited, as it ought to be. Data on federal revenues and expenditures, on the other hand, ought to be familiar to anyone with an interest in, or whose job is to report on, federal policy. There is less of it to deal with, since there is only one government to contend with, and historical data is readily available here.
https://www.whitehouse.gov/omb/budget/Historicals
To make like easier for those interested, however, I have put together a spreadsheet with some charts, one the reader can download here.
Overview of Historic Federal Finance to 2014
I’ll add some additional charts, and write some posts on different aspect of the federal budget, over the next few weeks. But you don’t have to wait for that. You can look at the table and charts and make up your own mind, and this is what I would prefer. The essential background to what you will see, however, is this.
For most of the past 35 years the richest generations in U.S. history and, for the Baby Boom component, perhaps the largest, have been in the workforce, a huge boost to federal tax revenues and a limited burden on federal expenditures, many of which go to the retired. But that is changing fast, and the federal government will never again be in such an advantageous fiscal position.
Moreover the generations born starting in 1958 or so have been poorer, at each phase of their lives, than those born earlier, and will obviously have difficulty carrying the cost of the prior larger, richer generations in retirement. And so a large amount of money should have been saved up by those older generations, individually and collectively, to pay for their old age needs. But that didn’t happen.
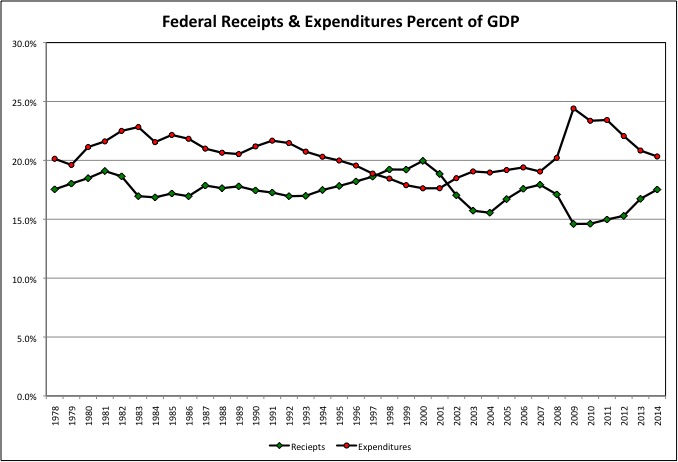
Federal revenues exceeded federal expenditures in only four years since 1978, basically in the second term of the administration of Bill Clinton. Over time federal revenues have had their ups and downs, but the general trend is down as a percent of GDP. Just as wages have been falling as a percent of GDP. Expenditures had been falling as a percent of GDP, as all those Baby Boomers in the workforce made GDP larger relative to the amount of money the federal government spent. Until GDP plunged and expenditures soared during the Great Recession.
Some of the ups and downs of federal revenues and expenditures are the result of the cyclical ups and downs of the business cycle. Economic booms temporarily increase tax revenue and temporarily reduce spending on the needy, of whom they are fewer. Recessions temporarily do the reverse – tax revenue plunges with work income and capital gains, but expenditures are pushed up because more would-be workers end up in need of public assistance, and spending is needed to stimulate economic demand.
People and the media, when judging elected officials, generally don’t account for the impact of cyclical factors beyond their control. The President, like the quarterback of a football team, gets too much credit when the economy is up and too much blame when the economy is down. And our political deceiver class always carefully chooses the years by which to judge economic performance, in order to bias the result and made the current leadership look better or worse than they really are. Choosing an unusually good or bad past year for the starting point. Both political parties play that game. Right now things are not good – except in comparison with 2008.
I try to do the opposite. I want to analyze the changes in the federal budget that have been the result of actual public policy changes. And the result of long-term changes in American society that are unlikely to reverse, such as falling incomes by generation and the aging of the population. I have therefore chosen one “benchmark” year for each President going back to President Carter. Which is to say starting with a point before the Generation Greed era. I have selected these years based on two criteria.
The first criterion is to select roughly comparable economic years: not bad, but not unusually good either. This wasn’t easy for the first President Bush and President Obama, each of whom were President during tough times. I ended up using the last budget year of the GHW Bush’s administration (FY 1993), when the economy was finally recovering but most people didn’t feel it yet (thus his election defeat). The same may be said for most of Obama’s two terms, and I ended up using FY 2014, the most recent year available. Even though it isn’t the best choice by the second criterion.
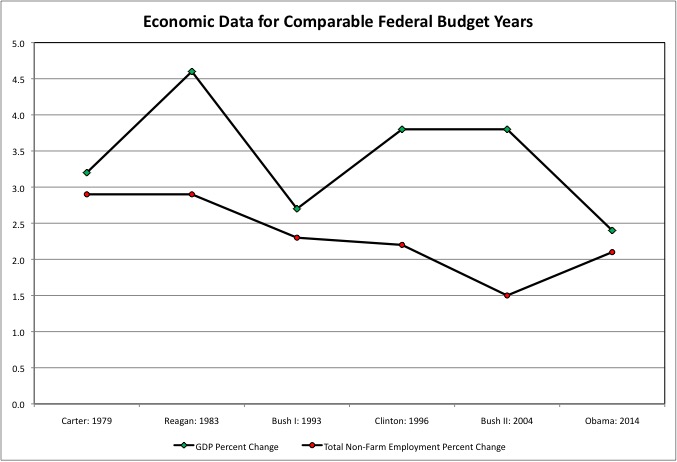
The second criterion is to select a year after the initial policy program of each President has come to be reflected in the federal budget data, but before the independent actions and opposition of Congress had come to have an equally important impact on the budget. For example the Reagan tax cuts and defense build-up were largely in place by 1983. President Clinton faced a hostile Republican Congress starting in FY 1996, and most of the budget cuts after that year could be attributed as much to Newt Gingrich as Bill Clinton. And the administration of George W. Bush got full Republican control of Congress for four years starting with FY 2003, but faced Democratic opposition (and then a boom and then bust economy) later.
Speaking of Congress, note that the title of this post is Our Phony Federal Election, not Our Phony Presidential Election. While no one seems to be paying attention, members of the House of Representative and the Senate are up for election this year, and the result of that election will determine which political party controls each house. The American people have essentially become non-participants in the legislative branch of the federal government, which is therefore dominated by special interests. People seem to believe they are choosing an elected dictator as President, someone that actually controls the government. Not so. And as a result, many people end up being disillusioned by each President.
Our members of Congress have virtually no popular support and no public profile. My congresswoman? We haven’t heard from her since she went on the Colbert report and said that there was slavery in her district in New York 33 years after the Civil War. Rather than have been mostly abolished here 38 years before the Civil War.
Does she still show up in Washington? Does she do anything there? We don’t know. She seems to have disappeared.
With most members of Congress being similarly invisible, except to those who attend their fundraisers, the Koch Brothers have shown just how little public support incumbents actually have in the face of any ideological challenge at all. What is remarkable, given that this is supposed to be a democracy, is not that the Koch Brothers are funding and organizing challenges to incumbent members of Congress. It is that no one else is. That is the real reason for the dominance of the few. In choosing our federal legislature, delineated in Article 1 of the U.S. Constitution, there is no there there. No platform, often no challenger, and not much of a mention by those who hope to be at the top of the ticket.
With the business cycle adjusted for by limiting the analysis to benchmark years, the chart of overall revenues and expenditures looks like this.
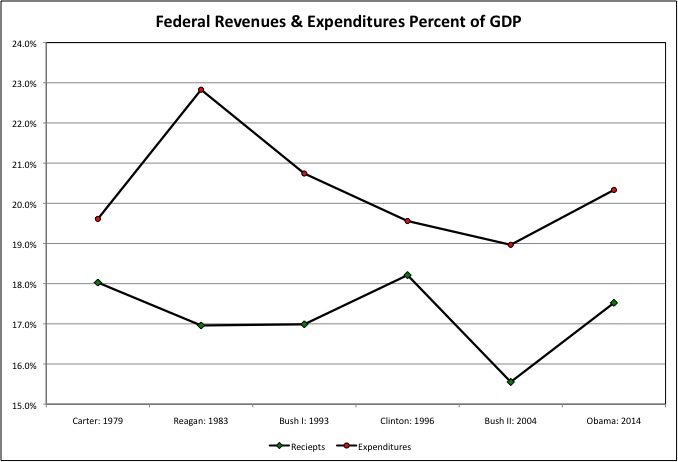
One can clearly see the impact of President Reagan, and the “more spending for all but the powerless and less in taxes from the powerful” policy that has been popular with both political parties ever since. The huge defense build up pushed up federal spending, while the huge Reagan (personal and corporate income) tax cuts reduced revenues more than the huge Reagan (payroll) tax increase expanded them.
Federal expenditures then fell as a percent of GDP, the business cycle aside, under President’s Bush I, Clinton and Bush II. But the Bush II tax cuts further slashed federal revenues, until those tax cuts expired under President Obama. Meanwhile federal expenditures have increased, the result of an aging population and a poorer workforce as I will show.
Note that the data I present in the “Output Tables” worksheet of the spreadsheet, with its high level of detail, is federal revenues and expenditures per $100,000 of GDP, rather than as a percent of GDP. The reason is that the numbers for the detailed categories are too small to show as a percent. For example, federal excise taxes on alcohol equaled $257 per $100,000 of GDP in FY 1978 but just $57 per $100,000 of GDP in FY 2014. I’ll drink to that. As a percent of GDP, however, alcohol taxes fell from 0.215% to 0.057%, numbers that are harder to read and compare. The former measure shows more clearly the success of the beer, wine and the liquor lobbyists over the decades.
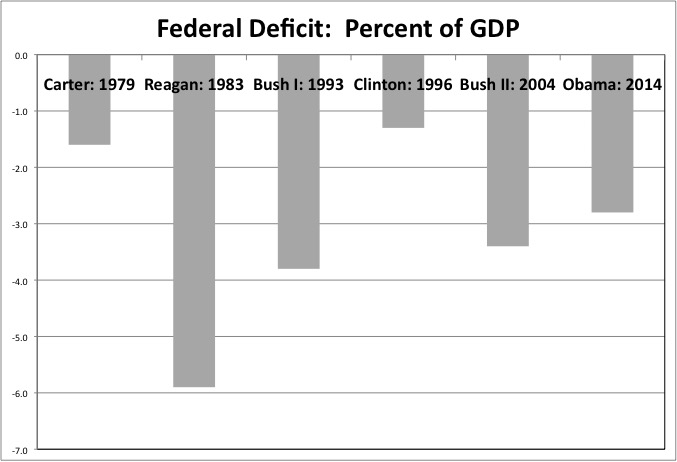
The massive deficits incurred during most years of the Obama Administration were caused mostly by the Great Recession, and its related plunge in federal tax revenue and surge of social services spending. The surpluses of the late Clinton Administration, similarly, could be attributed in large part to the excess tax revenues, notably capital gains tax revenues, thrown off by the 1990s stock market bubble – with soaring private debt taking the place of soaring public debt. Even so, for these years Clinton had the lowest benchmark deficit, and Reagan the largest.
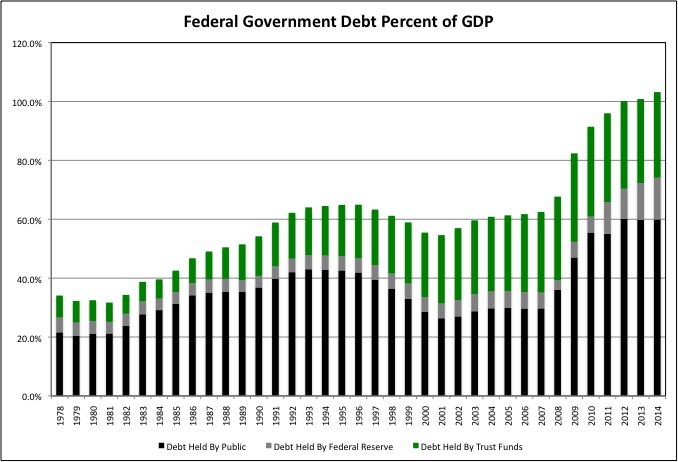
That, however, is just a year-by-year look. No matter how high federal taxes are increased, and how much federal spending is reduced, in the future, it won’t change the level of debt accumulated in the past. After peaking in FY 1993, the share of federal debt held by the public fell until FY 2001 and then increased only slightly until FY 2007. But given that these were the best fiscal years for the federal government, years with the whole Baby Boom working and GDP inflated by a debt-driven consumer-spending boom, that wasn’t good enough. Remember back in 2000, when all the extra payroll taxes working people were paying were going to put in a “lock box” and the rest of the federal debt was going to be paid off? That obviously did not happen.
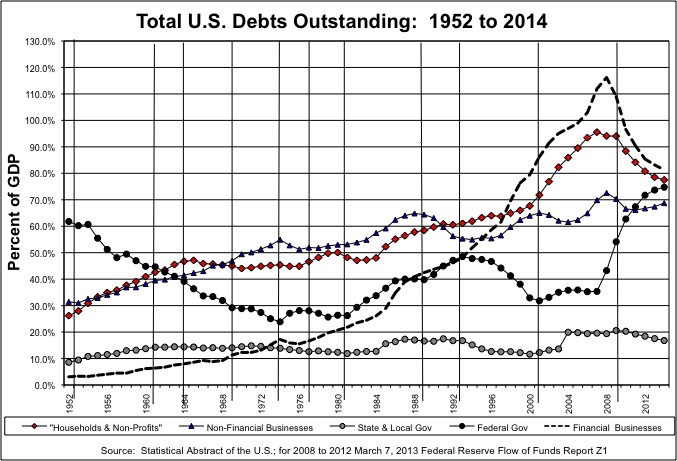
The huge structural deficit was exposed by the Great Recession, which marked the end of an unsustainable economic era. An era of total public and private debts soaring as a percent of GDP. And inadequate retirement savings.
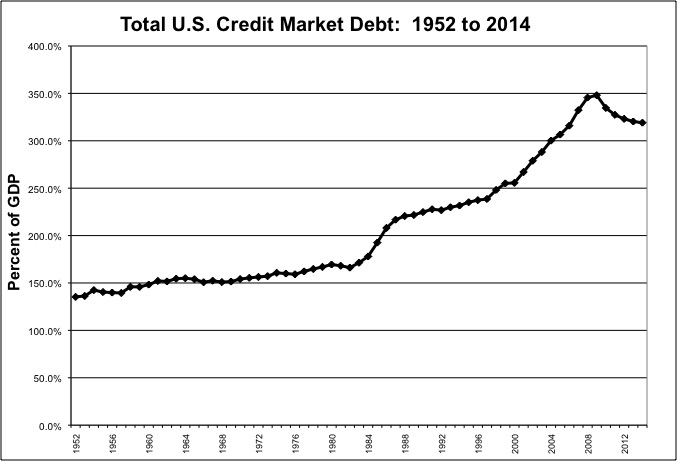
The federal debt soared as private debts plunged; if it had not the economy would have collapsed into a Great Depression back in 2009. Although one could argue that most Americans, particularly younger Americans, might be better off today if we just got it over with back then in a bonfire of bankruptcy.
Even 20 years ago everyone should have known what this country was facing. It was in the news. If you haven’t followed my link to the 1996 article “You Saved But They Didn’t So Now What” I suggest doing it now.
http://www.nytimes.com/1996/07/07/business/you-saved-but-they-didn-t-so-now-what.html?pagewanted=all
When the debt bubble burst and, Americans found that businesses had been selling them far more than they been paying them, people could no longer borrow the difference, and our diminished future arrived. We are now facing soaring federal old age benefit costs — with a total federal debt that is already more than 100 percent of GDP. And debt held by the general public is double the percentage of a decade ago – and nearly triple the level under President Carter. And that is just federal debt. After three decades of importing more than we export, the United States is by far the most indebted country on the planet, with a population that is, in general, as deep in debt as its governments.
This is what this election should be about. How did we get into this mess? Who reaped most of the benefits? Why should younger generations, generations that have been left poorer, be the ones to make all the sacrifices? Shouldn’t Generation Greed give something back? Shouldn’t many of its members, those that care about their own children, want to?
No one dares to say any of this. I’d have to say that Senator Clinton is looking best right now, as far as I’m concerned. Why? Because unlike the other candidates I haven’t heard of her phony promises to hand out goodies, when “Blood and Tears” speeches are called for. Perhaps there are not. Perhaps she can’t tell the truth, but doesn’t want to lie too much either, so she really isn’t saying much of anything. “Vote for Hillary, she’ll competently manage things getting gradually worse without turning them into a full-blown short-run disaster for as long as possible?” That doesn’t sound, except when compared with the alternatives.
If you are under age 60, note that every candidate plans to harm you exclusively to pay for benefits that others received, and will receive, and you will receive less of. If you are under 40 you are already worse off than that, and unless I see some set of proposals that adds to something other than a big negative, I would expect you to be made worse off still. Because those under 60 and, in particular those under 40, have “time to adjust.” By dying off young for example.
https://larrylittlefield.wordpress.com/2015/11/08/death-is-the-ultimate-statistic-ii-the-most-important-news-in-ten-years/
Everyone in those younger age groups should be realistic about their future, try to adjust, and try to manage as best they can. Many are doing so, particularly those who entered adulthood after 2000. But they should also be also mad as hell about what has gone on, and rising up to demand that the beneficiaries of past policies be first in line to give things up.
And I don’t mean the Chinese, Mexicans and Muslims. They didn’t run up those federal, state, local, business, financial and personal debts. We did. Some of us were smart enough, and humble enough, to realize that some of the extra we were getting was being taken from our children, our grandchildren and, if we were born in 1958 or after, our own futures, and acted accordingly. And some did not. Regardless of where you fall in the generational equity spectrum, it’s time to start facing the facts.
You can start by looking at the facts, starting with my next post on historical federal revenues. Learn from the past, because in this phony federal campaign nobody has any idea other than to try to repeat it. Because ignorance is their power tool.