
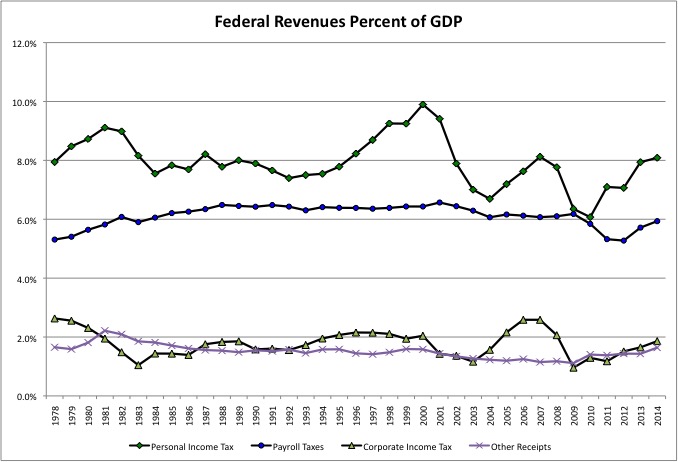
The past 35 years or so have seen a persistent history with regard to federal tax revenues. Republicans, who have dominated the federal government for most of that time, have cut the taxes that fall more heavily on businesses and the wealthy, the personal and corporate income tax. And then following a fiscal disaster and soaring deficits, Democrats increased those same taxes. In the end the personal income tax ended up, as a percent of GDP, about where it was – at 8.1% of GDP in FY 2014 compared with 7.9% of GDP in FY 1978. While the corporate income tax ended up lower, at 1.9% of GDP compared with 2.6%. This is true even though profits account for a higher share of GDP today than they did in 1978, and work earnings at the top account for a much higher share of total earnings, factors that should have increased personal and corporate income tax revenues as a percent of GDP even with the exact same rules.Как сделать гаражные ворота своими руками
Payroll taxes, meanwhile, were substantially increased by the Republicans and never reduced, save for a special exemption in the Great Recession. These taxes fall exclusively on work income in the United States, and more heavily on the working and middle classes. The wealthy pay less, as a percent of their income, the retired do not pay at all and, with regard to international trade, work done in the United States is subject to the tax whereas goods imported from abroad are tax-free. The payroll tax burden increased from 5.3% of GDP in FY 1978 to 6.5% in FY 2001. Before falling to 5.9% in FY 2014, after the share of Americans working and average work income plunged in the Great Recession. Other federal revenues, such as excise taxes, estate taxes, and customs duties totaled 1.7% of GDP in FY 1978 and 1.6% of GDP in FY 2014, although the composition of this category has changed. These trends are discussed in more detail below.
This is the second post in a series on federal revenues and expenditures as a percent of GDP (or per $100,000 of GDP). The first post, with an attached spreadsheet with the data in tables, is here.
https://larrylittlefield.wordpress.com/2016/02/09/the-phony-federal-campaign-and-our-real-future/
It discusses federal revenues, expenditures and debt in total and explains why the data is presented the way it is. This is a more detailed post about federal revenues. But before talking about each revenue source individually, let’s briefly review the share of total federal revenues accounted for by each source today.
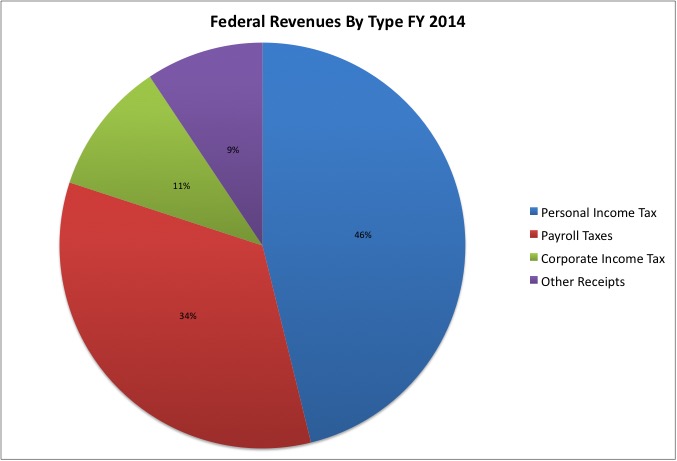
Personal income taxes accounted for nearly half of federal revenues in FY 2014, with the payroll tax accounting for more than one-third. The payroll tax is sometimes classified as “insurance trust” revenue, since it was promised that it would be used exclusively for social insurance programs such as Social Security for seniors, Social Security for the disabled, Medicare, unemployment, etc. That was the justification for a tax that fell more heavily on you the less you earned – that it isn’t really a tax, it is more like an insurance premium. Whether it is “trust revenue” or just a regressive tax depends on the extent to which you can trust the federal government.
Other sources of revenue are less significant, accounting for only one-fifth of the total between them. The corporate income tax accounted for 10.6% of total revenues in FY 2014, and all other revenues accounted for 9.4%. Like the payroll tax, many federal excise taxes fall more heavily on the less well off. They tend to fall into two categories. “Sin taxes” that are supposed to offset the social damage caused by certain personal choices and discourage them, such as taxes on alcohol and tobacco. And “trust fund” taxes allegedly dedicated to particular purposes, such as ground or air transportation.
Of course there is one other revenue source that is not shown, but has been a large source of funds throughout recent decades. Borrowing.
Unfortunately, annual data on personal and corporate income taxes as a percent of GDP do not accurately convey the long-term impact of policy decisions by the President and Congress. Not only are such tax revenues also affected by the economic cycle, and thus the level of GDP, but they also tend to lag that cycle, with changes in revenues years after the decisions and conditions that caused them.
This is because of the way taxes on capital gains and profits are collected. When the economy is up, wealthy people and corporations can use complex accounting to hide how much they are making in the short run, shifting that income to the future. So tax revenues generated by a boom keep rolling in for a while after it ended.
On the other hand, when wealthy people suffer losses on their investments and businesses lose money, their taxable income often falls to zero or less. These losses can also be shifted forward to offset future gains. There are annual limits on the extent to which individuals are allowed to deduct their investment losses against the other income they received. They aren’t able to “take credit” for all the money they lost in just one year. So for years after a recession and bear market in stocks, personal and corporate income tax revenues are lower not because of money lost at the time, but due to money lost years earlier.
Thus, all the arguments about the effect of changes in tax policy are subjective. Since they can’t really be measured in isolation, experts with models based on assumptions have to decide those effects both before and after the fact. And those models and assumptions can be biased.
Still, the history of federal tax policy does show up in the line chart. Take the personal income tax, for example. Late in the term of President Jimmy Carter taxes were soaring as a share of GDP, not because tax rules were changing or the economy was booming but because inflation was high and the federal tax brackets were not adjusted for inflation. In the early 1960s someone with a $10,000 per year income was in the upper middle class, and had made it big, but by the late 1970s that level of income only bought a working class standard of living. And yet the tax percent on $10,000 was not changed. More and more working people were taxed as if they were well off.
“Indexing” the personal income tax brackets for inflation was one of the changes in the massive federal income tax cut put though by President Ronald Reagan in 1981, then described as the biggest tax cut in history. In addition, the highest marginal tax rate assessed on the last dollar of income earned by the wealthiest was cut from 70.0% to 50.0%. Today, the highest federal tax rate is imposed on taxable income in excess of $413,240. It is 39.6% of the taxable income in excess of that amount. The low point for the top rate for the personal income tax was just 28.0% in the late 1980s, after the bi-partisan tax reform of 1986 that also eliminated nearly all tax breaks.
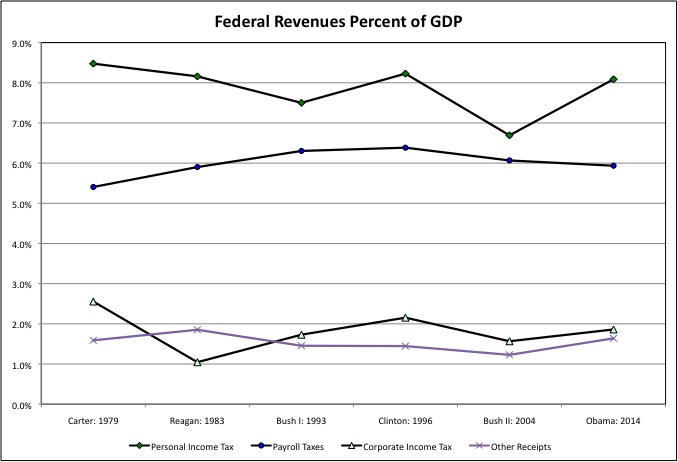
The Reagan tax cuts were phased in, so by the reference year of FY 1983 the personal income tax burden, at 8.2% of GDP, was only slightly lower than it had been in FY 1979, the reference year for President Carter, at 8.5% of GDP. Thanks to a weaker economy and higher spending in categories such as national defense, however, the federal government ran huge budget deficits in the 1980s. President George HW Bush and Congress agreed to increase taxes in 1990, something that Bush I had promised not to do, leading to him becoming the most recent one-term President. But thanks to the weak early 1990s economy and the lag before an upturn affected tax revenues, personal income tax revenues fell to just 7.5% of GDP in FY 1993, the reference year for Bush I.
The administration of President Bill Clinton increased personal income taxes during his first term, and the tax burden edged up to 8.2% of GDP in FY 1996 as a result. Still lower than the reference year for Carter, and the same as FY 1983, the reference year for Reagan. Because the personal income tax falls more heavily on the wealthy, the economic boom of the late 1990s – which saw the wealthiest capture a large share of the economic gains — also caused personal income tax revenues to soar.
The Clinton Administration, however, did something else that has proved not to be temporary. It reversed the bi-partisan tax reform of 1986 by re-introducing all kinds of tax breaks, credits and deals to offset those temporarily increasing revenues. A lower rate for capital gains turned out to mostly benefit the rich, although like the Reagan tax cuts it was supposed to increase “savings and investment.” Ever-increasing deductions primarily benefitted the upper middle class, since for the middle and working classes they never added up to enough to be worth more than the standard deduction. The 1990s were the heyday of the yuppies, and the Clinton Administration was a yuppie administration. And some tax credits benefitted the poor.
The Republicans went along with all this, because of the stupid idea that handing out money via tax breaks and credits is “small government” because the money never hits the government’s books, while just collecting revenues and then spending them on the same things is “big government.” At the time they were also advocating the idea that forcing people to spend their own money via a mandate is “small government” while collecting a tax and then spending money on the same purpose is “big government.” Coincidently tax breaks tend to benefit the better off, at least up to the point where tax law phases them out, and mandates fall more heavily on the worst off.
As soon as tax revenues increased again under Democratic President Clinton, they were slashed again under Republican President George W. Bush. The tax cuts under Bush II in the early 2000s slashed personal income tax revenues to a lower point, as a percent of GDP, than they had ever been under President Reagan. In FY 2004, the reference year for Bush II, personal income tax revenues totaled just 6.7% of GDP.
The Democrats still controlled the Senate during the first of the Bush II tax cuts. They went along because the tax cuts were temporary. Thus while the 1960s generation would pay lower taxes during its high earning years, taxes would be automatically increased on the younger generations to follow. Helping to pay for the soaring cost of senior benefits those born before 1958 expect to receive.
After President Barack Obama allowed the Bush II tax cuts to expire, personal income tax revenues increased back to 8.1% of GDP in FY 2014, similar to the 8.2% in FY 1996 under Clinton though less than the 8.5% of GDP in FY 1979 under Carter.
Back and forth, back and forth. In the end, what does it all mean?
Keep this in mind. People’s income tends to vary over their lives in a predictable pattern. It is low when they are young, peaks in middle age after they are trained, perhaps have some savings, and are fully integrated in the work force, and decreases again when they are older, less productive or no longer working, and drawing down any savings they may have. When you decrease taxes at one point in time, and then increase them at another point, the people who benefit from the tax break are NOT the same people as those who pay more later on.
The lower personal income tax burden in place for most of the years from 1981 to 2013 primarily benefitted those who were in their peak earning years at the time. Unless taxes are cut again, younger generations, who are less well off on average, will pay a higher percent of their income in federal income taxes. And regardless of how much they pay, all those personal income tax revenues that weren’t collected between 1981 and 2013 can’t be collected now. They are gone, with debts in their place. And yet the generations that benefitted from lower taxes in the past are now approaching an age when they expect to receive massively expensive old age benefits.
The large generations in the prime of their careers from 1981 to 2013 did pay lots of payroll taxes on their cash work earnings. More than any generation before, as a result of the 1983 Reagan Tax increase, described as the largest in U.S. history, which workers were told would “Save Social Security” for them. In FY 1979 the payroll tax rate for Social Security and Medicare was 12.26%, with half assessed on the employer and half assessed on the employee, up to a certain wage level. The self-employed, who paid both halves, got a break and only paid 9.55%.
But under the 1983 tax increase the self-employed were forced to pay as much as the employee and employer share combined, and this was increased to 15.0% of wage income starting in 1990. With the 2.6% Medicare portion assessed from the first dollar of income to the last. The later you entered the labor force, therefore, the higher your federal payroll tax burden has been.
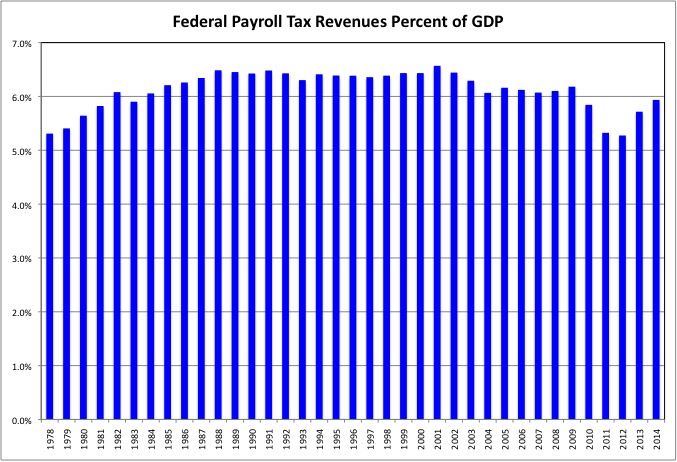
Payroll tax revenues increased from 5.4% of GDP in FY 1979 under Carter to 5.9% in FY 1983 under Reagan. With a higher and higher share of Americans in the workforce and higher tax rates, this increased further to 6.3% in FY 1993 under Bush I and 6.4% in FY 1996 under Clinton, although the rules remained the same. In fact, federal payroll tax revenues were between 6.3% and 6.5% of GDP every year from 1986 to 2003. The only payroll tax cut workers even received was a temporary one during the Great Recession, when the employee share of the tax was temporarily reduced under the Obama Administration.
The main points about the payroll tax are this.
During the fat years for Americans at work, payroll tax revenues were much higher than was required to pay Social Security, Medicare, and other benefits. So the excess revenues were used to pay for the rest of the federal government, and offset the personal income tax cuts in effect for most of that time. If the payroll tax is just a tax there was a huge shift of the tax burden from the progressive personal income tax to the regressive payroll tax. If it is not just a tax the rest of the federal government owes the Social Security Trust Fund $billions, but those who ran up that debt are not going to pay it back. Future generations are.
https://larrylittlefield.wordpress.com/2015/01/10/reprised-social-security-the-generational-betrayal/
Moreover, payroll tax revenues are now falling as a percent of GDP, to 6.1% in FY 2004, the reference year for Bush II, to 5.9% of GDP in FY 2014, under Obama. Despite the fact that the payroll tax burden on the wage income of moderate and middle-income workers has not changed since the huge Reagan tax increase. And this downward revenue trend is likely to continue unless the rules are changed.
The reason is that moderate- and middle-income wage earners are capturing less and less of total U.S. income. And thus a higher and higher share of GDP is going to categories of income that are exempt from the payroll tax.
Retirement income is not subject to the payroll tax. Today’s retirees are the best off in history, and the best off among them are those who benefitted from the personal income tax cuts of the Reagan and Bush II years. And with the Baby Boomers retiring, there are more and more of them relative to the number of workers.
The payroll tax, and the fact that they don’t have to pay it, is why the best off retirees pay a lower share of their incomes in federal taxes than struggling workers with lower incomes.
https://larrylittlefield.wordpress.com/2015/03/04/taxes-generational-equity-federal-taxes-in-2014/
Non-wage benefit income is also not subject to the payroll tax (or, for that matter, the personal income tax). Politically powerful unionized public employees get for more of those benefits than other workers. And because these workers received promises of huge future income – in retiree health insurance and pension benefits – that were not funded while they were working, the share of government spending going to these benefits has soared relative to the share going to wages. The wages subject to the payroll tax. The trend of more money for retired public employees and less for working public employees is also seeing public services cut around the country.
Investment income is not subject to the payroll tax. Those with the most investment income are the wealthy, and many of the wealthy have been allowed to disguise their work income as capital gains income. Benefitting not only from the payroll tax exemption but also from a lower tax rate under the personal income tax. As the share of GDP accounted for by profits has increased, and the share accounted for by work income has fallen, payroll taxes have been pushed down as a percent of GDP.
The payroll tax is why, as Warren Buffett points out, just about every CEO has a lower marginal tax rate than their secretary. For a reasonable argument as to why a lower capital gains tax, or even no capital gains tax, is fair. And an explanation as to why that argument has turned out to be fraudulent. Read this.
http://r8ny.com/2010/02/13/the-capital-gains-mass-tax-fraud/
Finally, cash earnings in excess of a certain amount, currently about $117,000, is exempt from the Social Security portion of the payroll tax. Which is to say the payroll tax rate on work earnings above $117,000 is just 2.6% plus unemployment tax, not 15.0% plus unemployment tax. With a higher and higher share of total cash earnings in the economy concentrated at the top, more and more of it is above that cutoff, and thus exempted from part of the payroll tax.
All those who have become better and better off in this country over the decades are exempted from the payroll tax. Those who become worse off, despite paying more than people did before the Reagan tax increases, are told that they will have to accept less in old age retirement benefits, because there is less money to go around. Or dishonestly not told they will have to accept less by the political party not yet willing to admit it.
As far as I know, that party’s only solution anyone is to lift the cap on cash work earnings subject to the Social Security portion of the payroll tax, a huge tax increase on those earning (currently) more than $117,000. Leaving the wealthy and their investment income, unionized public employees and their rich benefit income, and Generation Greed and their retirement income exempt from this greater sacrifice.
In one cynical variation Bernie Sanders, who also wants to increase Social Security benefits for today’s seniors, has proposed maintaining the zero Social Security payroll tax rate on cash income between $117,000 and $250,000, but also imposing the higher rate on work income in excess of $250,000. Why not tax income between $117,000 and $250,000 too? So the yuppie class, the professors, lawyers, top government bureaucrats, top union leaders, and most top non-profit executives, would not have to pay more. Would not have to pay as much as moderate- and middle-income workers, as a percent of their income.
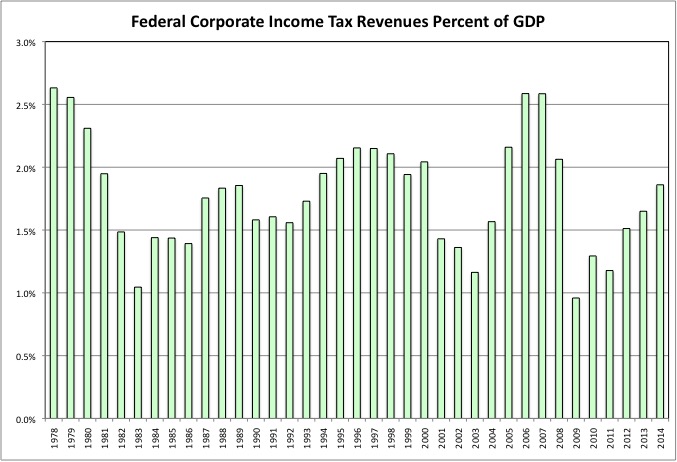
Corporate income tax revenues are extremely volatile, soaring and plunging with the economy. Over the long term, however, they have followed the same trend as the personal income tax. Tax cuts under Republicans followed by increases – though not quite to the same level as before – under Democrats. With the long-term trend being down. And fewer tax breaks and lower rates after the mid-1980s tax reform, followed by additional tax breaks and (despite lower revenues) higher rates thereafter.
Federal corporate income tax revenues fell from 2.6% of GDP in 1979, the reference year for Carter, to just 1.7% of GDP in FY 1993 (Bush I), before rising to 1.7% of GDP in 1996 (Clinton), falling to 1.6% of GDP in 2004 (Bush II), and rising back to 1.9% of GDP in 2014 (Obama).
Many on the right believe the corporate income tax should not exist at all. After all, they say, when corporate profits are eventually paid to people, that income is taxed under the personal income tax, so the corporate income tax represents double taxation. That argument is much less valid given that investment income is not subject to the payroll tax. The payroll tax means work income is also taxed twice at the federal level. And investment income is also given a lower, preferential rate under the personal income tax, compared with work income.
In exchange for paying the corporate income tax, moreover, corporations receive limited liability, allowing them to make large profits for years, but then dump unfunded burdens on the general public when they later go bankrupt or require a bailout. They are allowed to privatize the now profits, and later socialize the losses later. No one is getting back the money the airline industry earned prior to its bailout after 9/11, the auto industry earned prior to its bailout in the Great Recession, or Wall Street earned prior to the financial crisis.
The general public is still absorbing those losses. In fact, given all the off-the-books contingent liabilities the federal government incurred to (temporarily) prevent housing prices from plunging to a level that would match the lower incomes of younger generations, I worry about what those losses will be.
Some believe that Wall Street firms acted recklessly precisely because they were limited liability corporations. Prior to the 1980s they were partnerships, and if they went under their creditors would have been able to go after the personal assets of the partners. Today’s Wall Street executives take as much out of their firms as they can get, and walk away laughing with their piles when the house of cards collapses.
There is one other point about corporate income tax revenues. By playing different states off against one another, and in particular low-tax southern states off against higher-tax northern ones, corporations managed to get state corporate income tax revenues down from $4.04 per $1,000 of personal income in FY 1992 to $3.01 per $1,000 of personal income in FY 2012. While working people voting Republican might have seen themselves as the winners in that game in the past, however, today global corporations are now playing entire countries off against each other in pursuit of a lower corporate tax burden. To say that someone from New York finds complaints about this in the Red States to be a little disingenuous is an understatement.
There are two key points about most federal excise taxes.
The first is that in general they are not assessed as a percent of dollar values. The personal income and payroll taxes are as percents of money income received. As the straight dollar value of income and prices rise due to inflation, tax revenues rise as well, although perhaps not as a percent of GDP. State sales taxes, in general, are as a percent of money spent. As more is spent — not in a real sense, but simply as a result of inflation — sales tax revenues rise as well.
Federal excise taxes, on the other hand, are fixed. Unless the rules are changed, even low inflation tends to make the worth less and less over time in terms of what they can buy. This means that not only is a new vote required to increase taxes, but also just to keep them – in a real sense–from falling. Kind of like the minimum wage.
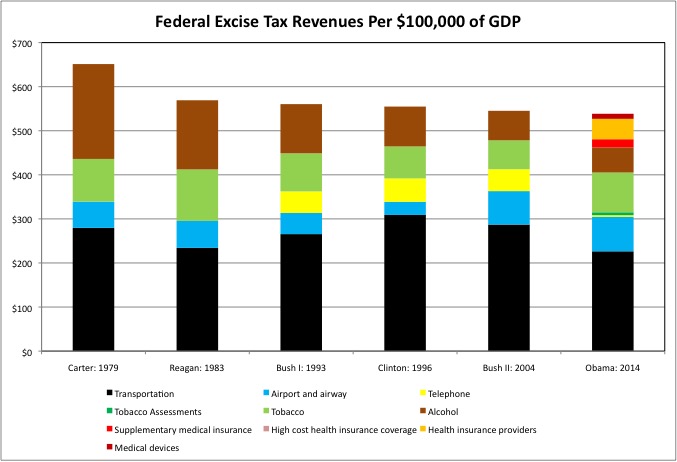
Take the federal alcohol tax, for example. Since 1991 it has been set at $13.50 per proof gallon of alcohol in liquor, $1.07 in gallon of in wine that is less than 14%, more for wine than is more that 14% alcohol or sparkling, and $18 per 31 gallons of beer. The prior increase in the tax rate had been in 1951. Obviously beer, wine and liquor cost more today than they did in 1991, but the tax rate per gallon or gallon proof is the same. As a result federal alcohol tax revenues fell from $215 per $100,000 of GDP in 1979 (Carter) to $157 in 1984 (Reagan) to $112 in 1993 (Bush I) – and on to just $57 in 2014 (Obama).
The tobacco industry, on the other hand, was unable to ward off a large increase in the tax per pound in 1991, and other assessments have been imposed on the product. As a result federal tobacco revenues in 2014, at $97 per $100,000 of GDP, were the same as in 1979. Perhaps marijuana will become the next great federal revenue hope like alcohol was during the Great Depression (and right after the American Revolution, which is why it was followed by a Whiskey Rebellion), and make up for those diminished alcohol revenues.
The second key point is that since excise taxes fall more heavily on people who earn less, to get the public to accept them politicians often promise they will be used for a particular purpose. But as is the case when New York and New Jersey politicians have raided funds dedicated to transportation over the years, they lie. As NY Governor Cuomo said when using the Metropolitan Transportation Authority’s dedicated taxes, only collected downstate, for general operations “money is fungible.”
The federal excise tax on gasoline was last increased in 1993, from 14.1 cents per gallon to 18.4 cents per gallon. That temporarily provided a much higher level of real revenues “for transportation” during the Clinton Administration. But like the higher payroll tax revenues after the Reagan payroll tax increase, these were diverted to fund the rest of the federal budget.
Inflation has since slashed the real value of the gasoline tax. The real value of the 18.4 cents per gallon today is only worth 11.2 cents per gallon back in 1993, in terms of what it can buy. People are burning more gas, but federal transportation tax revenues fell from $265 per $100,000 of GDP in FY 1993 under Bush I to $226 under Obama. So money has been transferred from the general federal budget to keep transportation expenditures from falling as a percent of GDP by even more than they would have, with increasingly ridiculous deals used to make up the shortfall.
In addition to the downward drift in the gasoline tax, the federal telephone tax was mostly repealed in 2006. On the other hand, a host of health care excise taxes were imposed to help pay for Obamacare. One of these, the “high cost health insurance tax” has yet to be collected. Whether these additional taxes will be used for health care, as promised, or diverted remains to be seen. And how Obamacare would be funded if the “high cost health care tax,” a tax that falls on those with the richest benefits, is repealed also remains to be seen. Even with these additional excise taxes, however, the long-term trend is for federal total excise tax revenues to fall as a percent of GDP.
The federal government also has a number of miscellaneous revenue sources that have been a bone of contention over the years.
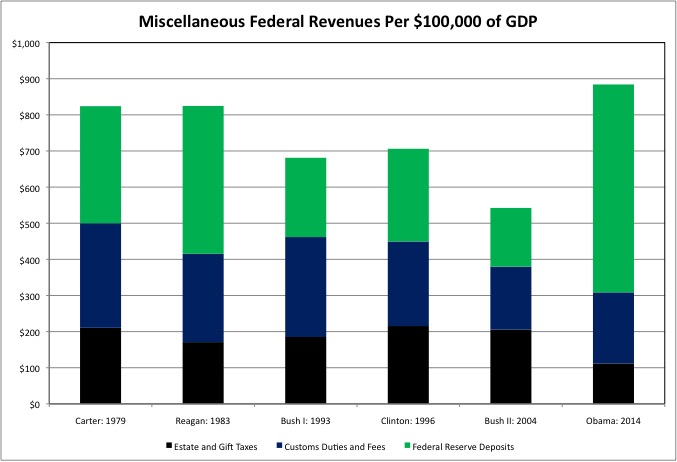
The first is the federal estate and gift tax. Those on the right want to get rid of it. So that the very wealthiest families can more easily accumulate more and more wealth and power over the generations, and gain more and more control over everyone else’s potential place in society. As in many Third World countries. Although they don’t say so. The Republicans managed to get the estate tax eliminated for one year, only for those dying in 2010, surely one of the stupidest tax policies of the past 100 years.
The two main components of the estate tax are the amount of total assets that are exempt from it, and the percent the government takes over that amount. The tendency has been for the exempted amount to go down, making more people subject to the estate tax, but the for rate to fall, reducing the take from the very richest.
Currently estates are exempt from the tax up to $3 million. From 1940 to $1976, however, the exempted amount was $10 million. And $10 million in 1976 is the equivalent of $41.7 million today. So adjusted for inflation the amount of money exempted from the tax fell from $41.7 million in 1976 to $3 million today. And since that $3 million, unlike the federal personal income tax brackets, is not adjusted for inflation, it goes down in real dollars every year there is inflation, forcing more estates to pay the tax. On the other hand the tax rate was 77.0% from 1940 to 1976. The government kept most of the inheritance. The rate was cut to 55.0% under Reagan, and is now 45.0%.
The rich, however, have ways of shielding money from the estate tax, putting it in various trusts for example. There is a whole industry to help them do so. Perhaps as the result of more and more exploitation of more and more of these loopholes, federal estate and gift tax revenues, which had been around $200 per $100,000 of GDP in the benchmark years of most recent Presidents, fell to just $112 per $100,000 of GDP in FY 2014 under President Obama. A huge drop that cannot be explained by the exemption level and tax rate alone.
The share of federal revenue accounted for by the estate tax is small. Its importance is social, political, and philosophical. During the past 35 years the generations in charge, those I have identified as Generation Greed, have acted to make themselves better off at the expense of making those coming after worse off. In the economy, in public policy, and in family life. About the only public policy under discussion during the past 20 years that is actually favorable to the next generation has been the drive to reduce the estate tax, or what its opponents call the “death tax.”
I look at it this way. The richest members of Generation Greed are well aware that collectively they are leaving those following with a diminished future. And they are desperate to exempt their own descendents from the consequences of this poisoned collective legacy by gifting them a pile to offset it. Whereas the Greatest Generation wanted to build a better country for its children, in other words, wealthy members of Generation Greed are desperate to assure some kind of future for their children, and only the own children, in a country they have diminished.
As people reach the end of their lives, moreover, many have one of two outcomes. They may die rich and bequest an inheritance that is taxed, putting money into the government. Or they may require nursing home care that leaves them broke, and sucking money out of the government.
Observing the end for older relatives, it appears to me that close families can generally care for their own despite severe physical disabilities, nearly up until the very end. But mental disabilities leave people in need of round-the-clock care that is more than family members can provide. And only the wealthiest can pay for nursing home care for any length of time before relying on the government.
Ironically, at the very moment when increased breaks and loopholes are apparently reducing the government revenues from those who die fortunate, social and health trends are threatening to push government nursing home costs into the stratosphere. First, the children of fractured families are less likely to feel the obligation to make the sacrifices required to care for aging relatives who did not put them first during their youth. As described here.
https://larrylittlefield.wordpress.com/2014/08/13/generation-greed-and-the-family/
And second, unlimited publicly financed health care for seniors, far in excess of that promised to those under 65, make it likely that more and more people will outlive their brains.
Another revenue source on a downward trend, despite booming international trade, is customs duties on imports. During most of the 1800s such tariffs were as the most important source of revenue for the federal government, but they are now a footnote. In general, in fact, tariffs have been falling for all countries due to international trade agreements.
There is, however, another type of tax that discourages imports and encourages exports. It is a tax that every major economy has — except for the United States. A value added tax (VAT).
http://www.uscib.org/valueadded-taxes-vat-ud-1676/
The federal payroll tax is assessed on work done in the U.S. If workers produce something here, both they and their employers owe payroll taxes — whether the good or service produced is consumed within the country or exported abroad. But if a company relocates its operations outside the United States no payroll tax is assessed, because there are no workers paid inside the United States. The goods and services come into the U.S. payroll tax free – and with lower customs duties over time.
Other countries’ value added taxes, in contrast, are assessed on goods and services consumed within the country – whether produced there or imported. China’s VAT rate is 17%; Germany’s is 19%, India is 13.5%. Japan has a 5% consumption tax. Ireland, where many U.S. companies are (on paper anyway) moving their headquarters to avoid federal corporate income taxes, has a 23.0% VAT rate.
All goods and services imported from the U.S. (or elsewhere) are taxed at these percents of their value. It isn’t a customs duty of tariff because the same VAT is applied to all goods and services consumed within the country, whether imported or not. Unlike a custom’s duty, the VAT does not provide an incentive to produce something within the country for local consumption. Unlike the payroll tax, however, the VAT provides no incentive to produce something in another country and then import it for local consumption.
How does the VAT treat goods exported out of the country, TO the U.S. for example? Companies get VAT tax refunds from the government on exports, since exports are exempt from the tax. If a company paid $1 million in VAT on its value added, and exported all its goods and/or services, then the Chinese, German, Indian, Japanese or Irish government would give that company a refund check for the entire $1 million. How’s that for an incentive to export?
I’ve learned over the decades that tax incentives don’t do as much to change behavior as economists, who think people are rational, might believe. Culture matters more. Prior to the Reagan Administration, for example, all consumer interest (not just mortgage interest) was eligible for a tax deductin to encourage borrowing and spending, while savings and investment income was heavily taxed. The claim was made that these incentives were responsible for the low U.S. savings rate of just 8 percent, lower than in other developed countries at the time. But then after consumer interest (other than mortgages) was made fully taxable, and all kinds of tax breaks (IRA, 401K, 529) were added for savings, the U.S. savings rate…fell to zero. Consumerist culture, driven by the advertising and credit card industries, and the housing bubble had trumped public policy via the tax code.
Even so, when you look at the incentives created by the U.S. payroll tax and other countries’ VATs, no wonder Americans are the people everyone wants to sell to — but no one wants to employ. The lack of a VAT makes goods and services more expensive in the U.S. than in thriftier countries, while the payroll tax on work is an incentive to have the work done somewhere else whenever possible.
Come to think of illegal immigrants working off the books, and those that employ them, don’t pay the payroll tax. But those immigrants would pay a VAT when they spent their money unless everything they bought, and everything else used to produce what they bought, was also off the books.
There is one additional source of federal revenue that isn’t really there yet, but could be. How about having the Federal Reserve just create money, and having the federal government spend it? After all, isn’t that what was done in the Great Recession to prevent the banking system from collapsing? Then why not print money to pay for tax cuts, or more spending on the poor?
I’ve seen this point argued on a transportation blog by a person who seems to be a blast from the past – an eyes closed, mouth open, 1890s leftist. But there are appeals to the right too. Don’t tax the rich. Print money instead. The rich can shift their wealth out of the dollar and avoid the consequences — if capital controls are not imposed, as they often are in Third World countries with worthless currencies. If high inflation were to occur, indexing could be used to make sure that unionized public employees with contracts and the Social Security income of today’s seniors kept up. Powerless workers would be the only ones affected. Printing money is a revenue source no politician had to vote for and take the blame for.
That’s how the U.S. could be come even more like Argentina. There were, after all, both “left wing” and “right wing” Peronist populists there. Eventually they started shooting each other and making people disappear. I’ve often said Argentina is one place I’d like to travel, to get a glimpse of our future.
As of now, the rest of the federal government is earning more money transferred from the Fed’s balance sheet, as a result of its drastic expansion by quantitative easing in response to the Great Recession. In fact, transferring money from the Federal Reserve is how the Congress managed to fund this year’s transportation expenditures despite the falling gasoline tax.
But the rest of the federal government also owes the Federal Reserve a national debt equal to 14.2% of GDP in 2014, up from 4.4% of GDP under Reagan and Carter. So why not just net that out and cancel it? And if there is no political fallout, then have the Federal Reserve print money and buy up a bunch of federal debt a second time, and do it all over again?
Insane? Perhaps. But is the current Presidential campaign, particularly on the Republican side, sane? This publication has been right before.
http://www.economist.com/news/finance-and-economics/21600142-central-banks-will-be-financing-governments-permanent-basis-now-you-see-them