
As noted in my prior post, the current New York City budget documents are being presented in a way that makes it more difficult to compare the proposed level of expenditures, by agency, for FY 2017 with the level of expenditures in the past on a basis that includes the cost of pensions and other fringe benefits. Press coverage of the budget, therefore, has apparently been limited to the story the Mayor wanted to tell, in the little initiatives and cutbacks the press release chose to highlight. A more complete picture emerges when the latest budget documents are compared with those from past fiscal years, a comparison I made in the tables in this spreadsheet.
The cost of city government continues to rise relative to the income of city residents, as public employees continue to get richer and richer — relative to those who pay their bills. Richer mostly in the form of increased retirement benefits, benefits which are not appreciated when these employees are working. This pattern, established prior to the DeBlasio Administration, has continued during it, along with an increase in spending concentrated on one of the departments for which NYC spending was already high relative to other places. And the tax increases and service cuts are bound to get worse when there is no longer a stock market bubble and excess profit and compensation on Wall Street to cover it up. A series of charts follows.
The change in a dollar value in the city budget relative to the past only makes sense when adjusted for inflation, which all the figures to follow are. And compared with the income of the people who have to pay for it. As I noted in the prior post…
According to the Mayor’s optimistic estimate of NYC residents’ personal income in FY 2017, it will have increased 14.5% (adjusted for inflation) from FY 2007. In total, not per person, with population growth accounting for a good deal of the increase. And according to the Mayor’s budget proposal, NYC spending would have increased 23.8%, and city-funded spending will have increased by 29.9%, if the Mayor’s budget is adopted as proposed.
The way things are going, FY 2007 to FY 2017 may very well represent peak to peak in the economic cycle, with the income of city residents falling from there. If city spending increases faster than the income of city residents, those city residents are forced to give up a higher share of that income to pay for it, in city taxes, state taxes, or fees. If city employees and contractors become relatively richer, and people can’t pay more, they are instead forced to settle for less. What has happened, and usually happens, is a combination of both.
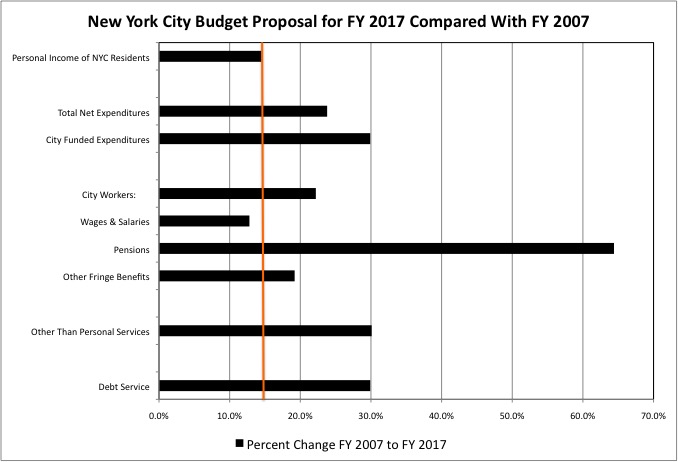
The data shows that total expenditures on city workers increased by 22.2%, adjusted for inflation, from FY 2007 to FY 2017, faster than the 14.5% increase in the total income of city residents. The total wages and salaries of city workers, however, increased by only 12.8%, while pension expenditures increased by 64.4% and other fringe benefit spending increased by 19.2%. This shows that a higher and higher share of the city budget is going to the retired, thanks to all the retroactive pension increases scored by the public employee unions over 20 years, followed by years of lying about the cost of those increases and putting it off.
A substantial share of the city’s budget is used to pay government contractors, particularly those related to the city’s infrastructure and non-profit social service agencies, and payments to the state for Medicaid. These contract and cash payment costs, along with the non-personnel costs of services provided by city workers (materials, supplies, vehicles, building rent, heat and electricity for example), collectively increased about 30.0% in real dollars from FY 2007 to FY 2017. Debt service spending increased by about the same percent. The increase in OTPS (other than personal service) spending, in the city’s categorization, will be discussed later.
Former Mayor Bloomberg had tried to force city workers to share in some of the sacrifices required by their soaring retirement costs, the falling income of taxpayers during the recession, and diminished city revenues from the rich and Wall Street, as part of the negotiation of the latest city contract. In response the city’s unions refused to share in any sacrifices at all, and instead waited until the DeBlasio Administration took over to cut more favorable deals. Even so, total personal services spending increased by 12.8%, adjusted for inflation, from FY 2007 to FY 2014, before DeBlasio took office. Despite wages and salaries rising by just 5.2%, as a result of the long-expired contracts and cuts in the number of city workers.
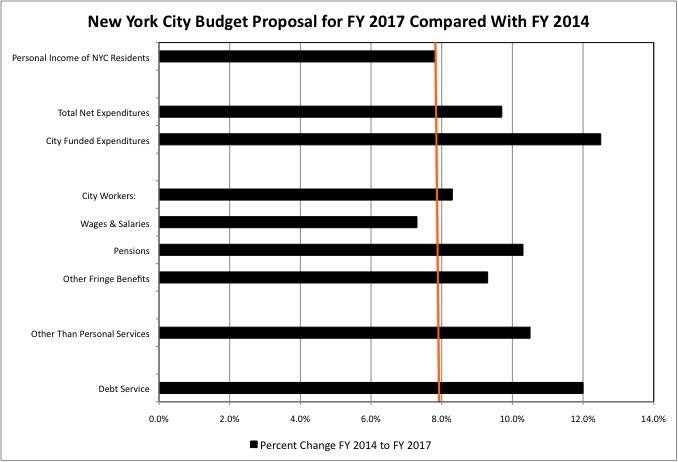
The FY 2014 to FY 2017 period, the first three years of the DeBlasio Administration, has seen an economic boom in the city, and the total inflation-adjusted personal income of city residents increased 7.8% during that period. Even with the new labor contracts agreed, the wages and salaries of city workers are expected to increase just 7.3% during this period, more in three years than in the prior seven but still less than the increase in the income of city residents. Even larger increases, however, will follow since most of the wage increases in the new labor contracts will not be paid until the Mayor is re-elected, perhaps during a recession, and do not yet show up in the data.
Despite the slow growth in wages and salaries, overall NYC personal services spending is forecast to rise by 8.3% more than inflation in the first three years of the DeBlasio Administration, faster than the income of city residents and still faster than wages and salaries alone. Pension contributions are proposed to increase by 10.3%, with other fringe benefits up by 9.3%. The shift to spending on the retired, rather than those working, is thus ongoing.
The increase in spending on OTPS in the latter years of the Bloomberg Administration has slowed under Mayor DeBlasio, according to a comparison with his FY 2017 budget proposal, with a 10.5% real increase compared with FY 2014 that is still higher than 7.8% the increase in the income of city residents. Debt service increased is projected to rise faster, with a 12.0% gain.
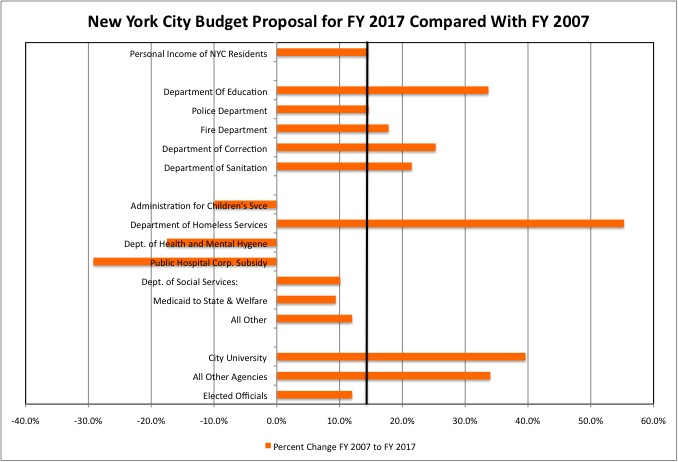
Under the Mayor’s budget not all NYC agencies would see their inflation-adjusted funding increase from FY 2007 to FY 2017, as proposed. Some, in fact, will have seen their funding cut from the peak of one economic cycle to the next, including the Administration for Children’s Services, the Department of Health and Mental Hygene, and the subsidy for the city’s public hospitals. Adjusted for inflation, under the budget proposal funding for these agencies would be down by 9.9%, 17.5%, and 29.2% of their FY 2007 budgets.
Despite Obamacare, which expanded Medicaid, the city’s Medicaid aid to the State of New York plus its cash welfare expenditures together would increase by just 9.4%, a smaller percent in real dollars than in the 14.5% increase in the total income of city residents over a decade. Other funding for the city’s Department of Social Services would increase 12.0%, also less than the projected income of NYC residents. Within the Health and Social Services category only the Department of Homeless Services is proposed to have had a higher percent increase in inflation-adjusted funding, at 55.3%, than the projected increase in the income of city residents over a decade.
On the other hand, the proposed FY 2017 funding for the Department of Education is up 33.7% from FY 2007, the uniformed agencies including police, fire, corrections and sanitation are up between 14.6% to 25.3%, the City University is up 39.6%, and “other” non-uniformed agencies are up 34.0%. All far more than the projected 14.5% increase in city residents’ total income.
These “other agencies,” lumped together in the table that also shows pensions and fringe benefit costs by agency, include most of the city’s general government agencies, its infrastructure agencies, and its public amenity agencies such as libraries and parks. As I showed using data from the Governments Division of the U.S. Census Bureau, NYC’s spending on and employment in government functions like these tends to be low to average compared with the U.S. average, its large transit system aside. Whereas its spending on Medicaid and social services, public schools, police, correction and sanitation is sky high. To understand how NYC compares with other areas, not just with itself in the past, one should look through the spreadsheets and posts linked here.
The Latest Public Finance Spreadsheets
While city agency spending in these “other agency” categories is proposed to have had a big increase from FY 2007 to FY 2017, city funding for the MTA capital plan is proposed to be slashed to just $125 million per year under the budget proposal. Despite what you may have heard in the press about Mayor DeBlasio and Governor Cuomo promising to fund that capital plan.
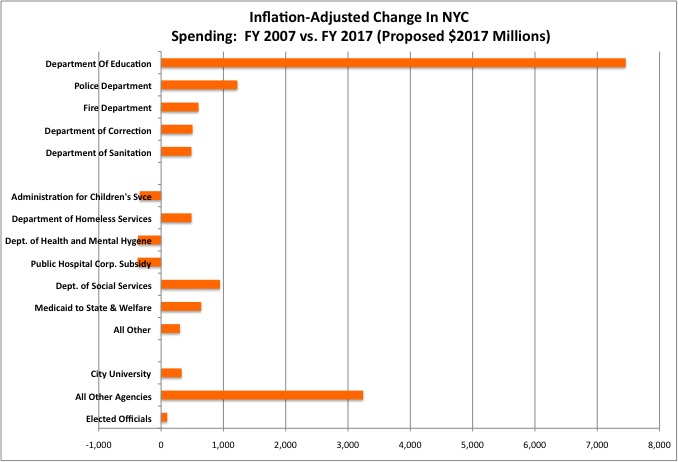
In dollar, rather than percent terms, the Department of Education is proposed to get nearly $7.5 billion more in inflation-adjusted funding in FY 2017 than it received in FY 2007, far more than the increase for any other agency or even all the agencies put together. Some of that is the result of the addition of universal pre-K, an actual improvement for many city residents, but most if it is higher inflation-adjusted funding for the same education services, or even less in education services, than a decade earlier.
The cuts to the Department of Health and Mental Hygene, the Administration for Children’s Services and the subsidy for the city’s public hospitals over a decade, as proposed, are about $1 billion in $2017. The uniformed agencies are collectively proposed to get $2.8 billion more over a decade. With everything else combined up by $5.1 billion.
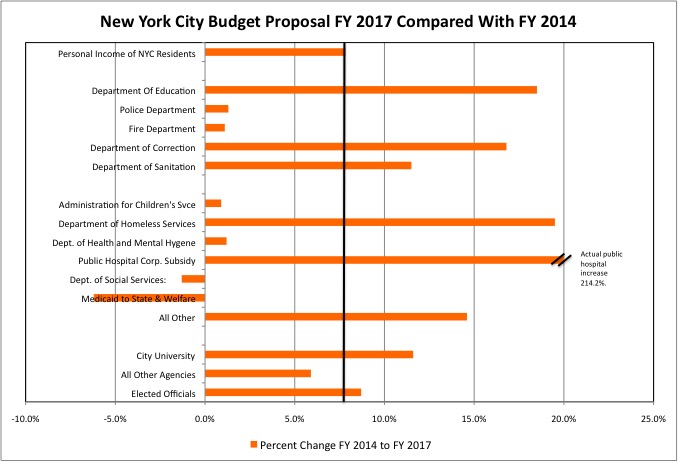
Focusing in the first three years of the DeBlasio Administration, as proposed, the inflation-adjusted subsidy for the city’s public hospitals is proposed to triple from FY 2014 to FY 2017 – though this would not even fully offset the decreases from FY 2007 to FY 2017.
Other agencies with a proposed increase in funding from FY 2014 to FY 2017 that is significantly in excess of the projected 7.8% increase in the personal income of city residents include the Department of Homeless Services, with a 19.5% increase, the Department of Education, at 18.5%, the Department of Corrections, at 16.8%, and funding for the Department of Social Services not including Medicaid aid to the state and welfare spending, at 14.6%.
Department of Education funding has continued to soar long after it reached an extremely high level per student. The increase in Homeless Services funding may be in response to, and far from in proportion to, the number of people in need of help.
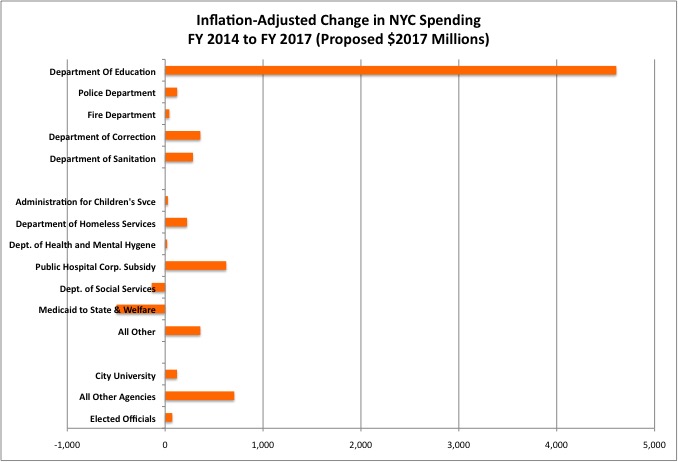
Putting the inflation-adjusted change from FY 2014 to FY 2017 in straight dollar terms, the priorities of the DeBlasio Administration are starker. The Department of Education is up $4.6 billion. Everything else combined is up just $2.3 billion.
With city teachers having gotten one more huge pension increase than all the other unions, in 2008, and thus the city’s teacher pension fund even deeper in the hole, and with a huge raise guaranteed to city teachers in 2018, additional increases in Department of Education funding will be required in the future, even with cuts in school services. Even if, especially if, a recession (or greater equality, reducing pay on Wall Street) causes the total income of city residents to fall.
Other services will require additional reductions to pay for this. Note, however, that with the city’s economy recovering, the city’s Medicaid payments to the State of New York and its welfare payments are proposed at nearly $500 million less in FY 2017 than in FY 2014. In a recession, on the other hand, the need for welfare and other forms of public assistance could increase – even if, as in the most recent recession, most current NYC residents are little affected. As additional young economic refugees from broken homes show up from the rest of the country.
Those who hold that NYC pension costs are not a problem because they are a modest share of the total city budget implicitly assume that the city could slash categorical programs such as Medicaid, welfare, foster care, etc., which are substantially federal and state funded, and use the money for pensions instead. That would seem unlikely. In Illinois, however, funding for the needy has been and continues to be cut off in a fiscal crisis driven by soaring debt and pension costs, so perhaps that is possible.
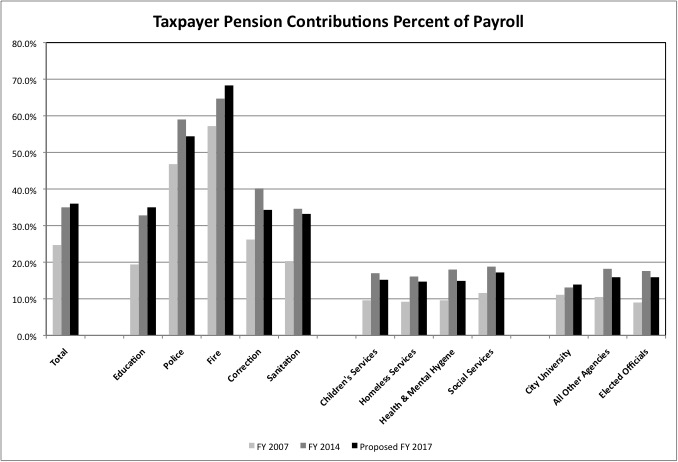
Measured more reasonably as a percent of wages and salaries, NYC’s total pension costs jumped from 24.7% of payroll in FY 2007 to 35.0% of payroll in FY 2014. The DeBlasio Administration has apparently taken advantage of another stock market bubble to understate the size of city’s pension disaster, and proposes to increase its pension contributions to just 36.0% of wages and salaries in FY 2017. The $1.4 billion-plus in payments to the 401Ks of NYC teachers in FY 2015, and similar payments to police and fire, as a result of a minimum guaranteed return of 7.0% with taxpayers making up the difference, may or may not be in addition, depending on whether they are categorized as pension costs or other fringe benefit costs in the table.
As I noted in my analysis of the NYC pension funds using Census Bureau data, New York City had increased its payments to the NYC police and fire pension funds to more than the total amount those funds are paying out. With no existing pension fund money therefore required to pay beneficiaries, therefore, the pension funds may take decades to get out of the hole, but at least they won’t get further into the hole. With a pension at 50 percent of final pay (including promotions, overtime, etc.) after just 20 years of work, payable for the rest of one’s life with inflation increases, and a history of even more costly disability pensions far in excess of police and firefighters elsewhere in the U.S., the police and fire pension contributions are proposed at 54.4% and 68.3% of wages and salaries in FY 2017.
The contribution to the police pension fund is actually lower than in FY 2014. I don’t see how that makes sense, given that there are now far more retired police officers than officers working, the required years of work before retirement for new officers was cut from 25 years to 22, and provisions that has led to extensive disability fraud in the past have been restored.
NYC taxpayers are not contributing nearly as much to the NYC teacher pension fund as that fund is paying out, even though it is desperately deep in the hole $2 billion less in FY 2015, including taxpayer costs of the guaranteed 7.0% return in the 401K teachers get in addition to the pension. After rising from 19.4% of wages and salary in FY 2007 to 32.8% of payroll in FY 2014, pension payments by the Department of Education only increased to 35.0% of payroll in FY 2017. (According to the financial report of the NYC Teachers Retirement System, the contribution was over 40.0% for teachers alone in FY 2015.) That additional $2 billion cost is being put off, with interest, so the Department of Education can get more money for other things now. It will be admitted do during a recession, when the added costs will hurt even more.
The proposed DOE pension contribution at 35.0% of payroll in FY 2017 is similar to the pension percent of wages and salaries for the other agencies where most of the workers are expected to work just 25 years and stop working at age 55: Sanitation at 33.2% and Corrections at 34.3%. But there is a big difference. Corrections and Sanitation workers had been promised a 25/55 pension when they where hired, and money had been set aside for it all along. Those workers are covered by the general NYC pension fund, which is better funded than the teacher’s pension fund.
NYC teachers had been promised a pension at age 62 after 30 years of work, the suddenly granted 25/55 a part of a political deal in 2008. Thus the teacher pension fund is deeper in the hole, and far more school funding should be going to the retired than already is.
Other city worker are promised vastly more generous retirement benefits than nearly all private sector New Yorkers receive, but less than the employees of the agencies cited above. Their pension costs are proposed to vary between 14.0% and 17.0% of wages and salaries in FY 2017. Even the general NYC pension fund, the best-funded of the pension funds NYC runs, is far less well funded than the pension funds run by New York State, which cover local government workers elsewhere in the state.
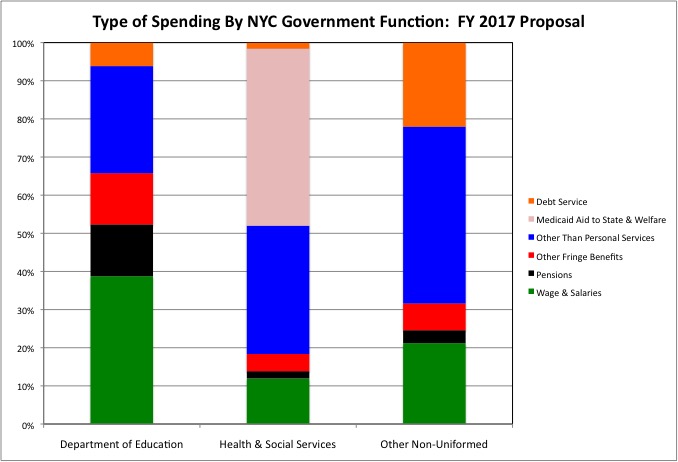
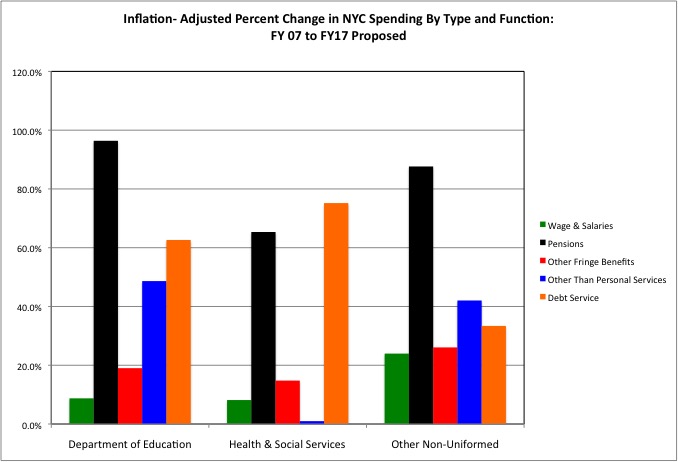
Compared with the uniformed agencies and the Department of Education, the health and social service agencies and other non-uniformed agencies have a much lower share of their spending going to city workers for “personal services” spending in general. Wages and salaries, pensions and other fringe benefits are proposed to account for 65.8% of total spending at the Department of Education in FY 2017, compared with 18.3% for the health and social services agencies and 31.6% for the other non-uniformed agencies.
Debt service is a major component of those “other agencies” responsible for the city’s physical plant, as a result of their large capital plans (and the use of borrowing to pay for mere maintenance and budget problems). Cash payments to the need and Medicaid payments to the state, to be passed on to private, mostly non-profit health care providers, account for a large share of spending in the health and social services category.
Following the large retroactive pension increases of the 1960s, soaring pension costs contributed to a collapse of services in the city’s health and social services agencies, leading to great suffering for the poor. Today most services to the needy are provided by non-profit organizations under contract.
Following the massive pension increase of 2000, the Bloomberg Administration also sought to contract out other agency work, so that future administrations could not be forced to pay more once again for work done in the past. This included, within the Department of Education, contracting out non-teaching work such as some of the custodial work. Something the DeBlasio administration has proposed to reverse by promising more money to city worker custodians in exchange for actually maintaining the buildings. And the private construction industry maintains much of the city’s infrastructure, albeit at a soaring cost due to its own pension funding problems.
As in Illinois, the city’s health and social services OTPS (and presumably its payments to non-profit providers of services to the poor) was sacrificed somewhat from FY 2007 to FY 2017 (as proposed), with a mere 1.0% increase adjusted for inflation. These non-profits, aside from the Medicaid-funded Greater New York Hospital Association and Local 1199, are less politically powerful in a pure self interest way that most of those who produce public services in New York. This low increase is despite the high increase in funding for Homeless Services. Wages and salaries for those in NYC health and social services agencies are proposed to increase just 8.2% more than inflation over a decade, less than the 14.5% increase for city residents alone. Health and social service agency pension and debt service costs from the past soared far more, though thankfully from a more modest base.
OTPS costs jumped 41.0% for the “other agencies,” over and above inflation, over a decade. Some of that is more contacting out, and some of that is the soaring cost of construction contracts. The proposed $6.4 billion in OTPS for these agencies in FY 2017 is up from $4.5 billion in FY 2007 (inn $2017 dollars), but up almost not at all from FY 2014 under the DeBlasio Administration. The capital budget is in addition to this OTPS spending. And in addition to no funding for the MTA, a deferral of construction of the city’s Third Water Tunnel was leaked by someone during the budget process, and then recinded.
The Department of Education had a 48.6% increase in OTPS spending over a decade, a huge increase for an agency that traditionally has spent most of its budget on personnel.
Some of that is Bloomberg’s contracting out of some non-teaching functions.
Some of that is universal pre-Kindergarten, often provided by non-profit organizations, a DeBlasio Administration initiative.
Some of that is special education, with federal laws allowing beneficiaries to sue for the right to have the city pay for private schools rather than requiring attendance at public schools.
But part of that is the growth of charter schools.
The growth of charter schools may be seen as a parallel to the shift to using non-profit health and social service agencies rather than city workers to help the poor in the wake of the pension-induced city services collapse of the 1970s. With Department of Education pension spending rising from about $2 billion in FY 2007 to a proposal of nearly $4 billion in FY 2017 – and with another $2 billion per year likely required to get out of the whole – one sees why the DeBlasio Administration and United Federation of Teachers is out to destroy charter schools and eliminate that choice for parents and teachers. Leaving those parents no choice but the choice exercised by many city government workers and retirees – move out of New York City. As the city’s labor force continues to get richer and richer relative to provide sector workers, but in a form of riches that provides neither motivation nor a sense of obligation on the job, contracting out public services will come to seem more and more attractive, if not the only hope.
While an economic peak to economic peak comparison gives some indication of the values and priorities of the DeBlasio Administration, a full picture will emerge in the wake of the next recession. When lower stock prices force an admission of how well funded the city’s pension plans actually are, the inflated income of the wealthy falls as capital gains disappear, and the full cost of the labor contracts the DeBlasio Administration cut with its union backers is fully reflected in the taxes people pay and what they get in return.
With the exception of universal pre-K, over a decade more for those who already had more (in retirement benefits) has led to less for those who have less, the poor and future New Yorkers paying higher taxes for a diminished infrastructure. Will this trend continue? Or accelerate?