
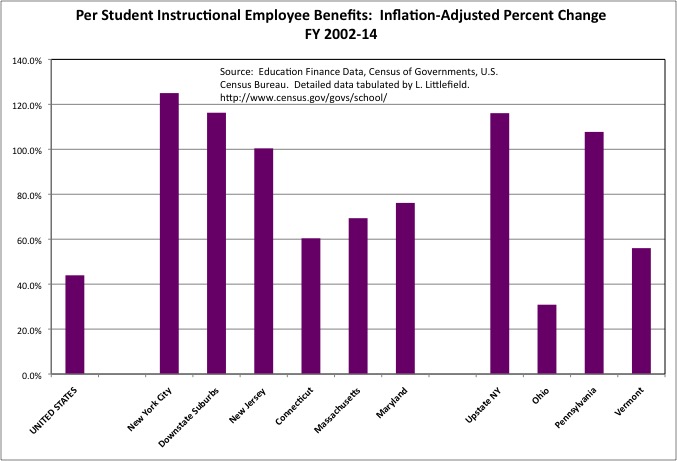
From FY 2002, the last NYC budget before Mike Bloomberg became Mayor, to FY 2014, the last budget of his Mayoralty, New York City’s public school expenditures per student increased by 38.4% in real dollars (adjusted for inflation and for relative private sector wages that year). That is a huge increase in spending on the most expensive public service there is, during a decade when the pay of most private sector workers fell behind inflation. The U.S. average gain in public school spending per student was 3.8%. During the Bloomberg years NYC’s spending on instructional (mostly teachers) compensation per student increased 49.3%, including a 22.4% increase in wages and salaries and 125.0% (more than doubling) on benefits, including pensions. The U.S. average gains were 6.3% for total compensation and 43.9% for benefits, with a 2.4% decrease in instructional wages and salaries per student.
And yet at the end of this period, during the 2013 campaign for Mayor, every candidate but one said either that the schools were no better, or perhaps worse, than they had been before “Education Mayor” Bloomberg and the shift to Mayoral control. Most so-called education advocates agreed. The United Federation of Teachers, which funds many of those advocates, demanded even more money for its members, in exchange for less time spent working with students, and lower expectations as to their level of effort. And got it. And yet there is still extensive resentment, by many of those speaking for those working in education in NYC, toward the people and children of the city. A feeling that they are still being treated unfairly and deserve even more. But is that true? And what was actually received in exchange for all that additional money?
This post is based on charts about comparative per student spending on public education, based on data released each year by the U.S. Census Bureau’s Governments Division. If you want the data in tables, but not the charts and not my comments, I produced a tabulation of it and posted it here.
Census Education Finance Data for FY 2014 (Compared with FY 2002)
With links to a series of spreadsheets that can be downloaded. What you are about to see and read is focused on New York City, but there is enough data provided in those spreadsheets to do a similar analysis for any school district in New York State or New Jersey.
This will be a long post, a post that I decided not to break up into smaller ones. I decided that it should be possible for those who wanted to read all the information at once to do so. If I can write it at once, and then re-read it a couple of times trying to take out the typos, many of those really interested in this subject can read it right through. Others can read some of it at a time. While this will be long compared with most blog posts, I have already compiled enough information to have written far more even than this. As it is this post will review the relative level of spending, state funding and school equity issues, the change in spending during the Bloomberg Administration, and subsequent trends during the DeBlasio Administration, compared with other places.
Spending Per Student: Sky High in New York
At a time when most Americans and New Yorkers are forced to settle for less than prior generations received, those in public education in New York are demanding (and even suing) for more. And yet objectively public school spending is very high in every part of New York State, sky-high in fact.
One objection to this reality is that the average private sector worker also earns more in the expensive Northeast Corridor, including Downstate New York, and this increases the cost of living here. But even reducing expenditures per pupil by a factor, based on what the average private sector worker earns, in both New York City and the Downstate Suburbs, spending per pupil remains sky high not only compared with the U.S. average but also compared with other states in the Northeast.
With that factor applied to reduce spending in Downstate New York, in fact, spending is about the same in every region of New York State – New York City, the Downstate Suburbs, Upstate Urban Counties and Upstate Rural Counties. At one time, back in the 1990s, school spending was low in NYC, and the state school aid formula was used to redistribute tax revenues from the city to the rest of the state. But no more. Those claiming the New York City schools are underfunded are simply repeating something that was said, and was true, a long time ago, but is no longer true now. Saying the same thing even though things are completely different. If anything, school spending is now sky high relative to what other people in New York are paid, at their expense.
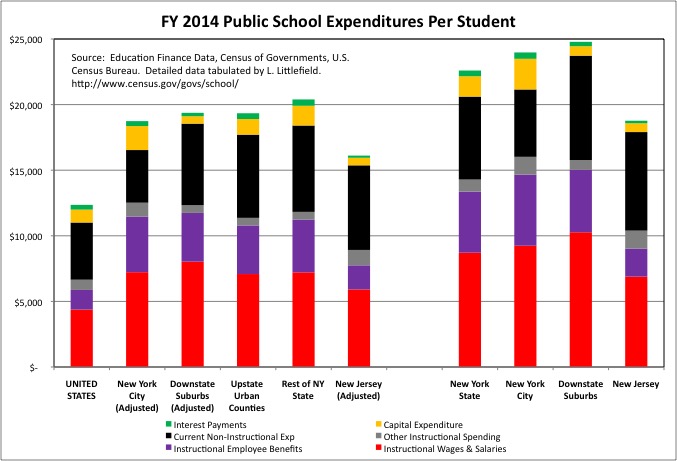
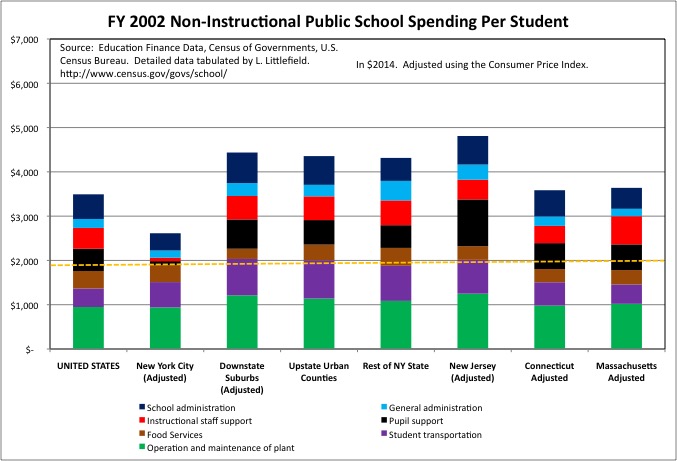
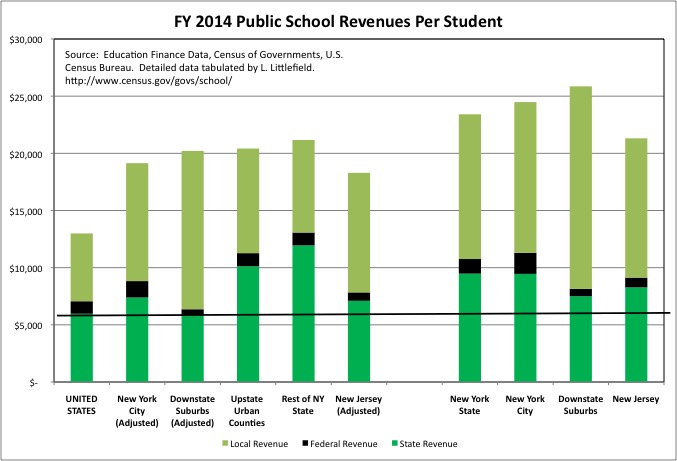
New York City’s school spending per student is particularly high with regard to instructional wages and benefits, which mostly includes spending on teachers (and a few other staff types, school librarians for example). Spending on principals and other administrators is classified in other categories. On an unadjusted basis in FY 2014 New York City spent $14,665 per student on instructional (mostly teacher) wages, salaries and benefits alone, or $293,300 per 20 students and $175,980 per 12 students. And this was at a time when the contract for NYC teachers had been expired for years; spending has soared since, as a result of retroactive pay for past years including FY 2014. Instructional wage, salary and benefit spending in other parts of the state, on average with an adjustment for the cost of living, was about the same as in New York City. And higher than anywhere else.
The horizontal orange line indicates what NYC teachers were getting in per-student compensation in FY 2014, adjusted downward for the cost of living for a fair comparison with the U.S.
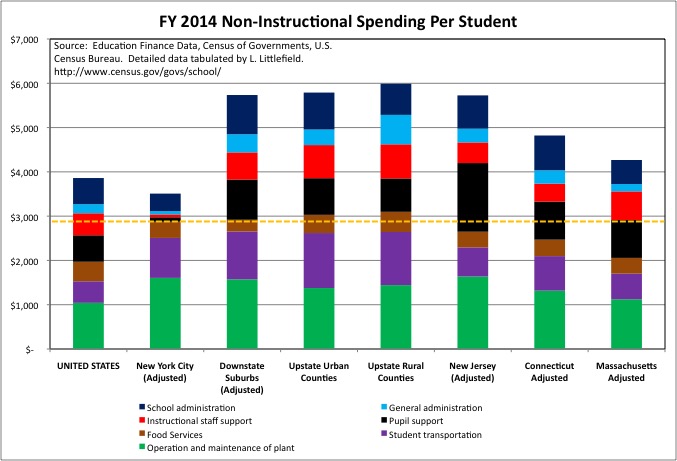
NYC’s per student public school spending has always been relatively low in the non-instructional categories combined, something many ascribe to economies of scale in the nation’s largest school district. Non-instructional expenditures, on the other hand, are very high in other parts of New York State, having soared in the 1990s after Governor George Pataki’s STAR program directed more state aid to whichever school districts spent the most.
Still, in total NYC ended up spending about the same as other parts of the state overall in FY 2014. The city’s lower non-instructional current spending was offset by high capital expenditures, as NYC tried to catch up with decades during which its school buildings were allowed to fall apart. And pay for the extremely high cost of public construction in New York.
Despite low non-instructional spending overall, NYC’s per student spending was far higher than the U.S. average – and similar to other parts of the state – in two non-instructional categories: Operation and Maintenance of Plant (custodians) and Student Transportation (the buses). Even though NYC students are squeezed into less space each than students elsewhere, and a smaller share of NYC children use school buses than do elsewhere. Per square foot and per student actually transported, NYC’s spending in these categories is very, very high compared with anywhere but other parts of NY State. In the chart the level of NYC spending on these categories, plus spending on Food Services (for which NYC is about average), is indicated by the horizontal orange dashed line.
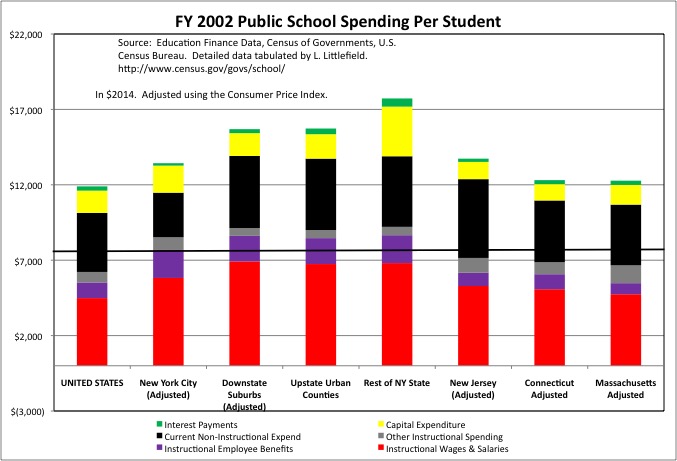
Even adjusted upward for inflation into $2014, spending was far lower back in FY 2002, before Mayor Bloomberg took office, than it was in FY 2014, at the conclusion of the Bloomberg Administration. Even in FY 2002, however, NYC’s per student expenditures on instructional wages, salaries and benefits was already 36.9% higher than the U.S. average, having risen since the mid-1990s. Even with the NYC figure adjusted downward for the higher average private sector wage here. In FY 2002 NYC’s per student expenditures on instructional compensation was also higher than in nearby states such as New Jersey, Massachusetts and Connecticut. At the time, however, NYC was lower than in other parts of high-spending New York State. The horizontal black line indicates what NYC teachers were getting in per-student compensation back then.
In FY 2014, adjusted NYC per student expenditures on instructional wages, salaries and benefits were 95.2% higher than the U.S. average, or nearly double. Without that downward adjustment, NYC’s instructional wage and salary spending per student of $14,665 was 2.5 times the U.S. average of $5,873. Excluding the overpaid Finance and Insurance sector, the average private sector worker in Downstate New York earned 29.7% more than the U.S. average in 2002 and 27.9% more than the U.S. average in 2014. Not 250.0% more, like NYC instructional public school employees.
In FY 2014, New York City’s total non-instructional spending per student was 7.9% lower than the U.S. average, after cutting the NYC figures for the cost of living. Back in FY 2002, NYC’s total non-instructional spending had been 24.4% below the U.S. average on the same basis. Still less expensive than the U.S. average, NYC non-instructional expenditures are higher, relative to that average, than they had been.
The cost of living/average private sector wage adjustments I make cause school spending in NYC and the rest of Downstate New York to appear lower than the unadjusted figures would show. Including the per-student spending reported by the U.S. Census Bureau in its report. I do this out of a sense of fairness to those who work in public education here, to make the data more comparable with the U.S. average and other states where the cost of living is lower. But some who don’t want to face up to what the data says might nonetheless claim I am “manipulating” the data against them. So to get around this, I came up with a second way of presenting it – the straight spending per student for “comparable states.”
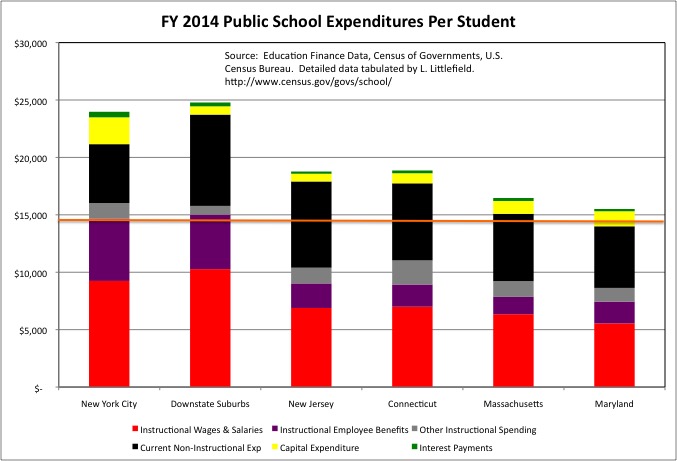
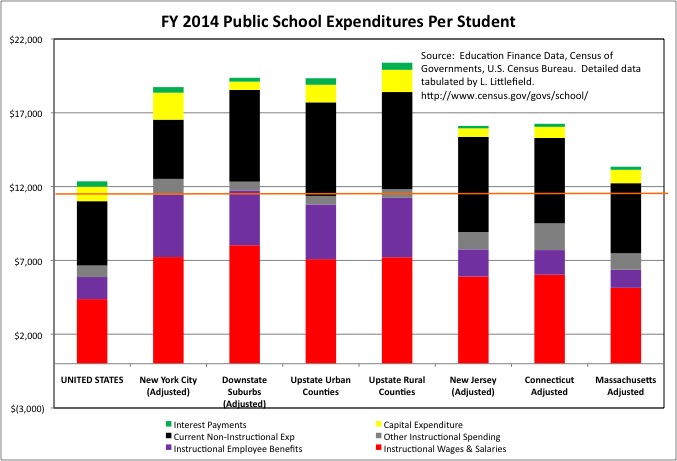
For New York City and the Downstate Suburbs, the comparable states are those that have most of their population located on the expensive, education-oriented Northeast Corridor – Massachusetts, Connecticut, New Jersey, and Maryland. Without any adjustment, FY 2014 expenditures per student were $24,004 in NYC, $25,041 on average in the Downstate Suburbs, $19,636 in New Jersey, $19,388 in Connecticut, $16,884 in Massachusetts, and $15,813 in Maryland, which has four of the ten highest spending school districts among the largest 100 in the country (NYC is second).
http://www.bizjournals.com/baltimore/news/2016/06/13/baltimore-public-schools-among-top-four-districts.html
In Maryland, as in most of the south, school districts cover entire counties, and there is much less variation in school spending per student among individual communities. School funding inequality is greatest in the “liberal” Northeast, with its many small school districts.
On instructional wages, salaries and benefits, New York City’s $14,665 in expenditures per student compares with $15,022 on average in the Downstate Suburbs, $9,028 in New Jersey, $8,934 in Connecticut, $7,852 in Massachusetts, and $7,445 in Maryland. The orange line follows the NYC level.

Private sector workers in Upstate New York don’t earn more than the U.S. average; in fact they earn less. If the cost of living is higher there, it is only because of the high taxes paid to support relatively well off state and local government employees. So the Upstate Urban and Upstate Rural counties may be fairly compared directly with the U.S. average. Upstate New York also has much in common with most of adjacent Pennsylvania, nearby industrial Ohio, and adjacent Vermont, than with the Northeast Corridor where housing prices are higher.
In FY 2014, total expenditures per student were $18,764 in the Upstate Urban Counties and $20,490 in the Upstate Rural Counties, compared with the U.S. average of $12,625, $12,907 in Ohio, $16,585 in Pennsylvania and somewhat more in Vermont (there seems to be an error in the Vermont total, which is more than the components as shown in the chart).
On instructional wages, salaries and benefits alone, expenditures per student were $10,791 in the Upstate Urban Counties (the orange line) and $11,238 in the Upstate Rural Counties, compared with the U.S. average of just $5,873, $6,052 in Ohio, $7,992 in Pennsylvania and $8,721 in Vermont. Basically, teachers in Upstate New York are much richer, in total compensation, than most of their neighbors and teachers in nearby states.
Upstate New York’s current non-instructional expenditures are also extremely high compared with the U.S. average and the nearby states, in response to former New York Governor Pataki’s “everyone outside NYC onto the payroll and into the pension” “economic development” strategy.
A quick aside on Vermont. It is not a wealthy state, so I wondered if the property taxes paid by a large number of second homeowners were subsidizing its relatively high (though not New York high) public school expenditures per student. As in the highest-spending districts in New York State, which tend to be located in second home and resort areas such as the Hamptons and the Adirondacks.
Second homeowners do, in fact, account for a large share of that state’s housing inventory, at 15.6%. But local property taxes account for virtually none of Vermont’s state and local revenues, which are generally collected via state taxes. So like just about everywhere else, Vermont has less school spending inequality than New York.
Still Not Enough? The School Funding Equity Issue
So what happened during the Bloomberg Administration?
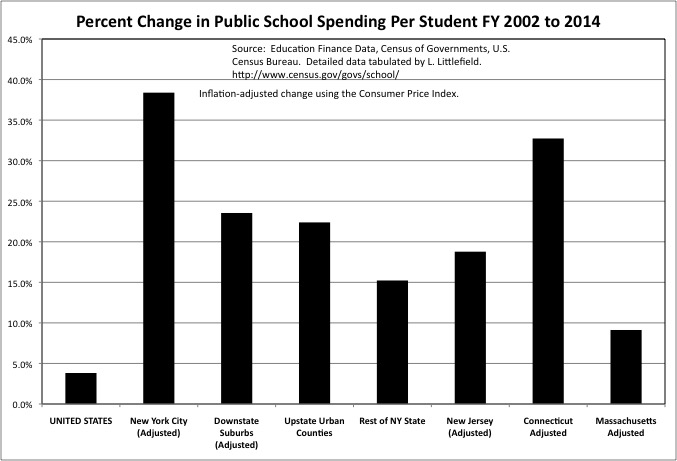
As mentioned NYC school spending per student, adjusted for inflation and the average private sector wage, increased 38.4% in New York City, much higher that the 23.5% for the Downstate Suburbs, 22.4% for the Upstate Urban Counties, 15.2% for the Upstate Rural Counties, 18.8% for New Jersey, and 9.1% for Massachusetts. And far more than the U.S. increase of 6.3%. Only the 32.7% increase in Connecticut comes close, and only because that state was essentially not funding its teacher pensions at all back in FY 2002, and had a big (and ongoing) increase in pension spending in the years since.
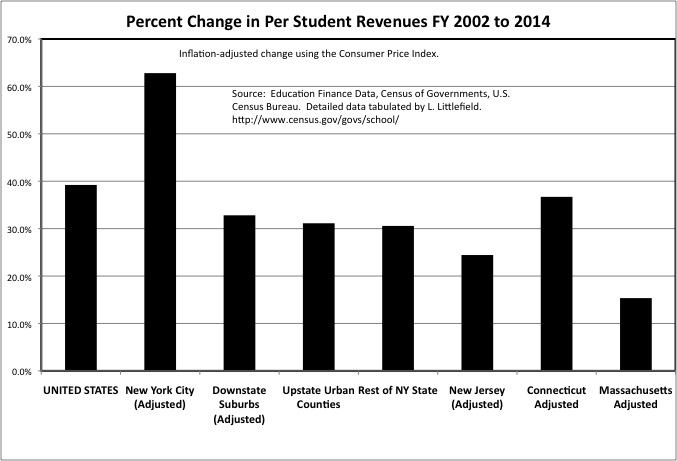
This massive increase in NYC school expenditures per student, adjusted for inflation, required a massive increase in public school revenues per student, paid for by higher taxes and lower (relatively) spending on other things. The FY 2002 to FY 2014 increase was 62.8% for NYC, compared with just 9.1% for the U.S., 32.8% for the Downstate Suburbs, 31.1% for Upstate Urban Counties, 30.6% for Upstate Rural Counties, and 24.4% for New Jersey.
You may recall that Mayor Bloomberg increased property taxes by 18.0% soon after taking office, to pay for a big increase in NYC public school spending, which he promised as part of gaining mayoral control of the schools. Additional increases in school spending in the city’s economic booms to follow were followed by cuts in other services during recessions.
Based on what is reported in the media, driven by those who are paid to put out press releases, you might have heard that Governor Cuomo and the State of New York have cheated New York’s schools by underfunding them. That argument is three fold.
First, the state imposed a “cap” of 2.0% (or the rate of inflation, whichever is less) on property tax increases in school districts outside New York City. In school budget votes, typically dominated by parents and school employees, districts may exceed the cap only by a vote of 60.0% rather than the usual 50.0%, not much of a difference. And pension cost increases, a big part of increasing expenditures thanks to all the retroactive pension increases scored by the unions with the legislators they control, are exempt from the cap.
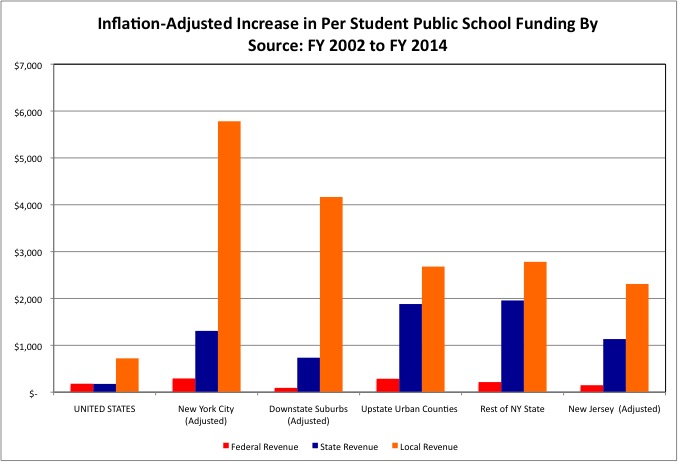
The data says that despite the “cap” from FY 2002 to FY 2014 local school funding per student soared by $4,166 in on average in the Downstate Suburbs, $2,681 in Upstate Urban Counties, and $2,782 in Upstate Rural Counties. Compared with an increase of $5,782 for New York City and the U.S. average of just $732.
Second, it is claimed that New York State’s school aid should have increased more, instead of the burden shifting to local school taxes. Despite cutbacks in the Great Recession when NY State tax revenue (dependent on Wall Street) plunged, however, inflation-adjusted New York State school aid per student increased $1,308 in New York City, $736 in the Downstate Suburbs, $1,881 in the Upstate Urban Counties, and $1,958 in the Upstate Rural Counties. All far more than the $177 average state school aid increase per student for all U.S. states. And this is with state aid marked down in Downstate New York for the cost of living. The straight inflation-adjusted state aid increase per student was $1,565 in NYC and $850 in the Downstate Suburbs.
With a downward adjustment for the cost of living, New York’s FY 2014 state school aid per student was at about the U.S. average in the Downstate Suburbs, and above the U.S. average in New York City. NY State school funding per student was far above average in these areas without that adjustment. And New York State school aid per student was also far above the U.S. average in Upstate New York. New York State school aid is not a low share of total school expenditures because state aid is low, but rather because total spending is so high in New York.
Third, those filing lawsuits claim that lower-spending school districts need more money because higher-spending school districts are spending more. More funding is required for “school equity.”
Lower spending NY State school districts are not, in fact, spending less than the U.S. average per student. Every single NY State school district was above that average in FY 2014, even with cost of living markdowns downstate. And with regard to instructional wages, salaries, and benefits, spending per student was 30.0% higher than the U.S. average in the lowest spending school district in New York State, a district up in the North Country up near Watertown. But “funding equity” advocates, funded by the teacher’s union, don’t want to talk about the U.S. average or other states. Just the 100 highest spending districts in New York State. And they aren’t really in favor of funding equity. They are opposed, claiming actual equity would be a despised “Robin Hood plan.” Here is why.
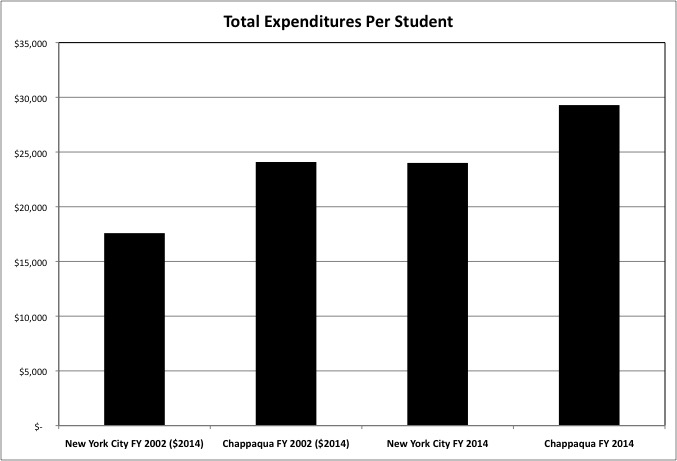
In FY 2002 the richly funded Chappaqua schools spent $24,089 (in $2014) per student, far more than the $17,587 for New York City at the time. If spending could be “leveled up,” higher spending advocates claimed, New York City would also have good schools.
As it happens in FY 2014 New York City actually spent $24,004 per student – almost exactly the amount it was supposed to “level up” to in order to catch up with Chappaqua. But guess what, by that time Chappaqua’s spending had increased to $29,289 per student, so New York City still needs more money!
Chappaqua schools were pretty good back in 2002, weren’t they? Gold plated, in fact. God forbid Chappaqua spending had stayed the same, New York City had caught up, and the focus had shifted to where the money actually went instead of how much there is.
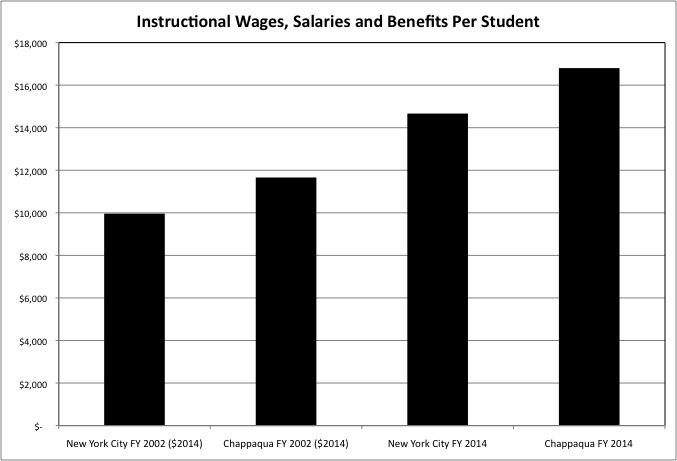
With regard to instructional wages, salaries and benefits Chappaqua spent $11,660 per student in FY 2002 ($2014), significantly more than the $9,961 NYC spent at the time. But by FY 2014 NYC was spending $14,665, much more than Chappaqua in FY 2002 – even though the NYC teacher’s contract had been expired for several years, with no wage increase as of then (but much higher increases coming later). But it wasn’t enough. Why? Because by FY 2014 Chappaqua’s per student spending in these categories had increased further, to $16,801.
In FY 2018, following the back-loaded retroactive raises as part of Mayor DeBlaiso’s first teacher contract, and the admission that even more pension funding is needed to pay for past retroactive pension increases, it would not surprise me if New York City’s instructional wage, salary and pension spending per student had soared past the level of Chappaqua in FY 2014, adjusted for inflation. But by then Chappaqua would have increased further. So it will still be claimed to still not be enough, even as less well off city residents are squeezed more and more – in tax increases and service cuts – to pay for it.
How about equity between school districts outside NYC? New York doesn’t need to follow the lead of more equitable so-called “Red States” and eliminate local school districts to get it. It just needs to eliminate district-by-district based local school funding.
Why The Powerful Will Never Allow New York State’s School Funding Equity Problem to be Solved
As I proposed, district school taxes could be eliminated and replaced by countywide school taxes, voted on by county legislators and executives, and distributed to local school districts on a per-student basis. Something that only I, apparently the only person in NY State that is actually in favor of school funding equity, would dare to suggest.
What the “Alliance for Quality Education” and others who raise the funding equity argument actually want is more spending by wealthy school districts. So they can claim the need for even more spending by other districts, or justify cuts in education services elsewhere despite high taxes in those other districts, in an ever-increasing spiral. Will anyone call for actual school funding equity, and call their bluff?
Somehow, no matter how much the AQE, the New York State United Teachers, and the United Federation of Teachers attack Governor Cuomo with claims of school funding inequity, these groups have absolutely no fear that he might respond by proposing actual equity, as I have. And thus equalize school spending, and the burden of local school taxes, between Chappaqua (total unadjusted expenditures $29,298 per student), where Governor Cuomo and Senator Clinton live, and my hometown of Yonkers (total expenditures $20,689 per student). At a level of funding County Executive Astorino and the Westchester county legislature (and other county executives and legislatures) would determine, taking other needs and the overall tax burden into account.
Nope, they can blast Cuomo as much as they want with impunity, and put out all the propaganda they want, but he will never really respond. The discussion is kept within accepted bounds, and Omerta is maintained. Just as it was during all those decades when spending within NYC was higher in individual schools with better off children, and nobody said a word. Until 2006, when it this was reversed by Mayor Bloomberg’s “fair student funding” policy, over the objection of the teacher’s union.
http://www.ibo.nyc.ny.us/iboreports/FairStudentFunding2.pdf
Changes in Teacher Compensation During the Bloomberg Years
In what categories did New York City’s school spending per student go up from FY 2002 to FY 2014? Mostly in the very categories that it had been relatively high in to begin with. Starting with instructional employee benefits, particularly pensions.
Even 20 years ago New York City public employees already had among the richest pensions in the U.S., and New York City residents, most of whom have no employer-funded retirement benefits at all, sacrificed the most in higher taxes paid and public services foregone to pay for this. By dominating the state legislature, however, New York’s public employee unions score more and more irrevocable pension increases every year. These are usually claimed to “cost nothing,” because at first they aren’t paid for, inflating their cost further as the pension funds get deeper in the whole.
Coming into office in 2002, Mayor Bloomberg described the soaring burden of prior pension deals as “uncontrollable costs,” as a way to avoid the blame for the related tax increases and service cuts. That same Mayor, however, was in on the 2008 deal to have NYC teachers retire five years earlier, with five more years of retiree health care before Medicare picks up much of the burden, drastically increasing those “uncontrollable costs” by perhaps $20 to $30 billion. Along with former State Assembly Speaker Sheldon Silver, former State Senate Majority Leaders Joe Bruno and Dean Skelos, all subsequently convicted of corruption, and Eliot Spitzer, better known as Client 9, who has been supported by the teacher’s union in his campaign for Governor. A deal NYC residents were once again fraudulently told would “cost nothing” or “save money” at the time, to the extent that the deal and its costs were talked about at all.
The 2008 NYC 25/55 United Federation of Teachers Pension Deal: An Investigation
As we will see this irrevocable deal is in fact the one irreversible legacy of Bloomberg’s “mayoral control,” “school reform,” etc., with the rest being quickly discarded.
New York City’s instructional benefit expenditures per student soared 125.5% from FY 2002 to FY 2014 (more than doubled, adjusted for inflation), far more than the (still high) 43.9% for the U.S. average. Why is there a public school crisis in the United States? As the wages of most workers continue to fall behind inflation, a long-term trend that has even affected the one-percent since 2008 and is now even affecting those on Wall Street, from FY 2002 to FY 2014 inflation-adjusted per student instructional benefit expenditures increased of 116.3% for the Downstate Suburbs, 100.4% for New Jersey, 60.4% for Connecticut, 69.3%for Massachusetts, 76.1% for Maryland, 116.1% for Upstate New York, 30.9% for Ohio, 107.7% for Pennsylvania, and 56.0% for Vermont.
Compared with New York City, in other places soaring pension costs are driven not as much by retroactive pension increases, and more by underfunding of the pensions teachers had been promised to begin with. In order to cover up the damage from how much they have taken, however, New York’s politicians and their unions are underfunding the retroactively increased teacher pensions right now – leading to further increases in costs later.
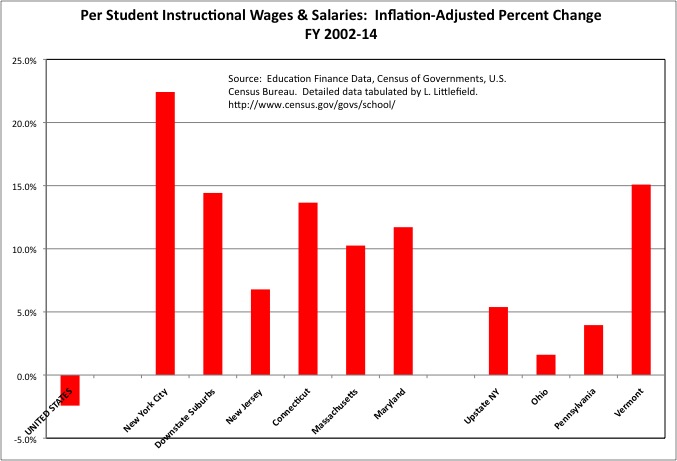
Public employee pensions have, in general, always been richer than the retirement benefits most private sector workers receive. A difference once offset by lower public sector wages and salaries. There was, however, no inflation-adjusted decrease in instructional wages and salaries from FY 2002 to FY 2014 in New York City, to balance out the increase in pensions. Even though the NYC teacher’s contract was long expired in FY 2014, making teacher wages and salaries appear far lower than they would later turn out to be.
From FY 2002 to FY 2014 instructional wages and salaries per student increased 22.4% in NYC (adjusted for inflation), far more than the 14.4% for the Downstate Suburbs, 6.8% for New Jersey, 13.7% for Connecticut, 10.3% for Massachusetts, and 11.7% for Maryland. In Upstate New York and salaries per student increased 5.4%, compared with 1.6% for Ohio, 4.0% for Pennsylvania, and 15.1% for Vermont.
Unlike the case for NYC’s rich and underfunded pensions, NYC’s teacher pay was not high back in FY 2002, and starting pay was particularly low. In part because the unions work to get contracts that slash starting pay, to reduce the quality of worker recruited, using the savings to inflate late career pay, and thus pensions. While NYC teacher pay was low, however, studies in the late 1990s showed that NYC teachers spent fewer hours per year actually working with students, and more time in out-of-classroom assignments, than teachers anywhere else.
Time spent out of the classroom had soared even further as a result of the “Circular 6” teacher contract during the Dinkins Administration, which had a devastating impact on class size in the 1990s. Several years spent coasting in an out-of-classroom assignment, with overtime, prior to retirement is the goal of every NYC teacher, I was told back at that time. While class sizes were high elsewhere, class sizes were low in a few “experimental” schools where every teacher actually taught.
In Mayor Bloomberg’s first teacher contract cash pay was increased by 20.0%, a massive increase that also led to higher pensions for those retiring in the years to come. That increase was one of the factors in the 18.0% property tax increase. Still, it was an increase that I was damn happy about, and thought was absolutely the right thing to do, at the time. In exchange, teachers were required to spend more time working with students, including tutoring those falling behind, and fewer teachers scored out-of-classroom assignments.
But Mayor DeBlasio’s first teacher contract eliminated the extra work and tutoring, and increased out of classroom assignments “to give teachers are career ladder,” while not reversing the 20.0% pay increase NYC residents had paid for in exchange for more time teaching. In fact the reduction in time spent working, despite the pay increase previously received, had already started before even DeBlasio was elected. Mayor Bloomberg had previously allowed NYC teachers to work one few day per year in exchange for higher pension contributions by new teachers, after the cost of his 2008 retroactive pension increase had soared.
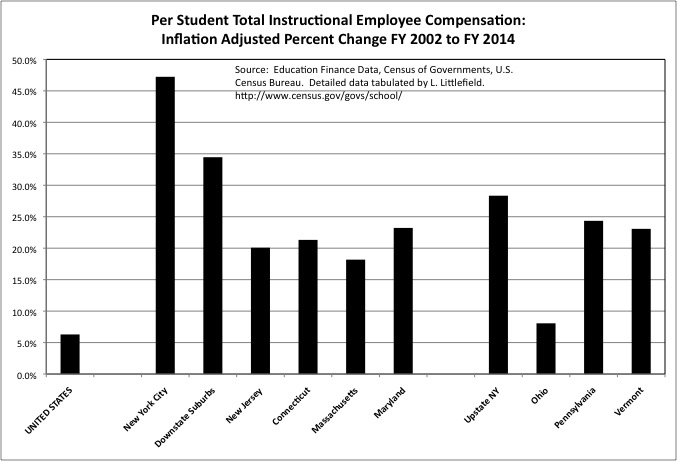
Adding up instructional wages, salaries and benefits, the per student compensation of New York City teachers increased by nearly 50 percent more than inflation from FY 2002 to FY 2014, during the Bloomberg years. There were smaller, but still substantial, percentage gains in other parts of NY State and elsewhere in the Northeast as well. The U.S. average increase was 6.3%. Given that the Northeast is part of that U.S. average, and pulls the average up, it is likely that per-student teacher compensation actually fell in many parts of the country.
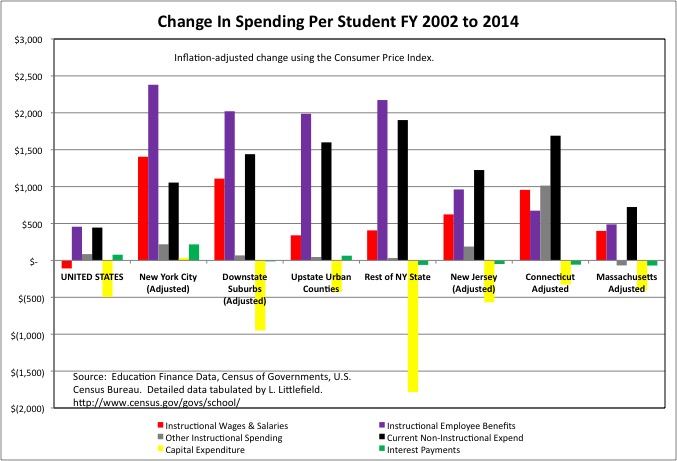
Looking at the inflation-adjusted change in expenditures from FY 2002 to FY 2014 on a dollars ($2014) per student basis, one finds that in NYC the increase was $1,404 per student for wages and salaries, $2,380 for benefits, and $3,785 for total compensation, those combined. NYC instructional wages, salaries and benefits, the total compensation of teachers, thus increased by $75,700 per 20 students and $45,420 per twelve students during the Bloomberg Administration, which was deeply resented by those teachers (according to their union and education advocates).
On a per student basis, the increase in instructional compensation of $3,785 for NYC compares with $3,129 for the Downstate Suburbs, $2,327 for the Upstate Urban Counties, $2,580 for the Upstate Rural Counties, $1,585 for New Jersey, and just $348 for the U.S as a whole. Elsewhere, as well as in NYC, the dollars per student increase in benefit costs exceeded the increase in wages.
As for the per student increase in non-instructional expenditures from FY 2002 to FY 2014, pension benefits also drove the change. For NYC the increase was $188 per student for non-instructional wages and salaries, $387 per student for non-instructional benefits. Other non-instructional expenditures increased by $479 per student. But it is likely that much of this increase, as well, went to the pension costs of the unionized private companies the Department of Education contracts with. Basically “school reform” was about more money for those not working, out of the classroom or retired.
How Could Teacher Compensation Possibly Be That High?
Thus far, this discussion has been about relative spending: New York City and other parts of New York State compared with the U.S. average and other states, and FY 2002 compared with FY 2014. But there is another way to look school spending per student – absolutely, picking apart where the money is going and asking if it is fair or makes sense.
In 2014, according to the U.S. Census Bureau’s American Community Survey, the median wage and salary income for working NYC residents was just $35,278. For full-time, year-round workers (few of any of whom in the private sector get summers off or pensions at age 55) the median was $50,279 for males and $45,749 for females. For college graduates it was $54,692 overall, $60,876 for males, and $50,810 for females. And for those with a graduate or professional degree (among which teaching is the easiest to get) the median was $71,801 overall, $81,686 for males, and $66,083 for females.
Compared with this, how is NYC instructional (mostly teacher) wages, salaries and benefits spending per student at $293,300 per 20 students and $175,980 per 12 students fair? How can the average New Yorker, who is less well off, afford to pay for this? Why is this level of compensation resented, with the teacher’s union demanding that teachers be expected to do less and less in exchange for it? In fact, given that NYC teachers current had a starting pay of just $45,530 in 2014 (with summers off), increasing to $54,411 in 2018, how is a total cost that high even possible?
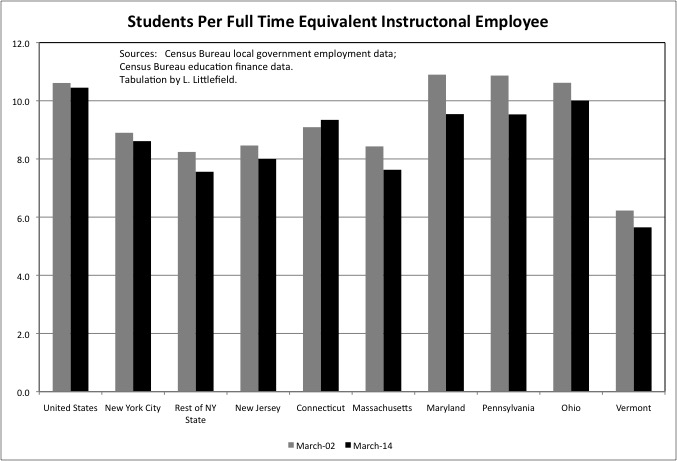
Part of the explanation is all those hours, days and years spent out of the classroom. Comparing full time equivalent instructional employment from the Census Bureau’s public employment data with enrollment data from its education finance data, one finds that there were just 8.6 students per instructional worker in the NYC public schools in 2014, down from 8.9 in 2002.
Instructional employment, based on the Census Bureau definitions, includes more than instructional expenditures, which is pretty much just expenditures on teachers. Those working as principals, superintendents, other administrations, advisors, guidance counselors, etc. are also counted as instructional workers, even as expenditures on them are counted in the School Administration, General Administration, Instructional Staff Support and Pupil Support “non-instructional” expenditure categories. But still, a ratio of just 8.6 students to instructional worker one despite class sizes far, far higher? What percent of the time that NYC residents are paying for instructional workers are they actually instructing?
Evidently, having most instructional workers spend most of their time away from students is not uncommon. In 2014 the student to instructional worker ratio was just 7.6 in the Rest of New York State, 10.5 in the U.S. as a whole, 8.0 in New Jersey, 9.3 in Connecticut, 7.6 in Massachusetts, 9.5 in Maryland and Pennsylvania, 10.0 in Ohio, and 5.6 in Vermont. And everywhere but Connecticut it was lower than in 2002, despite all the service cuts and class size increases across the nation since then.
One aside. Back in the 1990s, I used data similar to that presented in this post to show that NYC spending and teacher pay was relatively low and the state was, in fact ripping off NYC’s children. At the time, one retort by those benefitting from that deal, who didn’t want to hear it, was that NYC actually had plenty of money, but it was all going to special ed. This was subsequently debunked – a higher percent of the children were in special ed in the rest of New York State than in NYC.
And now that NYC spending is sky high and there are still large class sizes and service cuts? NYC teacher union head Mike Mulgrew, advocates and others sneer out the same 20-year-old excuse – all the money goes to special ed.
The 8.6 students to one instructional worker ratio in NYC, moreover, only includes “active” workers.
The average years of service among new retirees, according to the 2014 Comprehensive Annual Report of the NYC Teachers Retirement System, is about 25. Which is what you would expect, given that teachers now retiring scored a series of deals for retirement at age 55 after just 25 years of work, despite only having been promised retirement at age 62 after 30 years of work back when they were hired. (Only the 30/62 deal was thus paid for while those teachers were working, leading to soaring pension costs now).
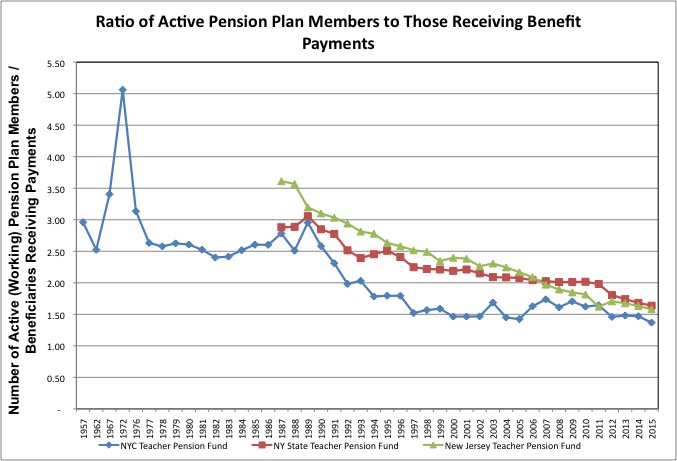
As a result the ratio of working members of the NYC teacher pension fund was down to just 1.37 times the number of retired members receiving benefits in FY 2015, according to newly released Census Bureau data, a new low.
Given that many of the active teachers are early in their careers, and some of those will end up changing professions or moving away, it is likely that those who spend their entire careers as NYC teachers spend, on average, one year being paid for nothing in retirement for each year worked, a ratio of 1 to 1. Data on the number of years that had been spent in retirement by former, full career NYC teachers that die each year is not made available, but average life expectancy at age 60 implies this.
Adding it up, what share of those being paid as either current or former teachers are in fact teaching at a given time? And given how many who are not teaching are being paid for each one, no wonder the total cost of teachers is so high regardless of the cost of each one.
It is facts like these that have caused me to conclude that school reform is dead, that it was really just a scam to begin with, that the schools as currently organized can never be improved, and what people really need is find alternatives. Even as they pay up in taxes for school systems that will nonetheless become worse and worse.
Schools Are Obsolete: IT and the UFT Have Convinced Me
Seeking alternatives is more important that all those silly and ultimately pointless battles over teacher evaluation. The teacher’s union has defeated school reform by bankrupting the schools with pension increases.
With some help.
NYC’s Ever-Higher Custodian and School Bus Costs
Despite low non-instructional spending overall, New York City’s per student spending on Operation and Maintenance of Plant (ie. custodians) was relatively high in FY 2002. The limited work NYC custodians did in exchange for that money was a repeated subject of exposes over the decades before FY 2002, and it became the subject of much controversy in the years after. Then-Councilwoman Eva Moskowitz held a series of hearings on the provisions of the custodian’s contract spelling out all the work they did not have to do.
http://www.nytimes.com/2003/11/13/nyregion/council-panel-holds-inquiry-on-custodians-in-the-schools.html
In retaliation, and as a warning to others about the consequences of breaking Omerta, NYC’s public employee unions have set out first to destroy Moskowitz’s political career and then her private sector career, and will likely hound her to the end of her days. Meanwhile the Bloomberg Administration turned some of the school maintenance work over to private contractors.
http://www.nytimes.com/2003/11/21/nyregion/school-janitors-sue-over-hiring-of-outsiders.html
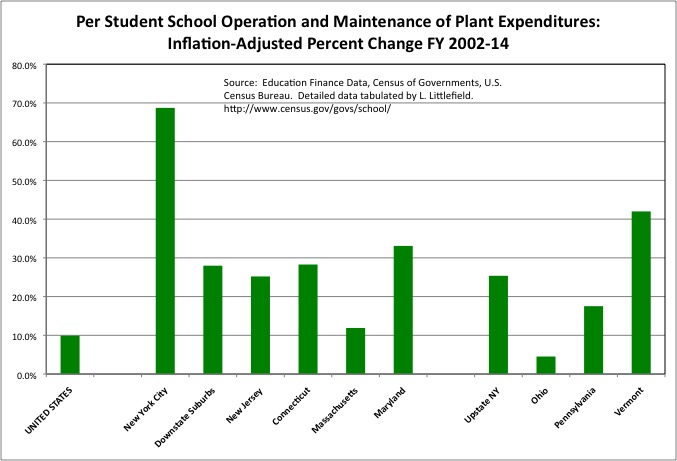
Despite these battles, NYC’s inflation-adjusted per student expenditures on Operation and Maintenance of Plant increased by 68.7% from FY 2002 to FY 2014, during the Bloomberg years, compared with 28.0% in the Downstate Suburbs, 25.2% in New Jersey, 28.3% in Connecticut, 11.9% in Massachusetts, 25.4% in Upstate New York, 4.5% in Ohio, 17.5% in Pennsylvania, and 42.0% in Vermont.
And more since. Recently Bill DeBlasio announced a “reform” to have more of the school maintenance work done by in-house custodians. Giving then $10,000 bonuses and a ban on outsourcing, and increasing per student spending on this function by an (probably under-) estimated $100 per student per year.
http://thechiefleader.com/news/news_of_the_week/breakthrough-custodial-pact-gives-doe-control-over-janitor-services/article_e97800aa-00c9-11e6-b0c9-df3b127d0c37.html
But it isn’t just public employees who apparently deserve to get richer at the expense of the serfs in a Democratic “progressive” administration (and in a Republican “reform” administration). It is anyone connected with the government, at the expense of those without connections, no matter how poor.
New York City has long contracted out its school bus services to private companies, which in turn were among the highest campaign contributors to members of the NYC Council, and had their contracts automatically renewed each year without competitive bidding for more and more money. As a result NYC spending on student transportation was high even though a smaller share of NYC children use school buses than elsewhere. And even though NYC has progressively de-funded the amount it pays to the Metropolitan Transportation Authority to provide some of these school transportation services.
http://www.streetsblog.org/2010/03/01/the-truth-about-student-fares-mta-a-huge-bargain-for-state-and-city/
The Bloomberg Administration set out to competitively bid school bus contracts, and reorganize the routes to save money. The contractors and their unions responded by fighting this in court, and the courts (appointed by New York State legislators) used the bogus lawsuit to delay the new routes from the start of the school year until the middle of winter. When implementation was finally allowed to occur in January, the union members responded by dropping off handicapped children in the wrong places in the freezing cold.
With the politically connected thus having proved they were willing to risk handicapped children dying from exposure to maintain their deal, the Bloomberg Administration backed off, until a lawsuit and the Great Recession forced competitive bidding to resume. At the time Mike Mulgrew, the head of the teacher’s union, sneeringly asserted that the reason class sizes were soaring and education services were being cut was not because of the cost of the 25/55 teacher pension increase, but because NYC spent too much on school buses.
So what happened to inflation-adjusted per student expenditures on student transportation during the Bloomberg years, after all these battles?
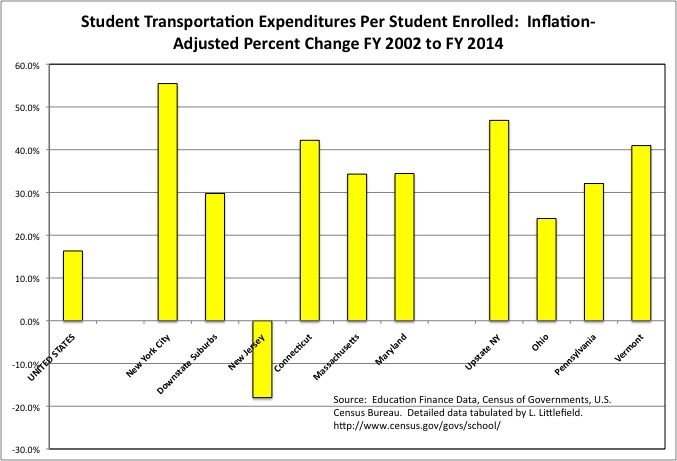
The increase was 55.5% for New York City, more than the 29.8% for the Downstate Suburbs, 42.2% for Connecticut, 34.3% for Massachusetts, 34.4% for Maryland, 46.9% for Upstate New York, 23.9% for Ohio, 32.1% for Pennsylvania, and 41.1% for Vermont. Per student spending in this category increased 16.3% in the U.S. as a whole, but fell 18.0% in New Jersey.
But evidently it wasn’t enough. The school bus unions went on strike for a month in 2013, when competitive bidding actually went through, or the NYC increase would have been even higher.
Subsequently Mayor DeBlasio cut a deal to increase spending on school buses even further, reversing the “victory” of a mere 55.0% price increase above inflation over 12 years.
http://www.nydailynews.com/new-york/de-blasio-42m-school-bus-company-grants-debated-article-1.1909553
In Summary
During the Administration of former Mayor Mike Bloomberg New York City residents agreed to become much worse off, in higher taxes (already among the nation’s highest) and in other services foregone, to make those who work in or are connected to New York City schools much better off. In exchange New York City residents received – absolutely nothing. Since then NYC school spending has soared further, at the expense of other priorities, in the DeBlasio Administration.
With even more big increases in spending, in retroactive cash pay and additional costs for retirement benefits, yet to come. Meanwhile every aspect of “school reform,” however, defined, has been or is being reversed – except for the massive pension increase for those cashing in and moving out, (for now) pension decreases for new teachers. All “reform” has been was an empty promise to provide OK schools for a lot more money. Those who advocated for higher funding 20 years ago (including me) have been shown to be fools. We were robbed, will be robbed more, and there is no stopping it.
Even now, in exchange for sky-high school spending and record state funding, advocates for more assert that New York State’s school are inadequate – because they aren’t getting even more money.
http://www.buffalonews.com/city-region/schools/state-aid-for-new-york-schools-returns-to-pre-recession-level-20160401
“We’re getting closer to adequacy, but we’re not getting closer to equity,” said Richard Timbs, executive director of the Statewide School Financial Consortium.
I guess they’ll have to retaliate by making schools even more inadequate, if even more money is not paid by their increasingly poor neighbors.
In no other industry, except perhaps on Wall Street in the executive suite, is one likely to find such a huge increase in inflation-adjusted compensation, at a time when the inflation-adjusted compensation of most workers has been falling, combined with a sneering attitude toward those who are paying for it. A breathtaking sense of entitlement and contempt that is pandered to by everyone else in the political class, or else.
With another recession perhaps around the corner, and given how crushing these burdens are likely to become, it is no wonder that the United Federation of Teachers has shifted its attention from taking more out to providing less in return. A trend that is likely to accelerate soon, as the schools get worse and worse.
The one thing NYC children have gotten over all these years, over the objections of the United Federation of Teachers, is universal pre-kindergarten. To pay for the pension and wage increases and out of classroom time they have already scored, however, I predict the UFT will succeed in getting rid of this “unfairness” to their retired and soon to retired workers as soon as Mayor DeBlasio is (or is not) re-elected. Along with further deterioration of the infrastructure, cuts to the Administration for Children’s services, higher taxes, etc. etc. And don’t expect “fair student funding” to survive a shortage of resources in a “progressive” administration either. It will be quietly shelved, to the extent that it hasn’t been already.
And it is all under Omerta. All one hears in the media is the propaganda those benefitting pay people to produce. What you have just read is as comprehensive an analysis of public school revenues and expenditures over time and by type that one is likely to see. That is, in itself, an indictment. I am in a position to do this only because I’m an independent actor, doing it on my own time. Nobody’s gonna pay you to tell the truth.