
Over the past 20 years there has been an ongoing debate about the high cost of welfare, social services and Medicaid (for the non-elderly) in New York, occasional complaints about the cost of special education in the city’s schools, and objections to spending on and allegedly low productivity of the Metropolitan Transportation Authority. Since these services are funded by a mixture of federal money, state money and user fees, however, as well as local taxes, their impact on the high tax burden imposed by the City of New York is less than press reporting would have one believe.
What is more expensive, far more expensive, for city taxpayers is the cost of the so-called uniformed services – the Police Department, Fire Department, Department of Corrections, and Department of Sanitation. According to the NYC Office of Management and Budget, these agencies cost city taxpayers $16.3 billion in FY 2012, compared with $10 billion for health and welfare spending, $14 billion for public education, and $7.6 billion for most other agencies. And yet New Yorkers are faced with demands for even more money for the uniformed services, and threats if it isn’t received. So how did New York’s spending on the uniformed services compare with other places, according to the latest comparable data available?
This is yet another post based on my compilation of FY 2012 Census of Governments data from the U.S. Census Bureau. Information on where the data comes from and how it was compiled, along with spreadsheets that have tables for all public services and all areas, may be found here.
This is the finance phase of the Census of Governments. A comparison of police, fire and corrections employment based on the employment phase was posted last year.
An overview of Department of Sanitation employment was included in this post.
This data for Office of Management and Budget data I’ll refer to later can be found in a table on page 39 of this document.
http://www.nyc.gov/html/omb/downloads/pdf/sum5_12.pdf
Finally, a reorganized spreadsheet with expenditures per $1,000 of area residents’ income on the uniformed services for every state, every county in New York State and New Jersey, and selected counties elsewhere, is here.
It also includes most of the charts used to illuminate the discussion in the rest of this post.
Let’s start with comparative Police expenditures.
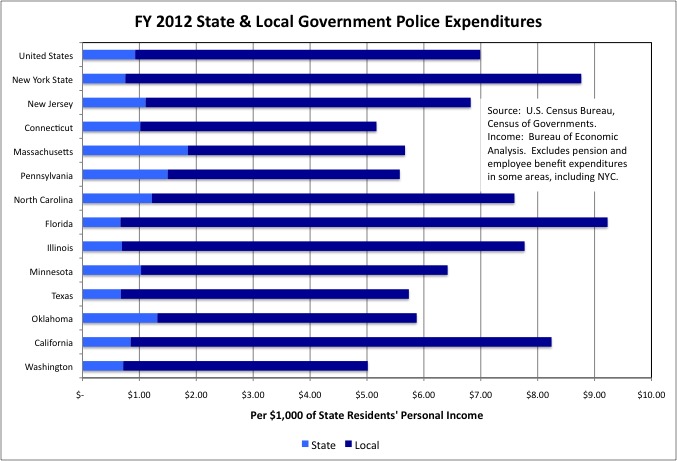
Local governments account for most state and local government Police expenditures, with state Police expenditures relative small. In FY 2012 State Police expenditures per $1,000 of state residents’ personal income was well below the U.S. average in New York State, and unusually high in Massachusetts. Including New York’s very high level of local government spending in the category, however, New York State’s state & local Police expenditures equaled $8.77 per $1,000 of state residents’ personal income, far above the U.S. average of $6.99. Based on statewide data, New York State ranked fifth behind the District of Columbia, Nevada, Florida and Alaska. Not even including a share of state police expenditures, New York City would have ranked second if it were a separate state, just based on the high cost of the NYPD.
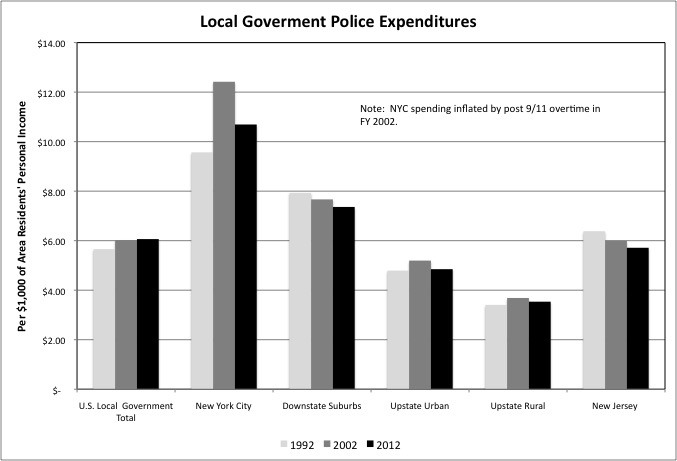
Within New York State, in fact, high police expenditures per $1,000 of personal income is something generally found downstate. New York City’s local government Police expenditures totaled $10.69 per $1,000 of city residents’ personal income during FY 2012. That was 76.4% higher than the U.S. average of $6.06 per $1,000 of personal income. The Downstate Suburbs were also above average at $7.36, while the Upstate Urban counties and Upstate Rural counties were below average at $4.85 and $3.54 per $1,000 of personal income respectively. The state police supplement local police in rural New York but the cost of state police was just $0.75 per $1,000 of state residents’ income.
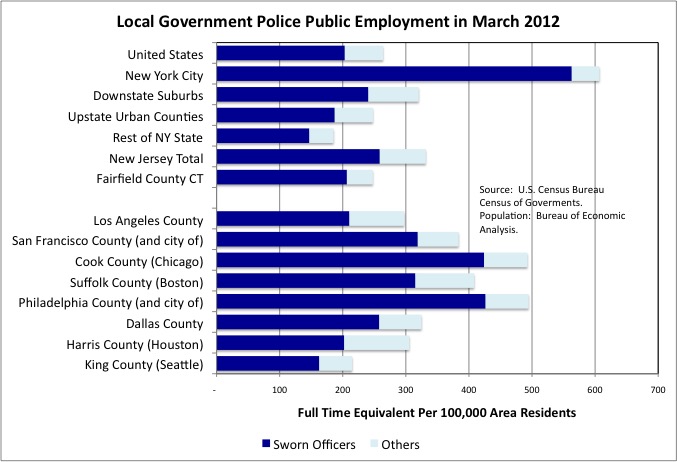
Police expenditures for FY 2002 are not comparable due to post-9/11 overtime, but one can say that NYC Police expenditures soared relative to city residents’ income from FY 1992 to FY 2012, a time of falling crime. These expenditures fell in the Downstate Suburbs and New Jersey, while being essentially unchanged Upstate. Still, one might conclude that New York City residents are getting a bargain by paying somewhat less than double the U.S. average as a share of their incomes on police. Given that the number of police officers in the NYPD per 100,000 residents is nearly triple the U.S. average.
A bargain, that is, unless one is aware what the Census of Governments data leaves out. Taxpayer pension contributions are excluded because for local governments with their own pension plans ,the Census Bureau counts those contributions as internal transfers within the city, rather than expenditures. With a police pension that allows immediate retirement after 20 years of work, with potentially two years being paid to be retired for each year actually worked, plus a high level of higher-paid disability retirement relative to other police forces, NYC’s taxpayer contributions to Police pensions were extremely costly at $2.4 billion in FY 2012, according to another Census Bureau database. That was nearly half again as much as the $5.1 billion in direct expenditures, including wages and non-personnel operating costs, that the Bureau reported.
The NYC Comptroller, moreover, lumps all employee benefit costs for most city agencies, including the NYPD, into one number. As a result with some exceptions non-pension employee benefits show up in Census Bureau data as in the “Other and Unallocated” category, rather than being allocated to individual government functions, as noted here.
In FY 2012, according to the New York City Office of Management and Budget, spending on NYPD fringe benefits other than pensions accounted for $1.7 billion of the $8.9 billion spent on the NYPD, and judgments and claims, also “Other and Unallocated” in Census of Governments data, cost another $150 million.
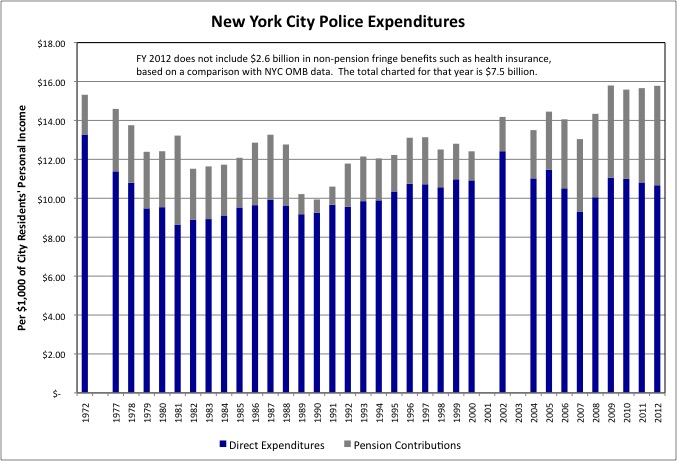
What we can say, however, is that just including “direct expenditures” on the police as identified by one Census Bureau database, and pension contributions as identified by another, New Yorkers have never paid as much of their personal income for the NYPD as they are now. That is because New York City has so many police officers compared with other places, and because police officers, if the cost of their benefits is excluded, are so much richer than the average New Yorker – despite low starting pay for the police.
To be fair, a high level of local government expenditure on Police seems to be characteristic of local governments in major urban counties, though we don’t know if in these areas pension contributions and other employee benefits are included. Compared with other types of local government employees, in fact, polices officer and firefighters are far more likely to have their pensions organized by small plans for individual local governments (and thus not included), rather than state plans to which local governments contribute (as in NY State outside NYC). There are hundreds of these small police and fire pension plans in California, Pennsylvania and Illinois. Underfunded police and fire pensions were the direct cause of several bankruptcies by small municipalities over the past few years, and will be the cause of many, many more. Many of these localities have been left with huge tax burdens and virtually no actual public safety.
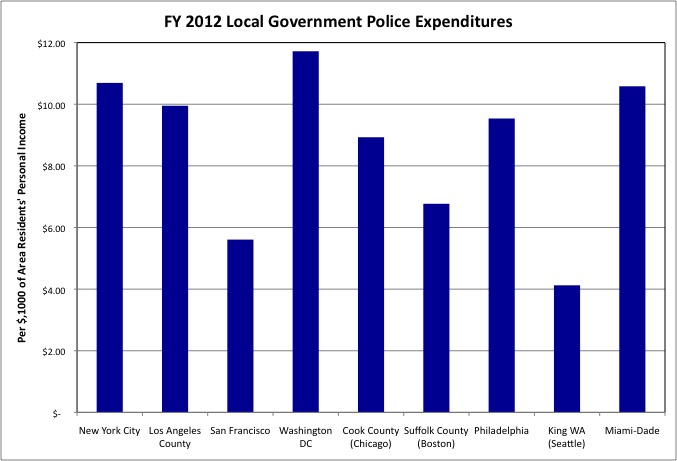
What we can say based on the data available is that even among major urban counties, New York City’s Police expenditures per $1,000 of city residents’ personal income were higher than in the other major urban counties selected for comparison. With the exception of Washington DC, where the police have extensive federal responsibilities paid for with federal money, and Miami-Dade County, where Police expenditures are at about the same level per $1,000 of personal income as NYC.
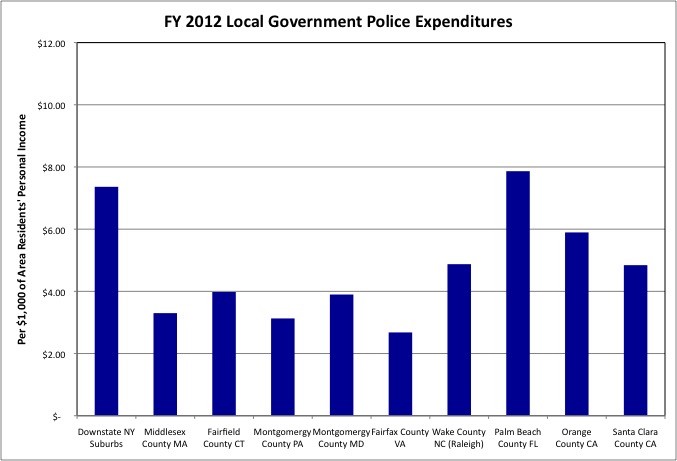
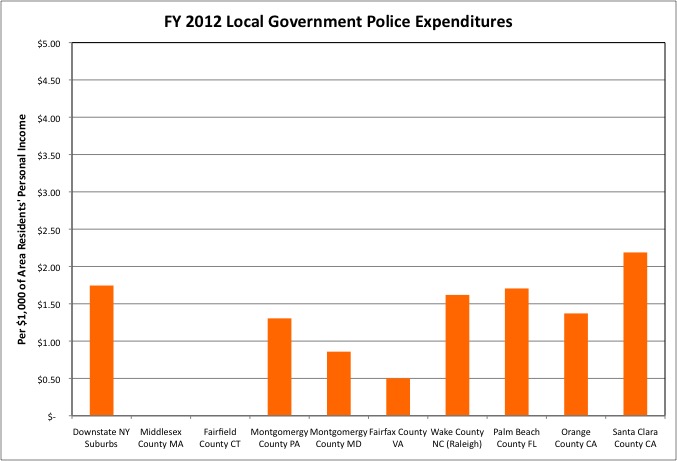
Similarly, local government police expenditures in New York’s Downstate Suburbs are far higher per $1,000 of area residents’ personal income than expenditures in other affluent suburban counties around the Northeast and elsewhere, with the exception of high-spending Palm Beach County in Florida. Note I’m using the same scale as the city chart. Within the Downstate Suburbs, police expenditures per $1,000 of personal income are near or below the U.S. average in the Lower Hudson Valley counties, above average in Suffolk County, and sky-high – almost to NYC levels – in Nassau County, at $9.88 per $1,000 of county residents’ personal income. Despite a much lower ratio of police officers to population. Although it may be that Nassau County’s recorded expenditures in this category include pension contributions and other employee benefits, whereas New York City’s do not.
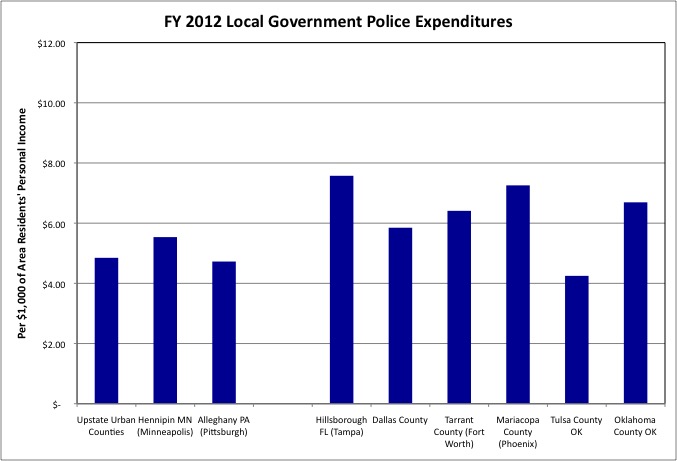
The level of Police expenditures per $1,000 of personal income in the Upstate Urban Counties is similar to Hennipin County in Minnesota, which includes Minneapolis, and Alleghany County in Pennsylvania, which includes Pittsburgh. And lower than in many other urban counties around the country that were selected for comparison.
So excessive local government Police expenditures in New York are really confined to the sky high pension costs and staffing levels in NYC, and sky-high pay in Nassau County.
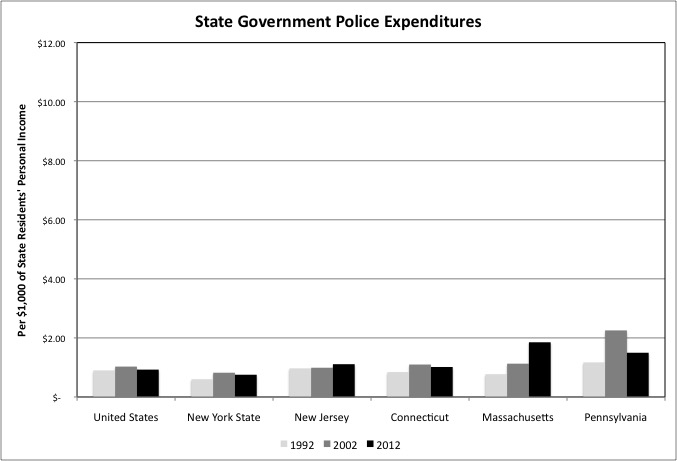
While New York’s State Police expenditures are relatively low, they are higher than they once were as a share of the income of state residents. Police expenditures are much higher, relative to the income of state residents, in Massachusetts. It would appear that the state police have taken on additional responsibilities in Massachusetts over the years, or just become more expensive. As a possible reason for the former, it was alleged in The United States vs. Whitey Bulger that the Boston’s mafia had infiltrated the local police and the FBI, but not the Massachusetts state police.
http://www.magpictures.com/whitey/
New York City’s sky-high Police expenditures per $1,000 of city residents’ personal income, relative to the national average, stand in contrast with a crime rate that is now below the U.S. average, based on FBI statistics. Crime has fallen across the U.S., as well as in NYC, as Generation Greed has exited the crime-prone teen and young adult years. So when I checked the FBI statistics for the first time in many years, the comparison between NYC and the U.S. average looked very much like it did years ago, albeit at lower levels.
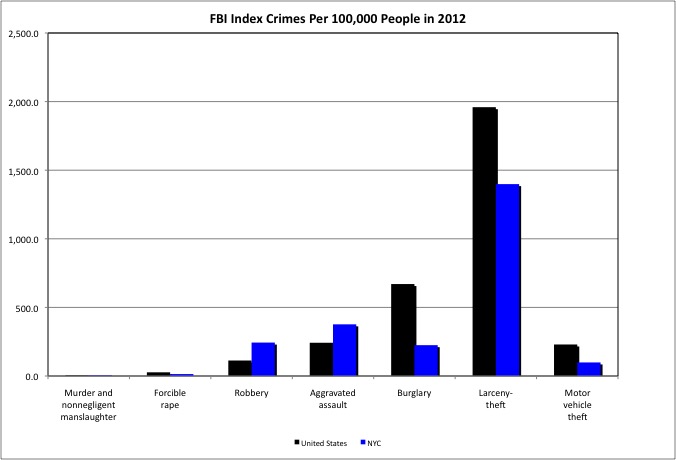

New York City was and is below the U.S. average in property crime and rape, as the city’s high density and activity levels work against the isolation required to commit those crimes unobserved. (The proliferation of security cameras and DNA evidence just adds to what ought to be a golden age of policing.) While NYC’s murder rate was once relatively high, the city was never the nation’s murder capital, with the high absolute number of murders here driven mostly by the city’s high population. NYC’s murder rate remained slightly above the U.S. average as of 2012. Based on press reports I would have guessed it was lower, but perhaps the rest of the U.S. has caught up with NYC’s declines. NYC, however, remains well above average in the one crime that has always distinguished it, robbery. This was, and still is, the capital of “your money or your life” although robberies are less common than they once were.
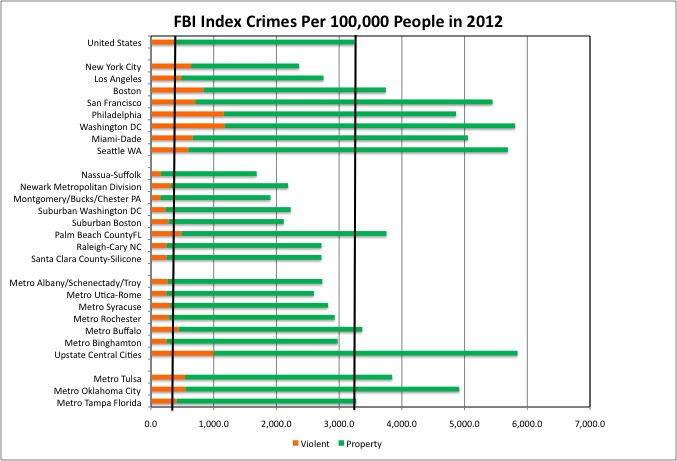
Still, New York City’s overall crime rate is lower than the U.S. average and lower than most major urban counties around the country. It is comparable to the rate found in the suburban northeast, which is in turn lower than suburban counties elsewhere in the U.S. Crime is also below average in most Upstate metro areas, despite much lower police spending, although crime appears to remain a problem in central cities upstate.
On the whole, no matter what the police union and City Council Speaker Melissa Mark-Viverito say, I believe it is a ripoff for the NYPD to threaten to not keep New Yorkers safe with any more than double the number of officers, per 100,000 residents, as the U.S. average. That would be about 25,000 officers, or about what NYC used to have up until the mid-1960s, when Generation Greed came along and the crime rate soared. They have about 35,000 officers now.
And no matter what the police and fire unions and Assemblymember Peter Abbate say, I do not agree there is an established right to disability pension fraud for politically powerful groups, and no reason to hold legitimately disabled officers and firefighters hostage to having high fraud levels reinstated. Which is what they are trying to do. That is a fight these unions are engaging in to cover up the extent to which they have screwed new hires across the board, leaving New Yorkers with (at one point) only the sort of police officers and firefighters who could be hired at $25,000 per year in starting cash pay — despite sky high spending overall on police officers and firefighters overall.
That no one even questions staffing and expenditure levels that are as high as they are shows the extent to which the public is being deceived. The same deception, it would appear, is more difficult to achieve in a parliamentary system like the one over the United Kingdom. According to The Economist magazine, there this issue is out in the open.
“Even after the coalition government’s cuts of 20% to police budgets, and an 11% fall in officer numbers since 2010, by historical standards there are still a lot of police about” according to this source. ‘The police have long resisted reductions to their budgets. But few would have thought the fiercest cuts, harshest criticism and clearest diminution in their political clout would come under the Tories, so long the party of law and order. With David Cameron, the prime minister, determined to save money and reform what he once called the ‘last great unreformed public service’, the once-close relationship between the Tories and Britain’s law-enforcers has soured.”
Unreformed in the UK because crime is out of control? Nope. Crime, particularly violent crime, is lower there than here. Unreformed because of the “police brutality” issues that that have been in the news in he U.S.? No, because in general UK police are respected rather than feared. Unreformed because they cost too much, relative to the income of other people. No one is talking about that here.
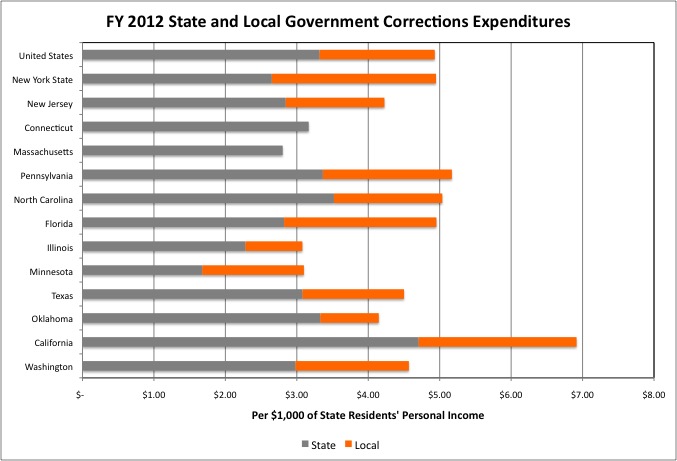
While New York State’s overall police expenditures are high, due to very high local government Police expenditures in New York City and Nassau County, its state and local Corrections expenditures are almost exactly at the U.S. average when measured per $1,000 of state residents’ personal income. New York State is still different, however, in that it only spends $2.65 per $1,000 of state residents’ personal income on state prisons, much lower than the U.S. average of $3.32, while local governments in the state spent $2.30 per $1,000 of personal income on local jails, well above the US. average of $1.61.
Comparing the other states it would appear that state and local government Corrections expenditures are relatively low in the Northeast and Midwest, where crime is low, and in many Sunbelt states, where concern for the welfare of prisoners is low. It is very high in California, with its extensive crime and judicial activism on behalf of prisoners.
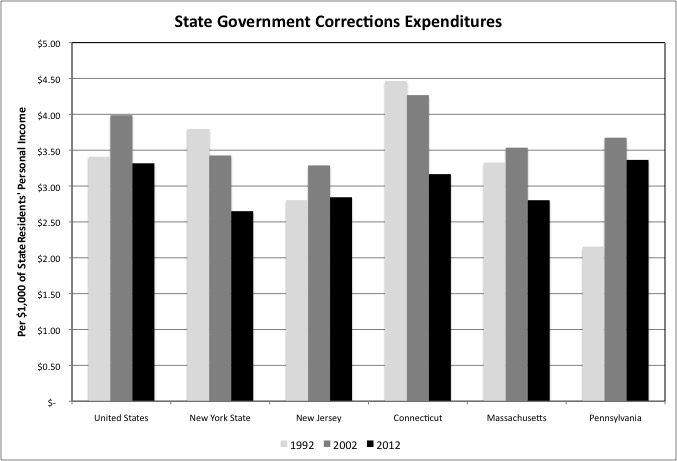
New York City may not have saved much on Police due to falling crime rates over the past 20 years, but New York State has saved money on Corrections. Attempts to keep the state prison system as a jobs program, despite a falling number of prisoners, somehow miraculously failed, and several prisons were closed. New York State’s spending on Corrections was above the U.S. average per $1,000 of personal income if FY 1992, after the prison-building boon under former Governor Mario Cuomo, but is has fallen 30.2% since. There has also been a large reduction in state government spending on prisons in Connecticut and Massachusetts over 20 years, with more recent reductions in New Jersey and Pennsylvania.
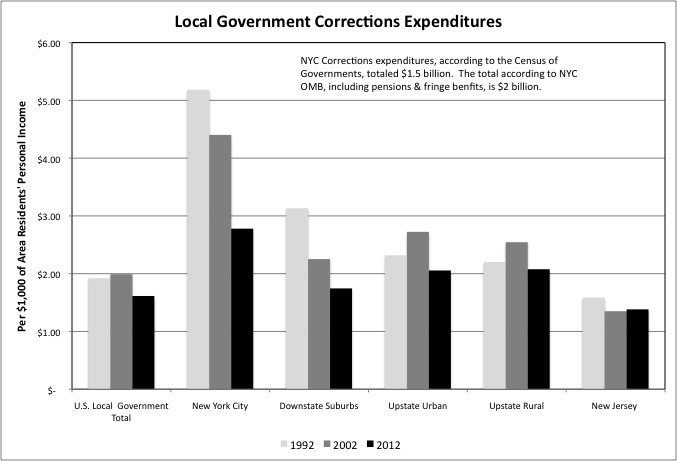
Like its relatively high spending on local government Police, New York State’s spending on local government Corrections was concentrated downstate in FY 1992, at $5.18 per $1,000 of city residents’ personal income in NYC and $3.13 in the Downstate Suburbs compared with a U.S. average of just $1.92. Since then, however, local government spending on Corrections has fallen by 46.4% relative to personal income in NYC (not including pensions and benefits) and 44.3% in the Downstate Suburbs, with the latter area now below the U.S. average. “And yet we’re made to be the target,” as Met fans are forced to hear over and over again, 24 hours a day and seven days a week. Local government Corrections expenditures have fallen less in Upstate NY, and remain above the U.S. average there.
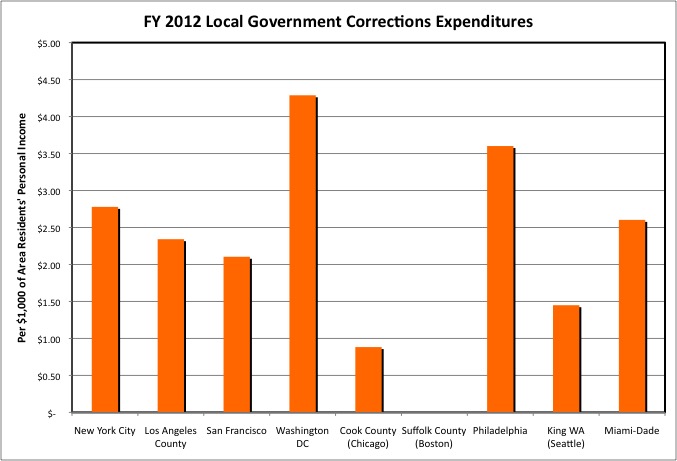
Despite this decrease, however, NYC’s local government Corrections expenditures suck up more of city residents personal income than in any other major urban county included for comparison, with the exception of Washington DC. And since the District of Columbia also services as that city’s state government, its Corrections expenditures are the equivalent of both state and local expenditures combined.
To the extent that affluent suburban counties even have local government Corrections expenditures, local governments in New York’s Downstate Suburbs still spend much more of their residents’ incomes on corrections than similar counties in the Northeast Corridor, and somewhat more than suburban counties elsewhere.
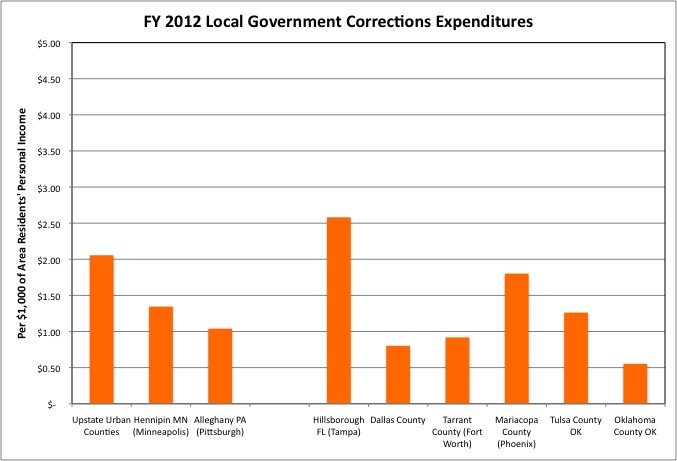
Local governments in the Upstate Urban counties, as well, spend a higher proportion of their residents’ personal income on Corrections than other counties around the country, with the exception of back-office haven Hillsborough County in metro Tampa, Florida. Spending on police and corrections seems extremely high in Florida in general, relative to the income of Florida residents, even though Florida is a low tax state overall. In New York State, meanwhile, the data implies that prisoners that would be held in state prisons elsewhere are held in local jails instead. Like the shift of Medicaid costs to the local level, any such prisoner shift has hurt New York City, where crime was concentrated in the past. With the city’s crime rate falling that may no longer be true in the future. In that case expect calls for a state takeover of these costs to grow.
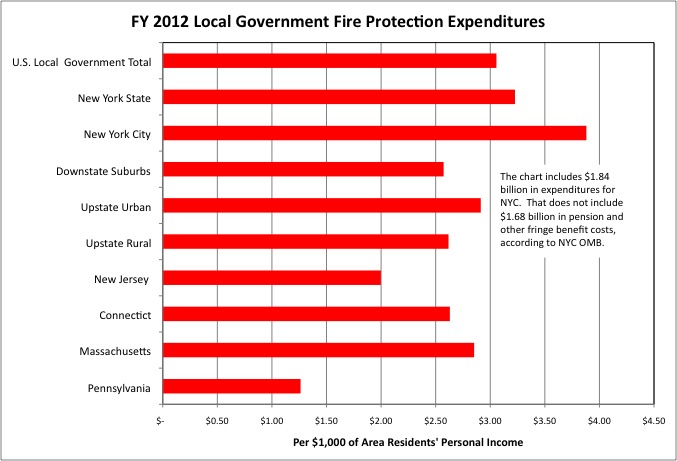
Fire Department expenditures are difficult to compare directly from place to place, because many places have volunteer, rather than professional, fire departments, or a mix of professionals and volunteers. What we can say based on Census of Governments data is that New York City’s Fire Protection expenditures were significantly higher, per $1,000 of personal income, than the U.S. average. Even though the exclusion of pension and other benefit costs from the city’s figures means nearly half of the cost of the Fire Department was excluded. Fire Protection expenditures tend to be lower than the U.S. average per $1,000 of personal income elsewhere in New York State and elsewhere in the Northeast.
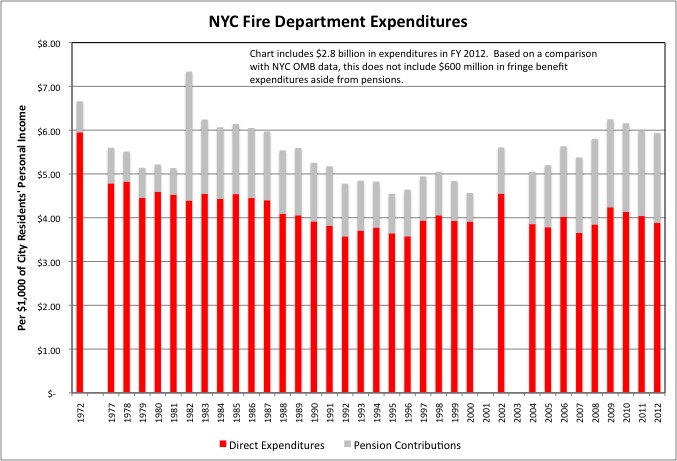
Including “direct expenditures” as tabulated by the Census Bureau, and taxpayer pension contributions, NYFD expenditures are absorbing a higher share of city residents’ personal income than in the early 1990s, but not more than in 1972. Pensions are driving that increase in cost. The share of NYC firefighters retiring with more lucrative disability pensions is very high, and was very high even before 9/11, and the 2000 retroactive pension increase caused pension payouts to soar. The NYC firefighters pension fund is one of the most underfunded in the country, and recently passed the NYC teachers’ pension fund as the most underfunded in the state.
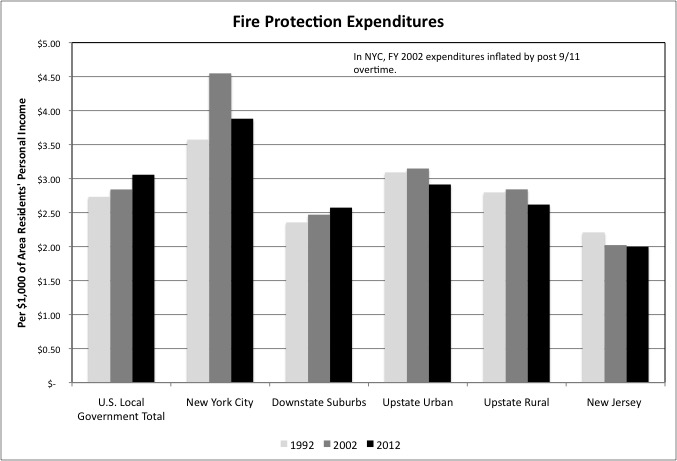
As is the case of the NYPD, post-9/11 overtime reduces the value of comparisons with NYC Fire Protection expenditures per $1,000 of city residents’ personal income in FY 2002. But NYC expenditures in this category did increase from FY 1992 to FY 2012, even excluding pensions and other benefits. Spending also increased in the Downstate Suburbs, while trending downward after FY 2002 in Upstate New York. Outside NYC pensions and other benefits may be included in these spending levels.
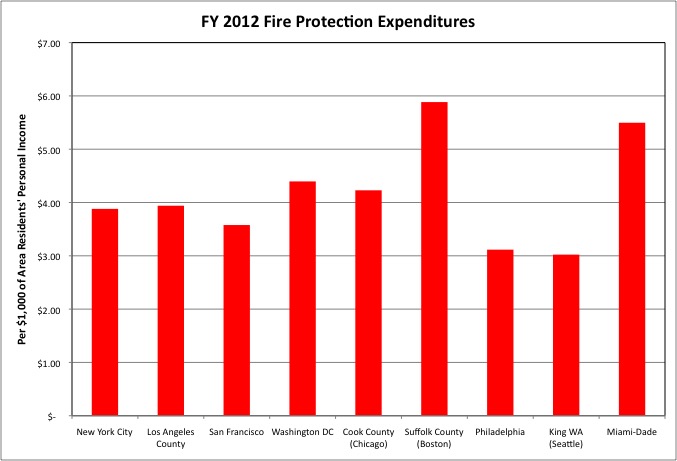
And as is the case for Police, expenditures on Fire Protection tend to be high per $1,000 of area residents’ personal income in major urban counties. New York City’s expenditures in this category are about the same as in many similar areas. Fire Protection expenditure are unusually high in Suffolk County MA (mostly Boston) at $5.88 per $1,000 of county residents’ personal income, and Miami-Dade at $5.50, compared with NYC at $3.88 and the U.S. average of $3.06. New York City’s expenditure level including taxpayer pension contributions (but excluding other fringe benefit costs) was $5.94.
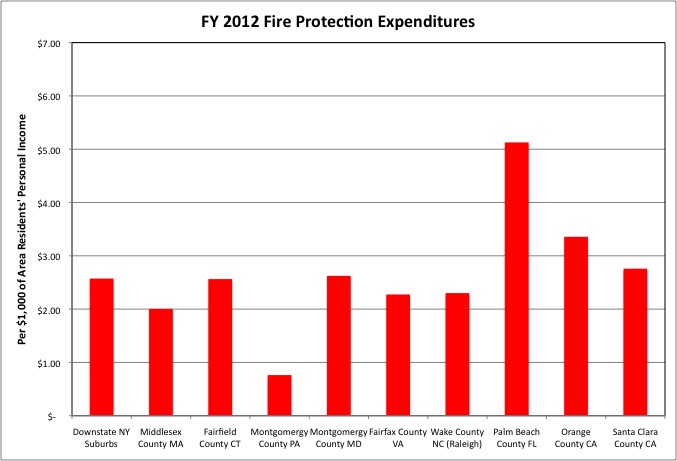
Suburban areas tend to have lower Fire Protection expenditures per $1,000 of their residents’ personal income, in part because average incomes are higher, and in part because many localities have volunteer fire departments. Local government Fire Protection expenditures per $1,000 of personal income are about the same in New York’s Downstate Suburban counties, collectively, as in similar affluent suburban counties. Westchester and Suffolk are at about the U.S. average of $3.06 per $1,000 of personal income, and the other downstate suburban counties are lower.
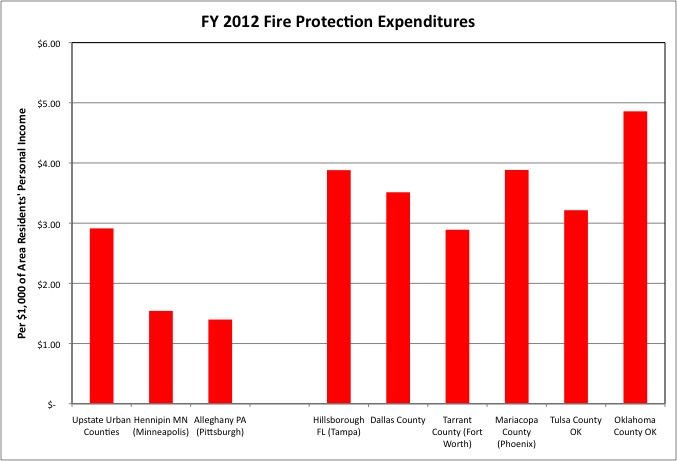
The level of Fire Protection expenditures per $1,000 of personal income in the Upstate Urban counties was, collectively, higher than in Hennipin County (Minneapolis) and Alleghany County (Pittsburgh), two “Frostbelt” areas chose for comparison, but lower than in comparable Sunbelt counties.
So New York City is spending far more than average on Police, and apparently more than average on Fire Protection, than the U.S. average. Is this because the city’s police officers and firefighters are shirkers, who look to avoid having to work? Not based on my observation. Based on the high number of fire trucks, patrol cars, and ambulances that showed up when my father-in-law, who was staying with us, had to go to the hospital and my wife dialed 911, I’d say they are desperate for something to do. The huge crowd barely fit in the house. Nope, the interests that want more staffing are the unions that want more dues. And the politicians that want more campaign contributions from those union dues, in exchange for their robbing the serfs.
As is he case for Fire Protection, local government Solid Waste collection expenditures are difficult to compare from place to place. In some places, municipal employees pick up the trash. In others, the municipality pays a private company to do the work. That would also show up as local government expenditures in Census of Governments finance data, if not as employment in Census of Governments employment data. In still other places people are left to hire trash collectors on their own, and pay for it themselves. In theory that would risk a huge public trash problem in places where low income people, and people from countries where sanitation standards are lower, are concentrated. Rather than pay scarce money, such people might dump trash in the street.
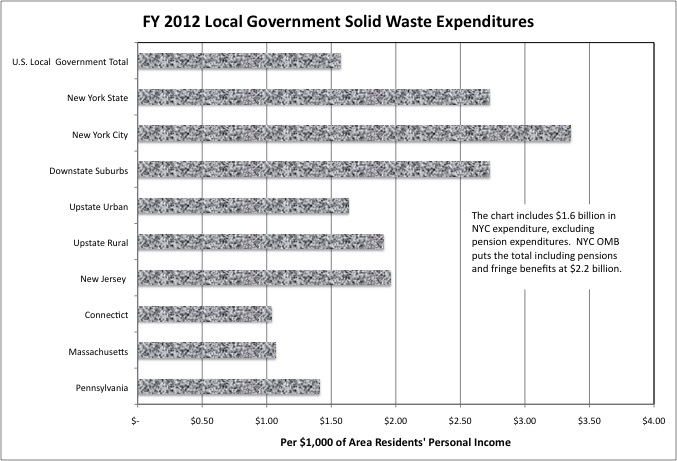
New York City spent $3.35 per $1,000 of city residents’ personal income on Solid Waste Collection in FY 2012, not including taxpayer pension contributions and employee benefits. That was far higher than the U.S. average of $1.57, more than double even though in some parts of the U.S. employee benefits might be included in the data. Local governments in the Downstate Suburbs had $2.72 per in Solid Waste expenditures per $1,000 of personal income in FY 2012, also well above the U.S. average. Spending was above the U.S. average relative to income in Upstate New York as well. Even though people I know who live Upstate either have to bring their own trash to the town dump, or pay a private carter to do it for them.
It should be noted that NYC’s local government expenditures on solid waste collection are high even though commercial businesses are required to pay private carters to take away the trash. That spending does not show up in this data.
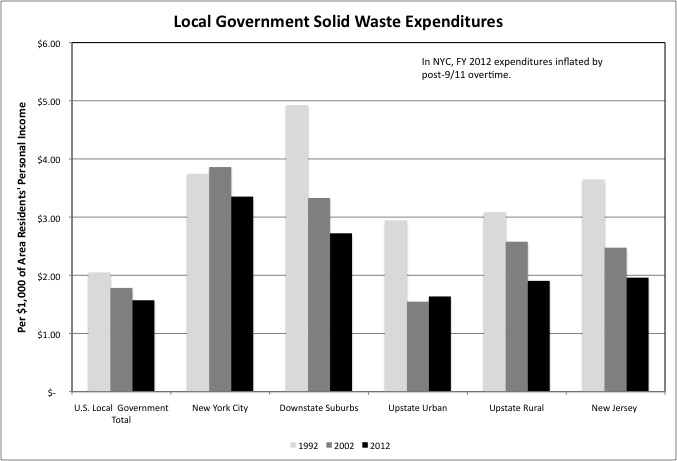
Pensions and other benefits aside, local government solid waste expenditures have trended downward relative to taxpayer personal income over 20 years in NYC, other parts of NY State, New Jersey and the U.S. as a whole. Crowding out of current work by rising costs for the retired may be part of the reason. In New York City, the amount of area a crew of Sanitation workers has to cover has been fixed by contract, because otherwise the workers could engage in a slowdown to avoid picking up the trash. In the past, when the NYC population was falling, those working in depopulated areas who hustled could work a half day or less. Today, however, those working in areas in which the population is growing might have to work harder. The city’s increasing population means that its Solid Waste employment is falling relative to population, decreasing the per person cost.
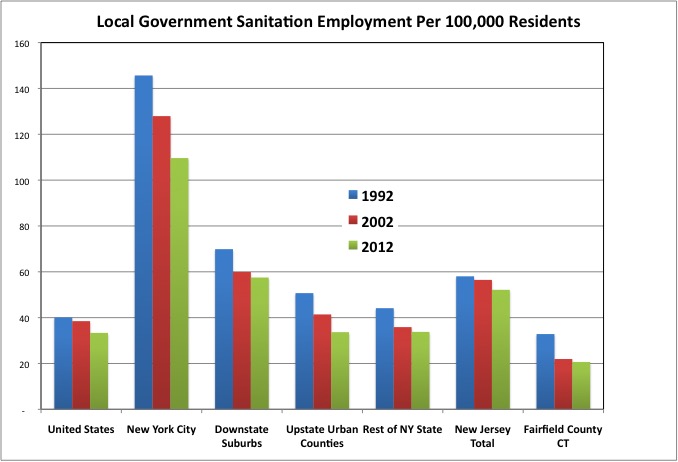
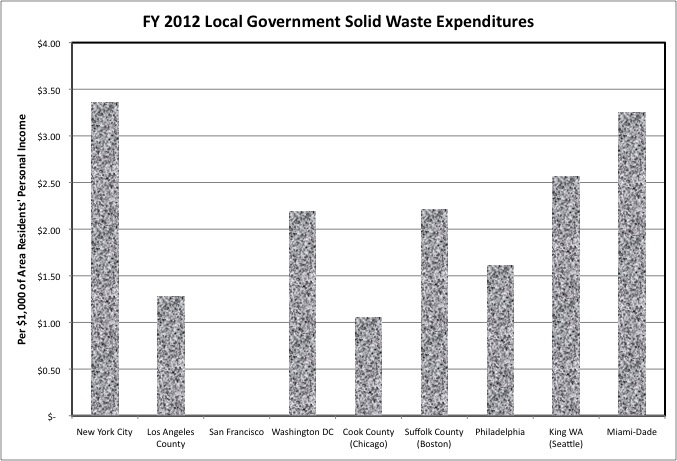
Despite the downtrend, New York City’s local government expenditures remain very high per $1,000 of its residents personal income compared with other major urban counties with municipal solid waste collection. As my prior analysis of employment and payroll shows, the March 2012 pay per Department of Sanitation worker was much, much higher in NYC than the U.S. average, and staffing levels were high as well. NYC local government workers in the Solid Waste function were paid (cash) 75.5% more than the U.S. average per worker in March 2012, compared with 36.3% above average in the Downstate Suburbs and about average or below in Upstate New York. And NYC employed 110 workers per 100,000 residents in this function that year, compared with (for example) 73 in Philadelphia. No wonder NYC’s expenditures were relatively high in the category.

Despite a sharp drop over 20 years, local government Downstate New York’s Solid Waste expenditures were also very high, per $1,000 of area residents’ personal income, compared with other affluent suburban counties around the country, though lower than NYC. Among the affluent suburban counties chosen for comparison it is once again Palm Beach County, Florida that spent more than the Downstate Suburbs.
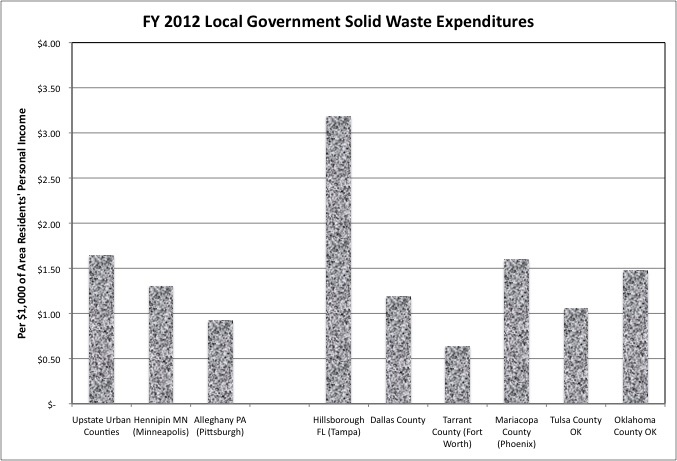
And local government Solid Waste expenditures are also higher in the Upstate Urban Counties than in the other counties chosen for comparison, per $1,000 of area residents’ personal income. Higher than in the Minneapolis and Pittsburgh areas, areas thought to have fared more or less well economically compared with other Frostbelt metros away from the Northeast Corridor. And higher than in many of the Sunbelt metros that many young Upstaters are moving to. Once again, however, the central county of metro Tampa Florida, where many NYC firms locate their back offices, has higher spending in this category as well.
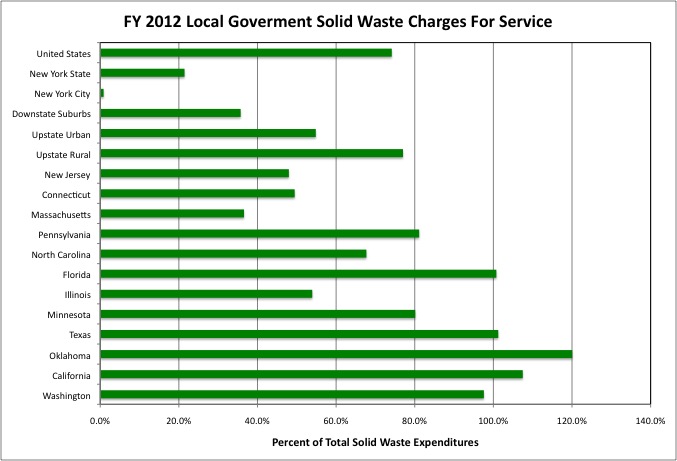
Even among those places that provide municipal solid waste collection, many local governments attempt to over their costs with charges for this service rather than local taxes. According to Census of Governments data, in fact, charges for services equaled 74.2% of local government Solid Waste expenditures in FY 2012. Considering the fact that in many cases, as measured by the Census Bureau, those expenditures do not include pension costs, in some cases they do not include employee benefit costs, and in all cases they do not include interest on debts, it may be fair to say that having residents pay for Solid Waste collection with charges is the norm. In some cases Solid Waste collection is private, and the charges are for tipping fees at local government landfill rather than collection. In any event in New York City there is little if any charge for solid waste collection.
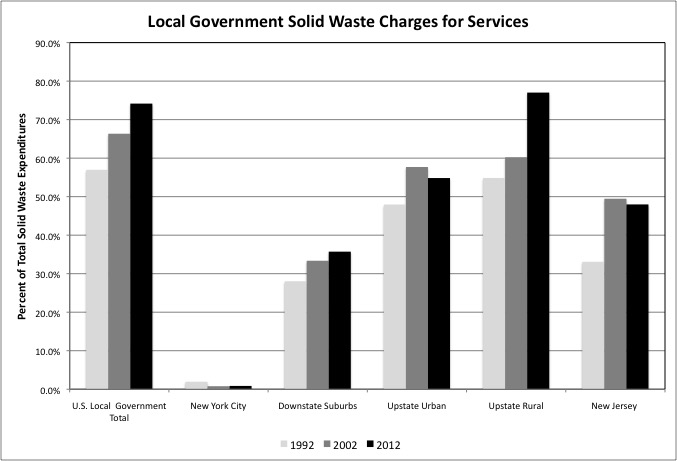
As local government fiscal crises have intensified, the share of local government Solid Waste expenditures covered by charges for services has been jacked up in the Downstate Suburbs, Upstate Rural Counties, the U.S. as a whole, and (from 1992 to 2002) Upstate Urban and Upstate Rural areas as well. New York City bucked the trend.
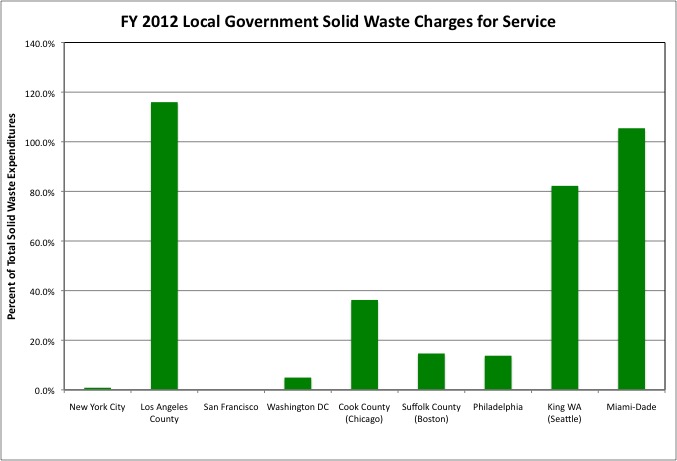
Among major urban counties, in some (Los Angeles, King-Seattle and Miami-Dade) charges for services cover most of the cost of local government Solid Waste collection and disposal. The City of Seattle charges by the barrel, and is known for the “Seattle Stomp” as residents try to pack more trash into less space. In other major urban counties, however, charges for services are a smaller share of expenditures on Solid Waste collection, including Philadelphia and Washington DC. In Cook County the suburbs charge for trash collection, but the City of Chicago does not. As that city faces bankruptcy in a pension crisis, some have called for trash collection charges to pay for those pensions. And the New York Times has questioned Chicago’s collection costs.
http://www.nytimes.com/2011/02/13/us/13cncgarbage.html?_r=3&ref=chicagonewscooperative
“The 2011 budget for Chicago’s Bureau of Sanitation, the division of the Department of Streets and Sanitation responsible for picking up and disposing of trash and recyclables, is about $141 million. The city expects to collect about 975,000 tons of garbage and recyclables this year, which is about $145 a ton. By contrast, Los Angeles and Houston, the cities closest in size to Chicago, spend $133 and $94 a ton, respectively. In Philadelphia, an old, densely-populated city where landfill space is more scarce and expensive, the cost is about $110 a ton. When costs like employee benefits, worker’s compensation, and administrative expenses are factored in, the true cost of picking up and disposing of garbage in Chicago is more than $200 a ton.”
I wonder what it is in New York?
“DSNY is the world’s largest sanitation department, collecting more than 10,500 tons of residential and institutional garbage and 1,760 tons of recyclables every day.”
http://www1.nyc.gov/site/dsny/about/inside-dsny.page
Assuming that means every day, including weekends, and based on the OMB figure of $2.1 billion in expenditures including pensions, fringe benefits, debt services, and Other Than Personal Services, that comes to $517 per ton. Isn’t that because of the high cost of sending trash to out-of-state landfills? Perhaps, but based on the OMB table NYC’s cost of the Department of Sanitation for personnel services alone is $332 per ton. And the Times is complaining about the cost of Solid Waste pickup in Chicago? No one examines public services the way a consumer advocate, say Consumer Reports, examines private sector products and services. Certainly not the New York City “public advocate,” a politician in a placeholder seeking to advance their career and needing interest group support to do it.
The cost of Solid Waste collection and disposal is apparently quite high, relative to the income of local residents, in the Downstate Suburbs and Upstate Urban counties as well. And to disguise that fact these areas cover less of those costs in charges for services.
It appears that charges for services, while falling more heavily on the less well off, at least call attention to the value ordinary people, including the less well off, are getting in public services. Even if you want high taxes, money spent on public service A is not available for other things, and while spending far more than average on the uniformed services New York City faces an ocean of unmet needs at the highest state and local tax burden in the country. Broad based taxes lead to the second most questions about what things cost, although if those taxes are paid into a general pile the city can blame the state which blames the city and each producer interest can point at the other. Excess spending funded by debt and deferred pension obligations? That appears to raise no questions of all, until bankruptcy approaches and it is too late.
The next post will examine state and local government spending on infrastructure using Census of Governments data.