
The United States, based on press reports, is heading for an infrastructure crisis that today’s politicians are desperate to ignore, in the hopes that their generation can avoid paying for it and pass on before the consequences hit those coming after. In the suburbs and Sunbelt the post-WWII infrastructure, often built with federal money redistributed from older cities, is reaching the point where substantial rehabilitation and replacement will be required. But no one wants to pay. In New York State, one sees this in the financial drama over the replacement of the 1954-built Tappan Zee Bridge, and the insistence that tolls be kept far lower on the new bridge than in the Port Authority Crossings to the south, or the Triborough Bridge and Tunnel Authority crossings within New York City.
Even where the infrastructure has been maintained money has been borrowed for past maintenance, and the interest on that debt now consumes revenues that were supposed to be reserved for transportation. There is no real money for the next MTA Capital plan, most of which is maintenance. Almost all the money being paid into the New York State transportation trust fund for roads and bridges is going to past debts, as is all the money going in to the New Jersey transportation trust fund. Twenty years of selfishness by Generation Greed politicians has come home to roost, and the wolf is at the door. And yet their more recent replacements – New York City Mayor DeBlasio, New York State Governor Cuomo, New Jersey Governor Christie, President Obama, and whoever will follow the indicted and should-be indicted members of the state legislatures and Congress – want to do nothing but close their eyes and hope it goes away. It is in this depressing context that the following post will review data on Infrastructure revenues and expenditures from the U.S. Census Bureau’s Census of Governments.
Just for some housekeeping, this post is based on data from the finance phase of the 2012 Census of Governments and other data from the Governments Division of the U.S. Census Bureau. Where it came from, how it was tabulated, and large spreadsheets with tables for all local government revenues and expenditure items for all counties New York and New Jersey, the U.S. average, and selected counties elsewhere, is here.
https://larrylittlefield.wordpress.com/2015/04/12/background-and-databases-2012-census-of-governments-state-and-local-finance-data/
The 2012 data from the employment phase of the Census of Governments was released last year, and I wrote a post on public and private sector infrastructure employment located here.
https://larrylittlefield.wordpress.com/2014/05/11/infrastructure-census-of-governments-employment-and-payroll-data/
Not all public infrastructure expenditures show up in the public employment data, because the public sector often hires private companies to do the work. But it should show up in government expenditures.
A reorganized spreadsheet with tables with infrastructure expenditures for all areas, and most of the charts used in the rest of this post, is here.
Let’s start with a state level overview of the government functions to be examined.
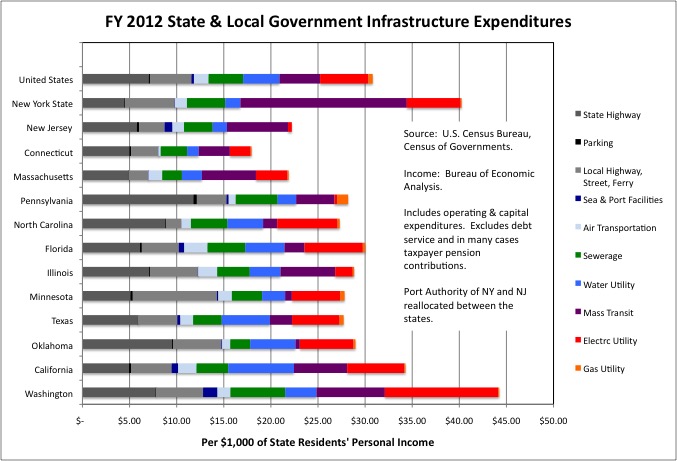
The government functions, as defined by the Census Bureau, that are the subject of this post are the Highways function, which also includes state and local government expenditures on local streets, bridges and ferries, public Parking, the Sea and Port function, Airports, Mass Transit, Water Utilities, and Sewerage. In New York and New Jersey private companies, rather than government run companies, provide electric and gas service, the New York Power Authority aside. But these functions are included just to be comprehensive.
The expenditure data is generally presented per $1,000 of the personal income of everyone living in the state, county, or other area. Taking all these forms of infrastructure together, U.S. state and local governments spent $30.81 per $1,000 of all U.S. residents’ personal income on infrastructure in FY 2012, or 3.08% of the people’s income. State and local governments in New York State spent $40.05 per $1,000 of personal income, or 4.06% of state residents’ personal income. New York’s higher spending is more than 100 percent accounted for by higher spending on Mass Transit, on which more is spent in New York than in other state.
Overall, New York State’s infrastructure expenditures ranked seventh, measured per $1,000 of personal income, among 50 states and the District of Columbia. The top six were a bit surprising to me – low density, mostly rural states Alaska, Nebraska, Tennessee, Utah, Washington State, and North Dakota. New Jersey’s state and local governments spent just $22.03 per $1,000 of state residents personal income on infrastructure in FY 2012, which would have ranked 47th, even though that state also has an expensive Mass Transit system. Massachusetts, Rhode Island, Connecticut and New Hampshire round out the bottom five.
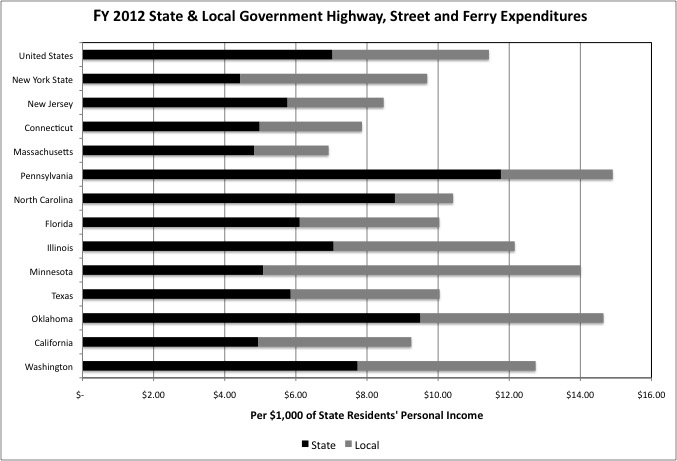
The U.S. average for state and local government spending on Highways (bridges, streets, and ferries) was $11.43 per $1,000 of personal income in FY 2012. New York State was lower overall at $9.69, but its local government Highways spending, at $5.26 per $1,000 of personal income, was higher than the U.S. average of $4.40. New Jersey, Connecticut and Massachusetts were also below average in spending in this category at $8.47, $7.86 and $6.92 per $1,000 of personal income respectively. All of these states have transportation funding crises in the news.
A recent 60 Minutes report on America’s crumbing roads, bridges, and transit lines, however, focused on Pennsylvania.
http://www.cbsnews.com/news/falling-apart-america-neglected-infrastructure/
There state and local government Highways expenditures were above the U.S. average at $14.91 per $1,000 of personal income in FY 2012. So it isn’t just how much the government spends, it is also what the people get for it, and how much of the money goes to keep up existing roads, streets, bridges and transit lines rather than create new ones – and the future maintenance burden that goes with them.
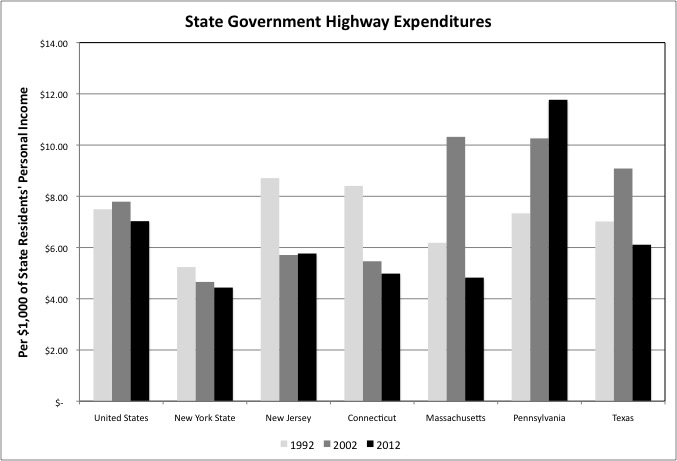
While all taxpayers, including those who do not have their own motor vehicles, pay for local streets, motor vehicle and gasoline taxes and tolls have traditionally covered the much (and in some places most) of the cost of federal and state highways. But the gas tax has lagged behind inflation, and so has spending on State Highways per $1,000 of personal income in many parts of the country. The drop was from FY 2002 to FY 2012 for the U.S. as a whole, with big drops from FY 1992 to FY 2002 in New Jersey and Connecticut. If you want to become popular by cutting taxes and reducing or removing tolls, but don’t want consequences voters can see in the short run, cutting infrastructure maintenance is a good bet. It is a bet lots of Northeastern Governors seem to have made.
Massachusetts had the Big Dig in Boston, which inflated Highways expenditures in FY 2002 but that project drained its transportation resources and its spending on Highways is now much lower. There is a slow trend down in New York, to point lower than in the rest of the Northeast, but in New York City, where nearly half the state population lives, the City of New York maintains the state highways. So those expenditures show up as local government spending. Pennsylvania has bucked the national trend. Its state Highways expenditures were up 60.4%, per $1,000 of that state’s residents’ personal income, from FY 1992 to FY 2012.
There has also been a slight downtrend in U.S. local government Highways (streets, bridges, ferries) expenditures per $1,000 of personal income over 20 years. That doesn’t mean less work is getting done – productivity gains in street repaving, for example, could mean it takes less of people’s income to maintain streets than in the past.
On the other hand, as I’ve shown most Americans are earning less than in the past, a trend covered over first by the entry of women into the workforce, which kept income rising in two-worker households, then by inadequate retirement savings, which kept current spending high despite lower earnings, and then by rising public and private debts. Until the debt-driven economy faced collapsed in 2008 and younger generations found out, despite soaring federal debts to keep things afloat, just how poor they actually were.
https://larrylittlefield.wordpress.com/2015/03/18/the-american-economy-hair-of-the-dog-means-more-debt-for-the-doomed/
Yet federal and state labor laws and union and contractor political contributions ensure that public workers, and government contractors, keep getting richer in good times and are spared any sacrifices in fiscal crisis. If the extent to which those in the political/union caste are getting richer than everyone else is not offset by rising productivity, the same level of infrastructure expenditures per $1,000 of everyone’s income, let alone less spending in the category, could lead to infrastructure decline.
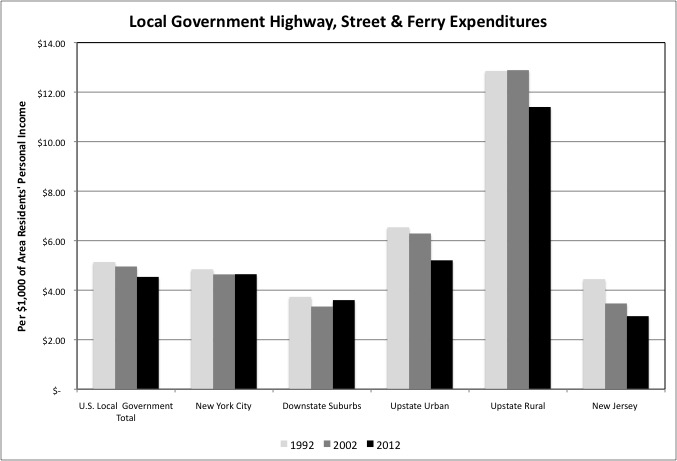
New York City’s local government Highways etc spending has remained essentially unchanged over the years. The city is not adding highways and bridges, and it has far less highway and street mileage relative to population than any other part of the country. As a city built on islands, however, it has many older bridges and highways and these have been extensively rebuilt over the past 30 years at great cost. Despite the city’s relative lack of streets to maintain, its spending in this category is at about the U.S. average per $1,000 of city residents’ personal income.
In the Downstate Suburbs the street network is more extensive but more recent, and average incomes are high. Local government Highways expenditures per $1,000 of personal income are relatively low but stable there. The FY 2012 U.S. average was $4.40 per $1,000 of personal income in the U.S., $4.54 in New York City, and $3.48 in the Downstate Suburbs. In New Jersey, local government Highways etc. expenditures fell from $4.45 per $1,000 of personal income in FY 1992 to $2.95 in FY 2012. Which may be why so many of New Jersey’s smart people are looking to get out while the getting is good.
Local government Highways expenditures are very high in Upstate New York, but have been falling. The FY 2012 averages were $4.40 per $1,000 of personal income in the U.S., $5.21 in the Upstate Urban Counties, and $11.40 in the Upstate Rural Counties – where people are spread out and incomes are low. Highway and street expenditures were even higher in the Upstate Rural Counties, at $12.89 per $1,000 of personal income, in FY 2002. High snow levels contribute to these high costs. The spawling living and working patterns of the past 60 years, with people having to drive to just about everything, make even less sense in Upstate New York than elsewhere.
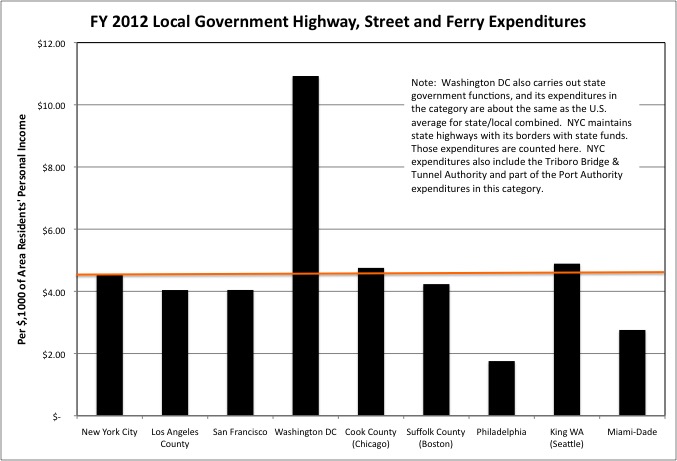
New York City’s local government Highways etc expenditures are slightly higher, per $1,000 of city residents’ personal income, than many of the other major urban counties around the country. Spending is low in this category in Philadelphia, a city that is broke.
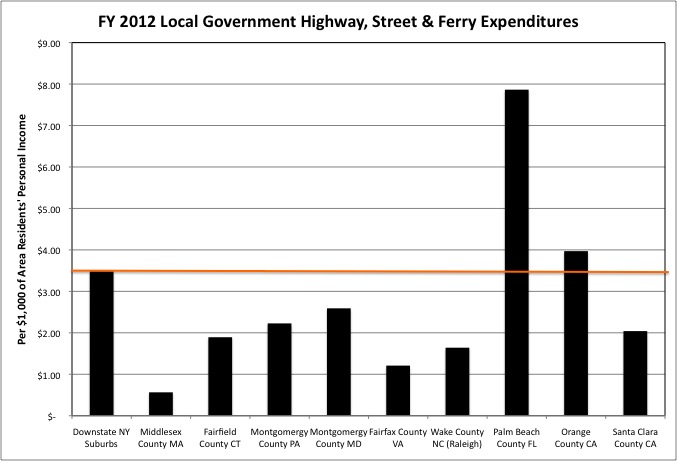
Although local government Highways expenditures are below the U.S. average in New York’s affluent Downstate Suburb counties, it is even lower in most similar affluent suburban counties around the U.S. This may be the result of inadequate maintenance of an infrastructure put in place years ago and now aging, or it may be the result of these areas having a lot of income per square meter of pavement. Fairfax County, Virginia is trying the “small government” experiment of evolving into a major urban county with very little infrastructure expenditure. I recommend that those who can’t stand driving in New York area traffic avoid suburban metro Washington. As for Palm Beach County, I continue to be struck by how high local government spending is I many categories in major Florida counties, per $1,000 of personal income, despite the state’s low state and local tax burden per $1,000 of personal income.
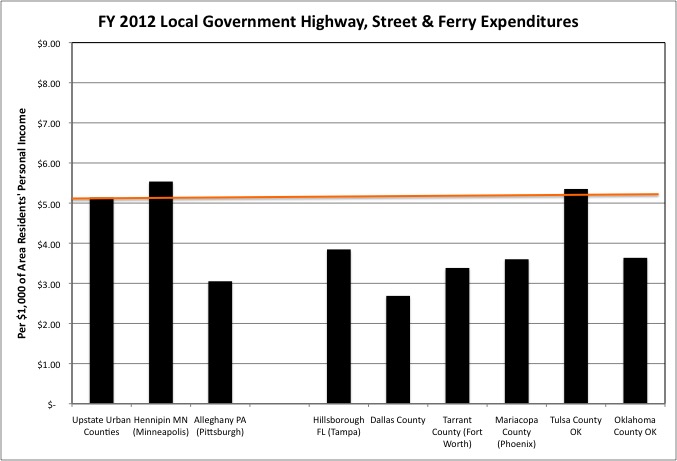
Local government Highways etc. expenditures were at about the same level per $1,000 of personal income in the Upstate Urban counties as in Hennipin County, which includes Minneapolis, but well above the average for Alleghany County, which includes Pittsburgh. Pittsburgh’s deteriorating bridges were a focus of the 60 Minutes report. In many growing urban Sunbelt counties local government Highways expenditures are lower per $1,000 of personal income.
With the State of New York providing some of the money, but well-connected locals getting the jobs, one wonders how good a deal Upstate communities are getting on highway, street, and bridge maintenance. The $11.37 per $1,000 of personal income local governments in Rural New York counties spent on Highways was more than in any other state. With state and local government expenditures combined, however, North Dakota, South Dakota and Vermont came in at $32.75, $24.81, and $24.11 respectively.
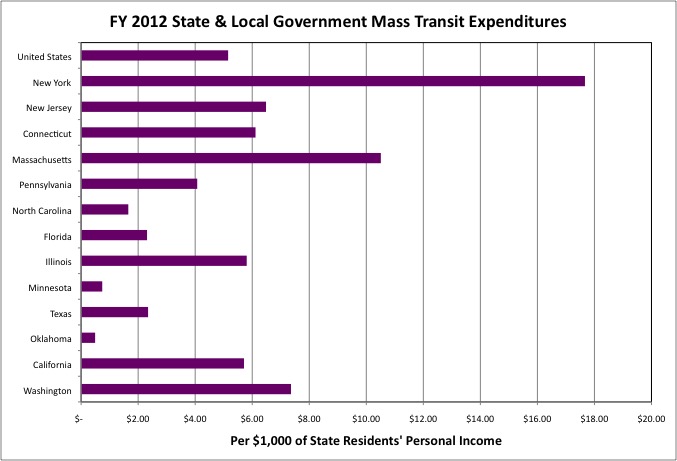
New York State, along with other Northeastern and West Coast states and the state of Illinois, have notably more Mass Transit expenditures per $1,000 of personal income than the U.S. average. Since extensive mass transit systems are something that some areas have and other areas do not, and because regional transit agencies often cross county lines, direct spending comparisons from place to place using Census of Governments data are difficult. For historical reasons, New York City Transit counts as part of the local government “City of New York” even though it has been part of the state-run MTA since 1968. Its expenditures count as local government expenditures, while virtually all other mass transit expenditures in New York State are counted as state government expenditures.
New Jersey Transit also counts as state government expenditures. The PATH system, part of the bi-state Port Authority of New York and New Jersey, counts as New York City local government, if not part of the City of New York. I’ve tried to take the available Census of Governments data and assign it to the proper place as best I can using data from the National Transit Database. My most recent compilation of comparative mass transit finance using data from that database, which is a better examination of mass transit in isolation, is here.
https://larrylittlefield.wordpress.com/2014/02/17/metro-new-york-transit-finance-an-analysis-of-data-from-the-national-transit-database-for-2012/
And with the MTA and New Jersey transit heading for bankruptcy, WordPress tells me quite a few people are reading that pst even though I wrote it 15 months ago. Let’s proceed with Census of Governments data on Mass Transit for the same year.
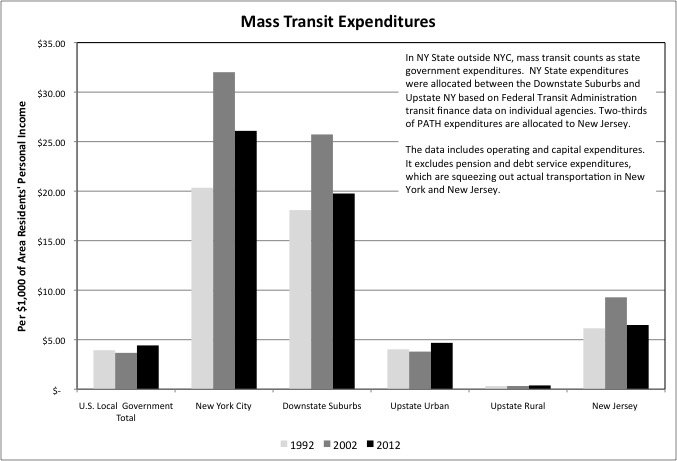
Mass transit expenditures are concentrated in Downstate New York in general and New York City in particular. New York City had $26.09 in mass transit operating and capital expenditures per $1,000 of city residents’ personal income in FY 2012, and the Downstate Suburbs had $19.76 in expenditures per $1,000 of area residents’ personal income, each multiples of the U.S. average of $4.42. The extra government expenditures on mass transit, compared with the U.S. average, equaled fully 2.17% of all the income of all city residents, and 1.54% of the income of residents of the Downstate Suburbs. On the other hand, according to Consumer Expenditures Survey Data…
Consumer Expenditures Survey Vehicles
Whereas the average U.S. household had 1.8 motor vehicles the average household in metro New York had just 1.3, despite metro New York having an average income that was 25.5% higher. The average metro New York household had 17.1% more total consumer spending than the average U.S. household, due to the higher average income and cost of living here, and yet spent $872 less on transportation that the U.S. average (despite spending more on public transit).
In metro New York many households can get around without owning their own vehicle, or with one vehicle for the family rather than two or more. As a result vehicle purchase costs are particularly low here, according to the Consumer Expenditures Survey. The average metro New York household would have spent even less on transportation if the cost of auto insurance were not so high here. Obviously the old, young and poor, who often don’t have automobiles at all in metro New York, benefit the most from the transit system, as do others living in New York City. Even nationwide, the less well off tend to have far fewer vehicles of their own.
The Upstate Urban Counties were at about the U.S. average in Mass Transit expenditures per $1,000 of personal income, at $4.68 on average in FY 2012, while New Jersey was above average at $6.48. In Upstate New York mass transit serves the role it does in most of the country, as a social welfare program for those too old, young, disabled or poor to drive. In New Jersey, as in downstate New York, it is a vital part of the economy.
New Jersey’s FY 2012 mass transit expenditures, however, are down from $9.28 per $1,000 of personal income in FY 2002, a 30.1% decrease. Mass transit ridership has been booming across the country, thanks to the increased interest of younger generations in mass transit relative to driving. To accommodate that growth mass transit expenditures were 20.4% higher nationwide, per $1,000 of personal income, in FY 2012 than in FY 2002, despite budget cuts in the wake of the Great Recession. The Upstate Urban Counties had a 23.2% increase in spending relative to personal income. But in addition to the plunge in New Jersey, Mass Transit operating and capital expenditures fell 18.5% relative to personal income in New York City and 23.2% in the Downstate Suburbs.
Given this data, the increased crowding and falling reliability of mass transit in metro New York are no surprise. At one time rising ridership was making the transit system more efficient and cost-effective by using capacity, particularly off-peak capacity, which had been wasted. But the metro New York transit system has passed that point. Why is mass transit spending, as measured by the Census of Governments, going down relative to the total personal income of area residents? Perhaps for the same reason many other kinds of state and local government expenditures are going down on that same basis. It isn’t tax cuts, because state and local taxes have been going up per $1,000 of personal income in New York and New Jersey.
https://larrylittlefield.wordpress.com/2015/04/14/taxes-2012-census-of-governments-finance-data/
Mass Transit expenditures are going down by this measure because of what is not included: pension contributions and debt service. Thanks to the retroactive pension increases and demand for tax, fare and toll cuts by Generation Greed in the past, pension and debt service expenditures are soaring.
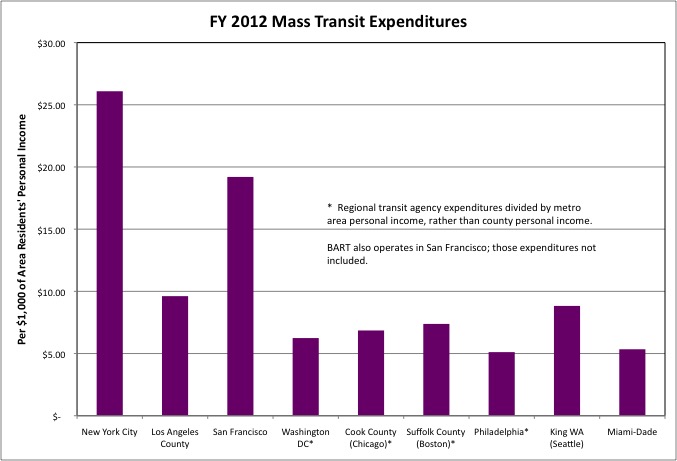
In FY 2012 New York City’s Mass Transit expenditures were higher, per $1,000 of city residents’ personal income, than in the other major urban counties. In many of these areas, however, I had to divide the expenditures of a regional transit agency by metro area personal income; it is likely that expenditures are higher per $1,000 of personal income in the city alone. San Francisco has its own mass transit system, an extensive but notoriously inefficient and featherbedded system, in addition to the Bay Area Rapid Transit system which generally brings those living elsewhere into the city (like commuter rail in NYC) but also includes stops in the city.
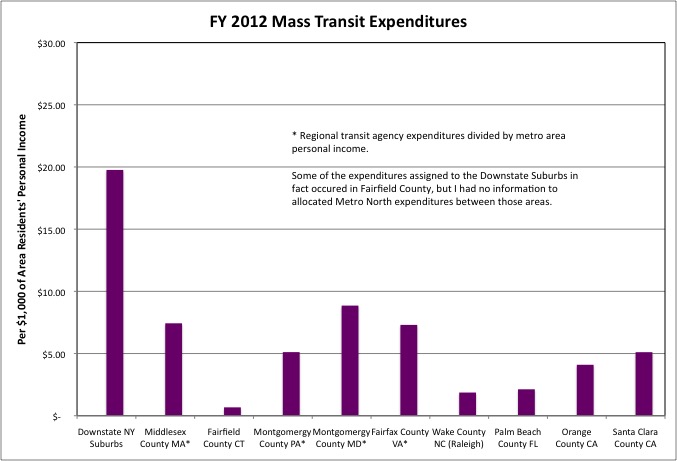
As best as can be measured mass transit expenditures for the Downstate NY Suburbs are much higher, per $1,000 of their residents’ personal income, then in other affluent suburban counties around the country. But some of the MetroNorth expenditures counted as expenditures of the State of New York, which I allocated to the Downstate Suburbs, in fact took place in Connecticut, on the New Haven line. Anyone with more detailed information is welcome to download the spreadsheet, adjust the numbers, and produce a better chart than this one.
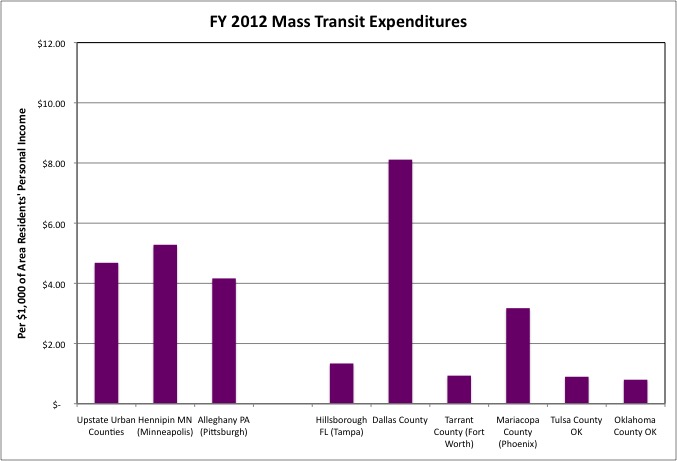
The (allocated) Mass Transit expenditures of the Upstate Urban Counties, per $1,000 of personal income were similar to Hennipin (Minneapolis) and Alleghany (Pittsburgh) counties, the other older Frostbelt counties chosen for comparison, but well above comparable Sunbelt counties. I was surprised that mass transit expenditures were as high as they are in Dallas County, per $1000 of the personal income of that county’s residents, and checked to see if the Dallas Area Rapid Transit system extended to other counties. Aside from an express route over to Fort Worth and Dallas Fort Worth airport, that does not appear to be the case to a great extent, though the border is crossed a little.
Perhaps the high level of transit expenditures in Dallas County are explained by capital expenditures on a large and growing rail transit network that didn’t used to be there. Republican politicians fight against mass transit in the Northeast and Midwest, but they are rapidly expanding it in some of the so-called Red States.
When you talk about Airport and Seaport expenditures in downstate New York and New Jersey, you are pretty much talking about the Port Authority of New York and New Jersey. I allocated its Air Transportation expenditures two-thirds to New York City and one-third to New Jersey. In past tabulations of Governments Division finance data I used to allocate some of its Sea and Port expenditures to New York, but given certain realities I’ve simplified by assigning them all to New Jersey.
As noted in my tabulation of employment data from the Census of Governments, New York and New Jersey have very little local government Airport and Sea and Port transportation employment. The management of these facilities has been substantially contracted out, but the expenditures still show up in the finance data.
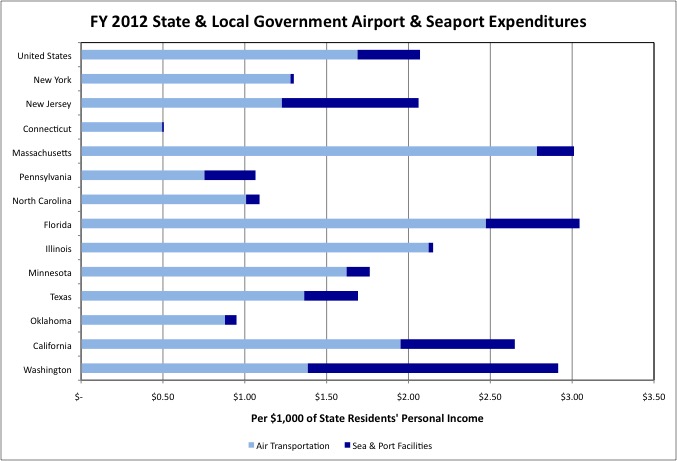
With the nation’s second biggest seaport and Newark Liberty Airport, among others, New Jersey’s state and local government Airport and Seaport expenditures were at about the U.S. average per $1,000 of state residents’ personal income. Despite JFK and LaGuardia airports and all the airports upstate, New York State was below the U.S. average in airport expenditures. The large East Coast ports competing with Port Elizabeth-Newark in New Jersey are in Florida and the Port of Virginia in the Hampton Roads area. Each of which have better rail connections to the country via Virginia-based Norfolk-Southern and Florida-based CSX, the two major freight railroads serving New York and New Jersey. As I noted previously, the major rail freight improvements happening elsewhere in the U.S., often with a combination of federal, state and private investment, are not happening in New York and New Jersey.
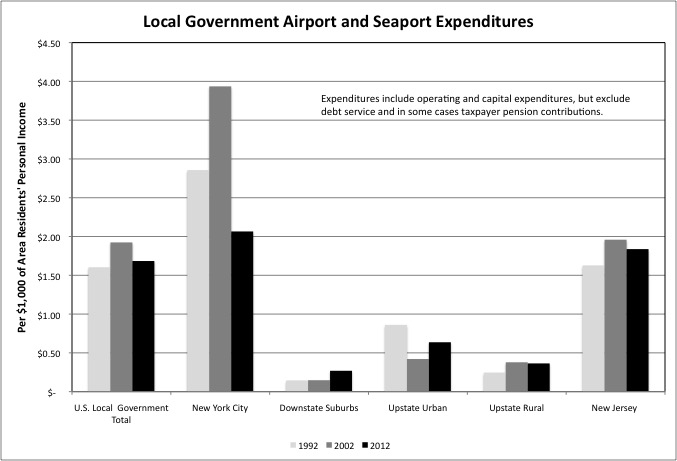
It was not long ago that LaGuardia and JFK airports were rebuilt. Perhaps that is why expenditures in these categories were high in New York City and New Jersey in FY 2002, per $1,000 of personal income. Now we are told that LaGuardia has to be rebuilt again. After the gold-plated, every-interest-satisfied reconstruction of the World Trade Center, however, the Port Authority of New York and New Jersey has no money for this and little for anything else – despite still collecting a tax on every ticket to pay for the previous rebuild. The pie in the sky proposals being put out, to be financed by debts metro New York residents cannot afford to repay, are, frankly, an insult to our collective intelligence.
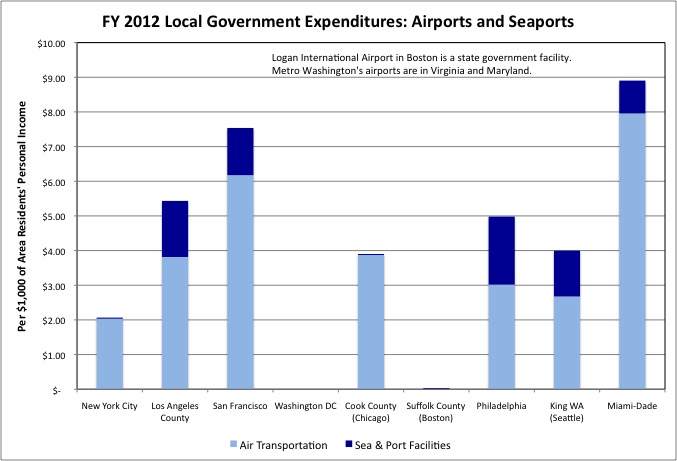
New York City’s air transportation are lower, per $1,000 of city residents’ personal income, than in the other major urban counties with major airports. In part because New York is a bigger city (in a bigger metro area) with more income. However, the $977 million in Air Transportation operating and capital expenditures I allocated to New York City, two thirds of the Port Authority total, is less than the $990 million for Cook County in Chicago (O’Hare Airport) and little more than half the $1.7 billion for Los Angeles County, which also has several airports.
In addition to transportation expenditures, transportation operations come with extensive revenues. Airports and Seaports charge for landings, motor vehicles pay gas taxes and license taxes, roads and bridge have tolls, transit systems have fares, and local roads and transit systems receive federal and state aid.
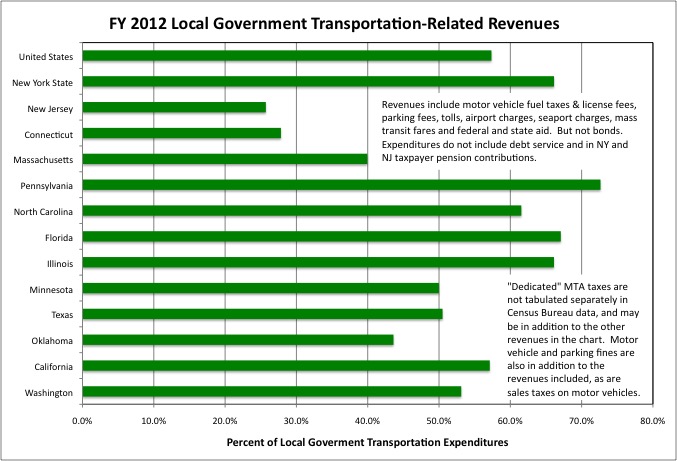
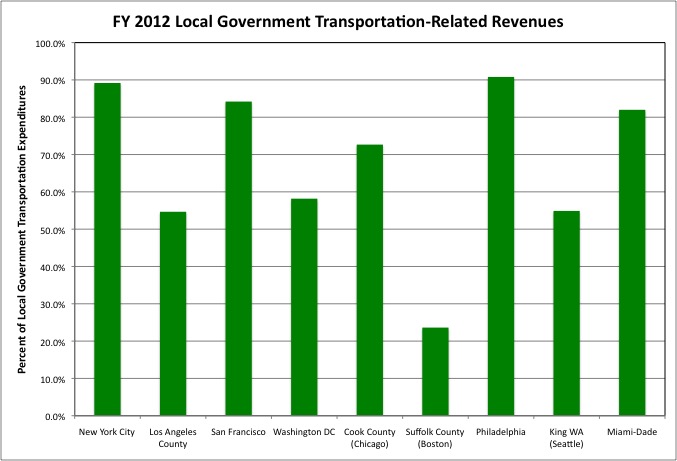
Taking all these forms of transportation-related revenues together, they equaled 57.4% of total U.S. local government transportation expenditures in FY 2012, 66.1% for New York State, and about 25.0% for New Jersey and Connecticut. Dedicated taxes and fees also covered a high share of transportation expenditures in Pennsylvania (72.6%), North Carolina (61.5%), Florida (67.1%), and Illinois (66.1%).
In addition to these transportation-related revenues, local government transportation expenditures are funded by general taxes and bonds. On the other hand, if money has been borrowed in the past, or pensions have been retroactively enhanced and/or underfunded in the past, soaring expenditures on debt service and pensions and falling expenditures on actual transportation could mean that transportation-related revenues rise as a percentage of the shrinking amount of actual transportation expenditures that remain. And that appears to be what is going on in New York and New Jersey.
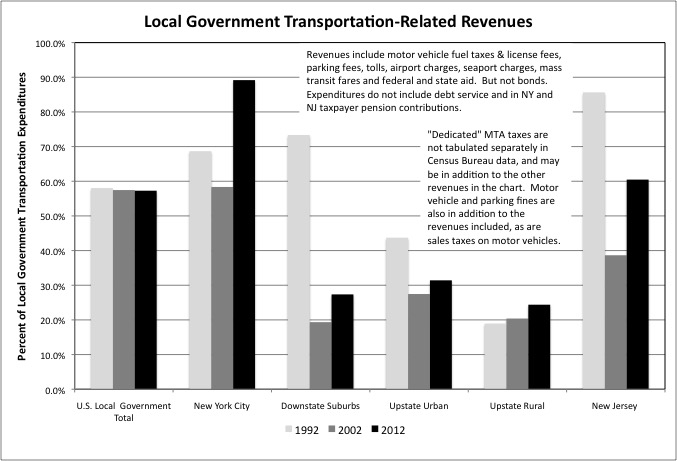
These transportation-related revenues equaled 58.0% of U.S. local government transportation expenditures in FY 1992, 57.5% in FY 2002, and 57.3% in FY 2012. Not much change. Allocating MTA and Port Authority revenues and expenditures is difficult. But as best as can be determined transportation-related revenues fell from 68.7% of local government transportation expenditures in FY 1992 to 58.4% in FY 2002 in New York City, from 73.3% to 19.4% in the Downstate Suburbs, from 43.7% to 27.5% in the Upstate Urban Counties, and from 85.6% to 38.6% in New Jersey. How?
Tolls and commuter rail fares were frozen for years. So were gas tax rates. In fact there were some tax cuts, and tolls were removed on the Saw Mill River, Southern State and Hutcheson River parkways and part of the New York State Thruway. With the advent of the Metrocard two-fare zones were eliminated, discounts were introduced, and unlimited ride cards became available. The fare per unlinked trip plunged, and plunged even more relative to overall inflation and the cost of transportation. That cost was rising due to the soaring prices charged by New York area contractors, the 2000 retroactive pension increase for New York’s public employees (and a similar increase in New Jersey), and various pension “incentives” to “save money.”
At the same time New York City, New York State and New Jersey cut off general tax revenue funding for transportation to pay for tax cuts – and checks sent to taxpayers. But there were no immediate consequences. All these revenue decreases, and spending increases, were paid for by more borrowing, with the MTA debt rising to $32 billion. There was much rejoicing, great praise of the politicians, union leaders and advocacy groups such as the Straphangers, and little concern about the consequences in the future. A future when those cutting the deals expected to be either President of the United States or retired on tax-free pensions.
Knowing what this meant I was outraged enough to leave a job at the MTA and run a Don Quixote campaign against the local hack who, more than a decade later, is the head of the State Assembly committee responsible for MTA funding.
http://www.ipny.org/littlefield/civicunion2020.html
Many of the legislative heads responsible for this debacle have been indicted (Bruno, Silver, Skelos) or otherwise disgraced. Incredibly, however, one of these Generation Greed parasites has the nerve to run for President.
http://www.syracuse.com/opinion/index.ssf/2015/05/george_pataki_for_president_what_theyre_saying.html
Which is, in its own way, a further indictment of the media and the broader citizenry. Because if the average person was interested, active and well informed, George Pataki would be afraid to walk down the street, lest he be accosted and cursed by outraged victims, rather than running for the nation’s highest office.
By FY 2012 transportation-related revenues had jumped to 89.2% of the actual transportation expenditures that are left in New York City, thanks to grinding fare increases, service cuts, maintenance cuts, toll increases, etc. And this is just the beginning.
That 89.2% includes the toll revenues of the Triborough Bridge and Tunnel Authority, still assigned to the City of New York by the Census of Governments even though the city turned this asset over to the state when the MTA was formed. Half or (in some cases) more of those revenues are now spent on the suburbs. If East Side Access is actually finished, the MTA would have built most of what the suburbs were promised as part of the “Program for Action” when it was formed. And virtually none of what New York City was promised, even if a three-station stub eventually opens on Second Avenue.
http://www.thejoekorner.com/lines/progforaction.htm
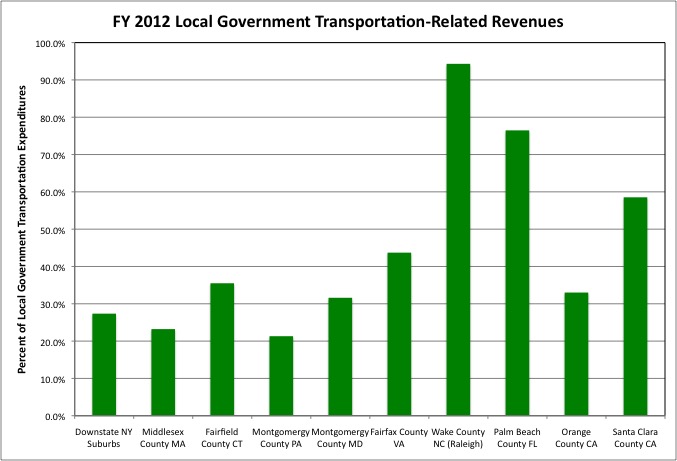
Meanwhile, even excluding the TBTA money transportation-related revenues are up to 27.4% of transportation expenditures in the Downstate Suburbs and 60.5% in New Jersey. Or were in FY 2012. More fare increases are coming in New Jersey, and gas tax increases and toll increases will follow sooner or later, yet a perpetual fiscal crisis is a certainty anyway.
Those seeking “practical solutions” to the perpetual funding crisis, and proposing additional increases in transportation-related revenues in response, have been unwilling to talk openly about the normative and moral questions surrounding the actions of Generation Greed. Thus they do not fully explain what the situation is.
Thus the transportation advocates run head long into this reality. The people who are here now realize they are already paying more in fares, tolls, dedicated taxes and fines for transportation than in the past, and more than anyone else. Were it not for all the interest on all of Generation Greed’s debts, and all the excess pension contributions to pay for Generation Greed’s pension increases and underfunding, and all the excessive charges by contractors, there would all be plenty of money for transportation. Because it is all being sucked into the past.
So every time fares are proposed to be increased, tolls are proposed to be added or increased, gas taxes are proposed to be increased, dedicated taxes are proposed to be added, the question is asked: “what to we get for it?” And our politicians, while probably smiling and laughing privately, never say publicly “What are you going to get for it? The question is what other people already got for it!” People have been led to believe they can keep the transportation system they have in exchange for what they are already paying, because they are already paying so much. No one is willing to tell them they’ve been robbed. So the politicians do nothing.
The transportation-related revenues tabulated here don’t even include all of the MTA’s dedicated taxes. That is because these are collected by the State of New York, and the transit agencies outside NYC are counted as state agencies. While the dedicated MTA taxes paid to New York City Transit show up as state to local transportation aid, therefore, those paid to the Long Island Railroad and MetroNorth do not show up at all.
We now have a new set of politicians – Governor Cuomo, NYC Mayor DeBlaiso, and Governor Christie. They didn’t cause the problem. But they seem determined not to solve it. They are concerned with fairness. Fairness to them means they have the same right to destroy our common future to advance their personal careers as all the politicians that preceded them. They want to be popular. Promising something for nothing to many, delivering it to the organized groups on the inside, and deferring the costs to a future they and their crowd do not care about is the way to be popular. They want to repeat the trick, or change the subject.
So Christie and the state legislature simply refuse to face the transportation funding crisis in New Jersey.
Cuomo and the state legislature simply refuse to face the transportation funding crisis in New York.
And Mayor DeBlasio and the New York City Council, while spending like drunken sailors on virtually every other interest and priority, refuse to increase the city’s contribution to the MTA beyond a pittance.
The main issue for all of these politicians is making sure that even if the onrushing disaster isn’t completely ignored in the media, at least someone else gets the blame.
People will never understand the transportation finance crisis in New York and New Jersey until the term Generation Greed comes into common usage to refer to the actions by our politicians, many of whom are still there, and those who benefitted. Until people are made to understand how painful the choices are, and why, the moment of crisis will continue to be deferred so more and more members of Generation Greed can cash in and move out ahead of it.
In some ways it is perhaps not surprising that Generation Greed has encumbered the transportation system with debt. Because it is essential to the economy, bondholders might assume it can be held hostage and they will be repaid no matter what. And if the consequences is a diminished quality of life and weakened economy, that won’t affect the retired who no longer have to commute to work. Particularly those living in Florida.
Rather than get entirely depressed, let’s turn our attention to a more positive legacy of the generation that came of age in the 1960s: Environmentalism, and environmental infrastructure.
Not every place was public water and public sewer. In rural areas, and even in many developing suburbs, people rely on private wells and cesspools. The Census Bureau classifies public Water Utilities as utilities because in theory water is something people will be willing to pay for. In New Jersey, in fact, much of the state is served by private water utilities, and legislation was just passed to privatize the rest.
http://america.aljazeera.com/articles/2014/12/29/new-jersey-waterprivatization.html
In New York City, however, the failures of a private water company operating within its borders led to a costly takeover in decade past, with extensive public investment required to make up for private disinvestment. In the Generation Greed era, you really can’t trust either the public or private sectors.
As for Sewerage, the Bureau doesn’t classify this function as a utility because taking care of one’s human waste, rather than just dumping it in the street as in the Middle Ages, is thought of as something that benefits other people. So individuals households will not pay, and the government must collect taxes to provide.
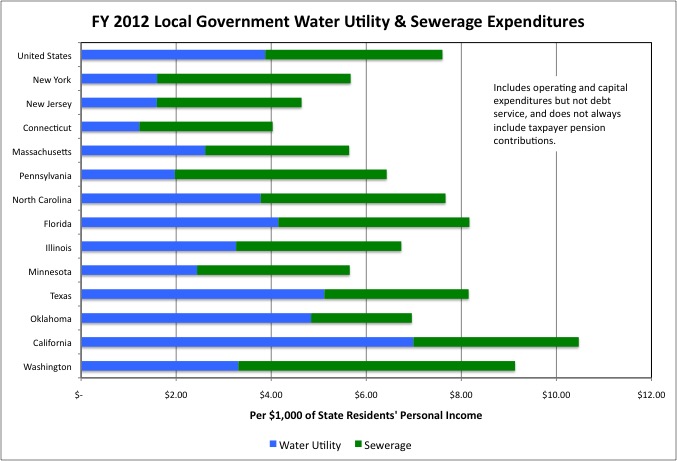
In any event despite extensive spending due to environmental mandates, local government expenditures on Water Utility and Sewerage infrastructure, per $1,000 of state residents’ personal income, were below the U.S. average in New York and New Jersey in FY 2012.

New York City’s expenditures in the categories, having taken a dip in FY 2002, increased in FY 2012 to close to the U.S. average – and more than in FY 1992. New York City’s local government Water Utility and Sewerage expenditures equaled $7.18 per $1,000 of city residents’ personal income in FY 2012, compared with a U.S. average of $7.52. Compared with FY 1992, meanwhile, FY 2012 expenditures in the category were down 26.6% in New York’s Downstate Suburbs, 19.1% in the Upstate Urban Counties, 8.3% in Rural New York counties, and 34.4% in New Jersey.
Some parts of Upstate New York are asking the state to pay to rebuild their water and sewer systems, but Upstate residents have proven unwilling to use their own income to do so. The cities are broke and the suburbs feel they have enough time left for everyone to die off or move out before reinvestment is required.
One factor inflating the cost of Sewerage in New York City, meanwhile, is the need to capture rainfall in order to treat it before discharging it into the local waterways. New York City’s sewage and stormwater runoff both use the same pipes, and in heavy rains the flow overwhelms the city’s sewage treatment plans and untreated sewage flows into the city’s waterways. Or at least it did in the past.
http://www.nyc.gov/html/dep/html/stormwater/combined_sewer_overflow.shtml
The federal Environmental Protection Agency and the state have forced the City of New York to spend $billions to solve this problems, at the expense of other priorities. Meanwhile, suburban stormwater runoff still flows directly into area waterways, complete with lawn fertilizer, pet waste, road oil and other contaminants. So the water quality in bodies such as the Long Island Sound continues to deteriorate, even as New York City cleans up. But no one is going to tell the suburbs to pay more fund the infrastructure required to capture and treat their stormwater runoff, as New York City is now doing. So Water and Sewerage expenditures have fallen, per $1,000 of personal income, in the Downstate Suburbs and New Jersey.
While it cost a great deal to install, New York City’s water system is cheap to run, and its Water Utility expenditures were low in FY 2012 despite the ongoing construction of the Third Water Tunnel and a new water filtration plant. Western cities have to pay far more to get water. NYC, however, will now have to pay to replace one of its main water tunnels under the Hudson River, because it is leaking. And New York City continues to spend enormous amounts to upgrade its Sewerage system, or at least it did through FY 2012.
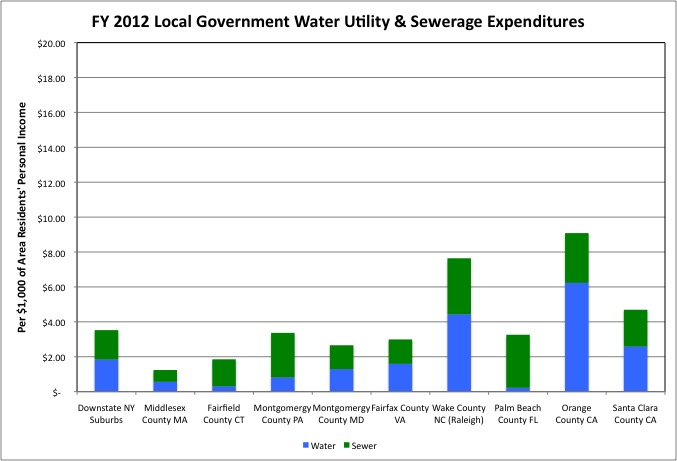
With their more recently built infrastructure, and in some cases private water services, many affluent suburban counties were spending relatively little of the residents’ personal income on local government Water Utility and Sewerage expenditures. Fast growing areas, such as Wake County in North Carolina, and dry western areas in California spend more.
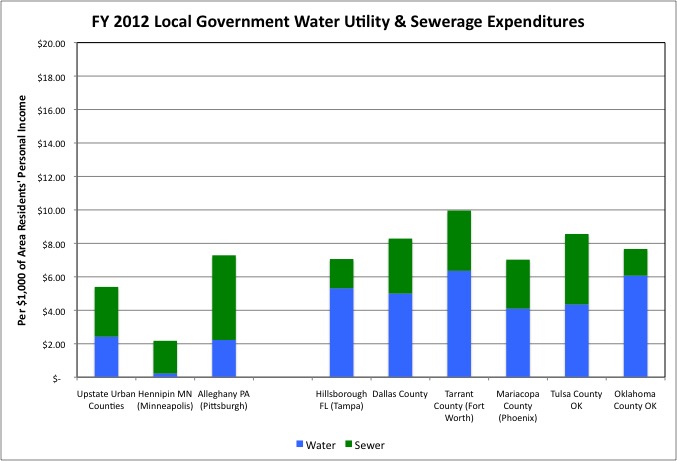
The Upstate Urban Counties are spending less of their residents’ personal income on public water and sewer infrastructure than many urban counties around the country, as well as 28.3% less than the national average.
Public water and sewer infrastructure generally comes with public water and sewer fees, with the public agencies seeking to break even over time. In the short run, when money is being borrowed to expand the infrastructure, these revenues may be less than expenditures, with the capital expenditures funded by bonds instead. Or water and sewer revenues might exceed operating and capital expenditures, due to money diverted to interest payments on past debts, or pensions.
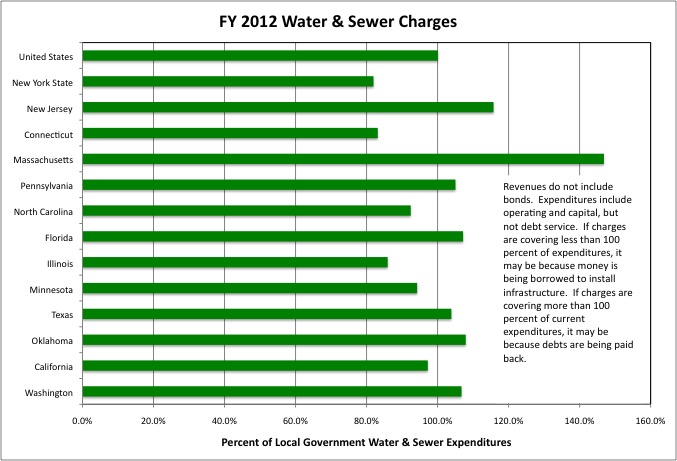
Nationwide, local government Water and Sewer charges approximately equaled Water and Sewer operating and capital expenditures on FY 2012. In New York State these charges equaled only 82.0% of expenditures, compared with 115.8% of expenditures in the New Jersey and 146.9% in Massachusetts.
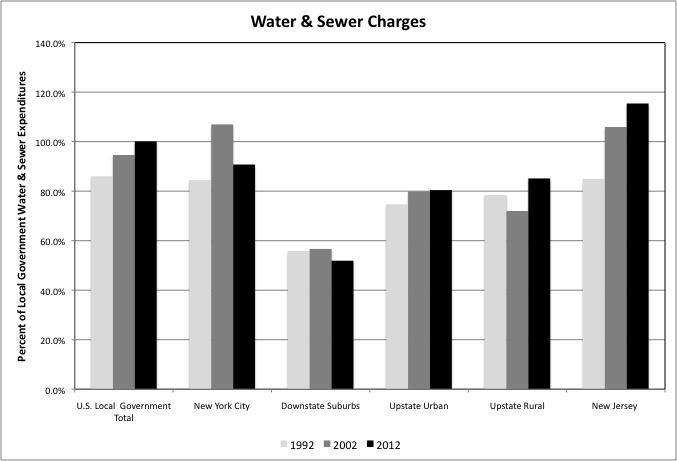
Within New York State, however, charges covered 90.8% of local government Water and Sewerage expenditures in New York City, compared with just 51.9% in the Downstate Suburbs, 80.4% in the Upstate Urban Counties, and 85.1% in Upstate Rural Counties. The share of expenditures covered by fees has always been low in the Downstate Suburbs and, in addition, the expenditures themselves are low. The City of New York uses the amount of water used as a basis for sewerage charges, on the assumption that what goes in comes out. It appears that in the Downstate Suburbs, whereas water is funded by charges (or payments to private water companies) Sewerage is funded by the area’s very high property taxes.
https://www.nassaucountyny.gov/DocumentCenter/View/4073
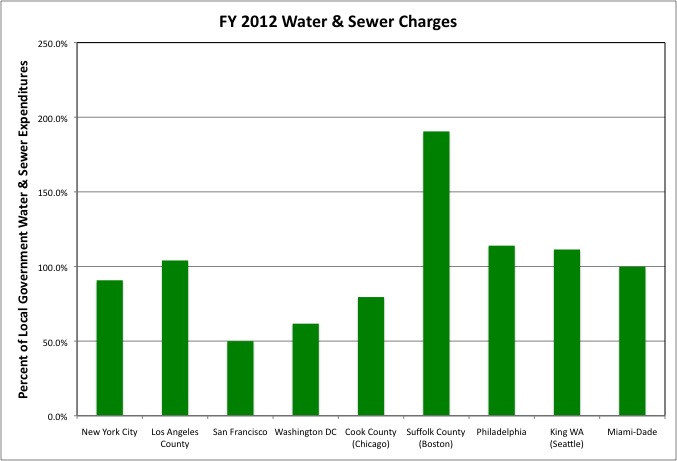
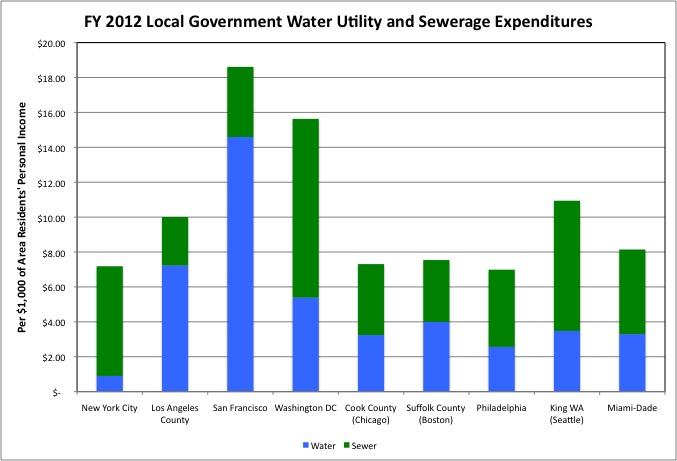
Covering a large share of local government Water and Sewerage expenditures with fees seems to be a characteristic of large urban counties. One exception appears to have been San Francisco, where the water authority also generates electricity from the dam at the Hetch Hetchy reservoir. The drought there is forcing up water rates.
http://www.nbcbayarea.com/news/california/Drought-Forcing-Up-San-Francisco-Area-Water-Rates-295548101.html
Although charges only equaled 50.0% of expenditures in FY 2012, San Francisco appears to pay for both Water and Sewerage with charges.
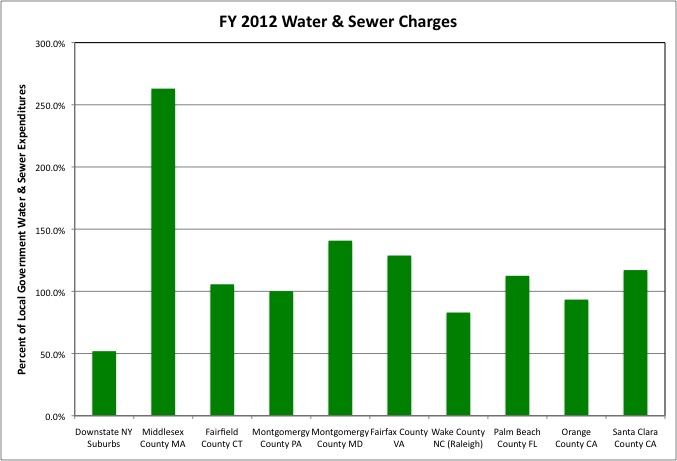
Areas that have private water suppliers can’t use water usage as a basis for sewer charges, because they don’t have that information. That may be the case on Long Island. But most affluent suburban counties pay for most of their Water and Sewerage expenditures with charges for services. And, in some cases, more than that.
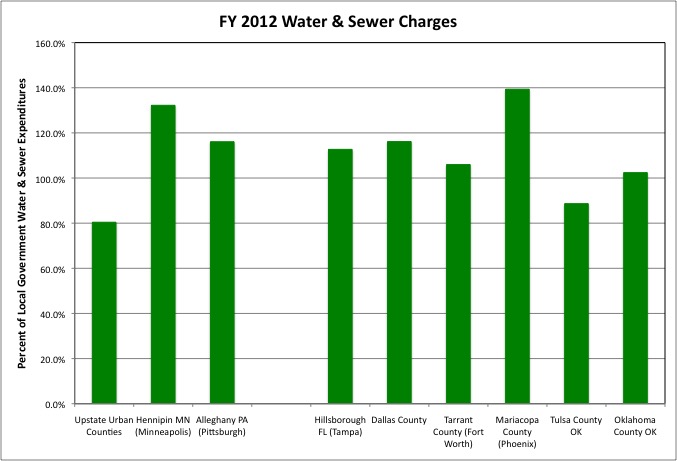
Other urban counties, not just the largest, rely on water and sewer changes to cover their expenditures in the category. The Upstate Urban Counties covered relatively less of their expenditures with charges than average in FY 2012.
The City of New York has public water and sewer, but its electricity and natural gas infrastructure are owned and operated by private companies. I included a few charts on local government Electric Utilities and Gas Utilities in the interest of completeness, however.
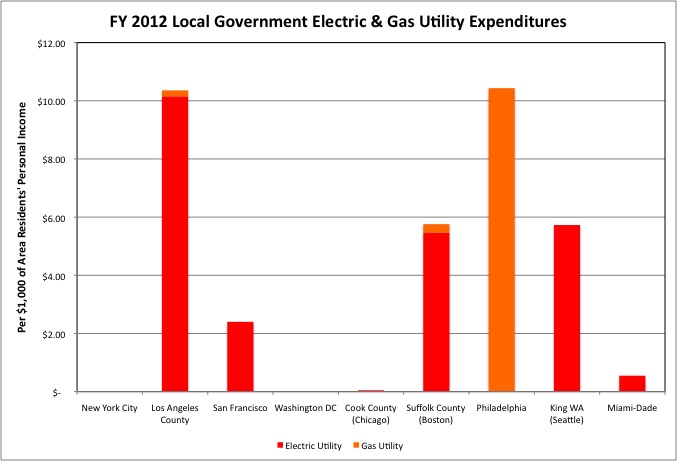
The western cities tend to have public sector electric utilities, because both the water and the electricity there were originally based on huge dams. Philadelphia has one of the few large urban local government natural gas utilities. Some propose that it be sold to a private company (which would then jack up rates), to help pay for that city’s pension crisis.
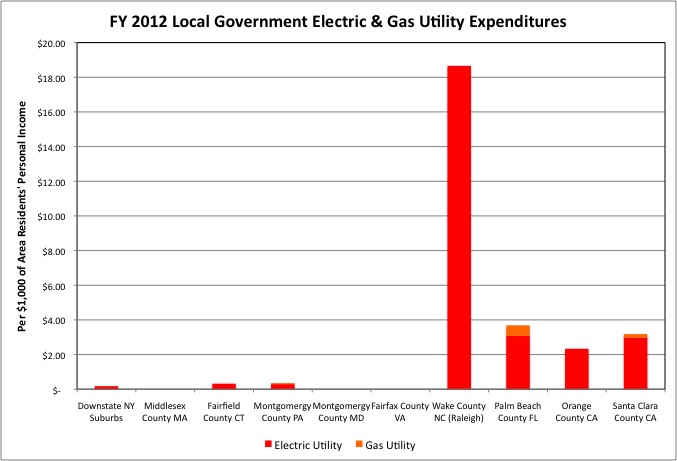
There is apparently a major local government electric utility in Wake County, North Carolina, that serves more than Wake County.
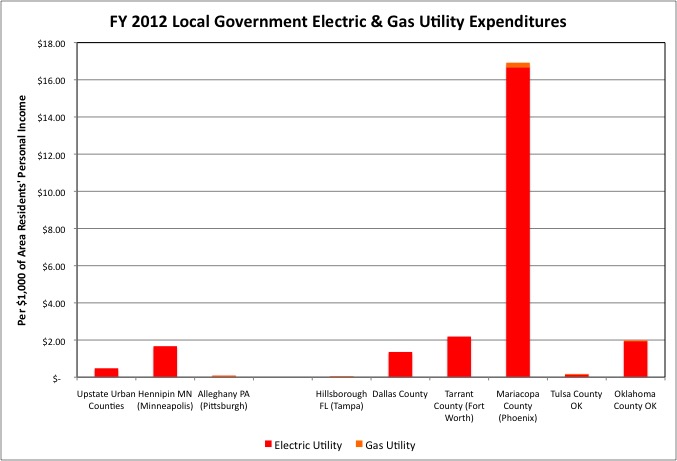
In “small government” Phoenix, as well, the local electric utility is government owned.
In general, however, local government electric and gas utilities are found in the sort of lower-density areas, particularly rural areas, that private sector utilities did not find profitable to serve. Many got their start in the 1930s Great Depression, with the benefit of federal loans and grants as part of the “rural electrification” effort.
http://www.nextnewdeal.net/rural-electrification-administration
“While 90% of urban dwellers had electricity by the 1930s, only 10% of rural dwellers did and roughly 9 out of 10 farms had none. Private companies hadn’t been interested in building costly electricity lines into the countryside and assumed the farmers would be too poor to buy the electricity once it was there. But by 1939, the REA had helped establish 417 coops, which served 288,000 households. By 1939, 25% of rural households had electricity. By the time FDR died in 1945, an estimated 9 out of 10 farms were electrified.”
The states with the highest state and local government Electric Utilities expenditures, per $1,000 of state residents’ personal income, in FY 2012 were Nebraska ($39.22), Tennessee ($25.60), Alaska ($13.09), and West Virginia ($12.04). If the expenditures of the New York State Power Authority are only measured per $1,000 of the personal income of state residents outside New York City, they equal $10.36).
The Census of Governments was established in the 1950s and, never well-funded, has not been updated much since. So there is no “telecommunications utility code” as part of government finance statistics, even though some communities have established public telecom utilities to bring in high-speed internet. President Obama has proposed something like the Rural Electrification Administration to bring high speed internet to more of the country.
http://www.nextnewdeal.net/obama-can-revolutionize-rural-america-broadband-fdr-style
In the debate over the federal Telecommunications Act of 1996 the private companies made the promise that if the government stayed out of it, they would build the “information superhighway.” Today, however, U.S. private wired telecommunication utilities provide a service to Americans that is inferior to most developed, and even some developing countries, and are seeking to make the minimum reinvestment in our aging telecommunications system that they could get away with.
At the same time, however, these companies have delivered – at vast cost – something that was not even imagined in 1996. A wireless telecommunications system that has people doing everywhere some of what they once hoped to be able to do while tethered to a wire. This massive investment may have crowded out investment in the wired infrastructure, for better or worse, with private companies fearing large investments in what might become a while elephant. Perhaps public agencies may not want to build white elephants in their place. In any event, as the 20th anniversary of the 1996 Telecommunications Act approaches, a review of whether promises were met is in order.
I’ll conclude this overview of state and local government infrastructure revenues and expenditures with a preview of the last post I intend to write in this series, which will rank the extent to which each state’s future has been diminished by the deals and non-decisions of the Generation Greed era. A “sold out future” ranking.
It will be based on a series of factors. On the books debts, of course. Pension costs and underfunding. Taxes – it’s one thing to face tax increases when your current tax state and local tax burden is low, and another to face higher taxes if your tax burden is already high. And past infrastructure and other investments.
In an effort to debunk press reports that the U.S. is facing an infrastructure crisis, the Congressional Budget Office released a report making the claim that total federal, state and local transportation and water infrastructure operations and capital expenditures on have been stable over the years as a percent of GDP.
https://www.cbo.gov/sites/default/files/cbofiles/attachments/49910-Infrastructure.pdf
“As a share of GDP, public spending on transportation and water infrastructure over the past three decades has hovered at about 2.4 percent, which is 0.6 percentage points lower than the peak of 3.0 percent in 1959.”
Including operations, however, this measure could include things like elevated pension costs or debt service. I want to focus on actual capital expenditures.
And only in certain categories. I don’t dismiss the value of stadiums, convention centers, parks and the like. After all one of the central purposes of cities, since there have been cities, has been provide a location for people to gather for events, celebrations and meetings of various types. Because of their visibility and lobbying, however, I feel there has been overinvestment in public buildings and underinvestment in the connective infrastructure that allows society and the economy to work. Too little investment in stuff that isn’t sexy but is essential. I want to focus on the essentials.
More to the point, I want to focus on construction expenditures. In metro New York we spend a great deal of public money on one of the other categories of capital expenditures, equipment purchases, because our large mass transit systems require the ongoing purchase of new railcars and buses. This is the equivalent of the private motor vehicles that people in other places purchase themselves, not other place’s investment in the infrastructure those vehicles move on.
So just examining capital construction expenditures in infrastructure categories, per $1,000 of U.S. residents’ personal income, what does Census of Governments data have to say about the past 30 years?
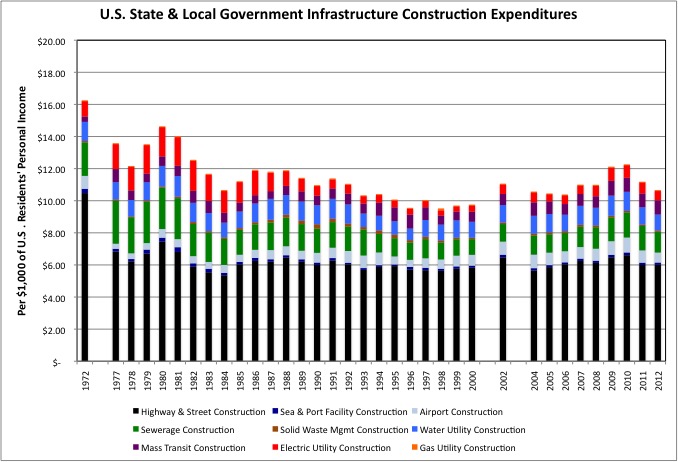
The data show there was a big dropoff in state & local government construction expenditures per $1,000 of personal income from 1972, at the end of the infrastructure construction era, to the late 1970s. Most of the drop was in Highway construction. And there was another drop from the late 1970s to all the years since.
I’m not going to make the claim that the infrastructure investment levels of the 1950s and 1960s are the right one. At the time so much public investment, and in particular federal investment, was going into new infrastructure in the suburbs and Sunbelt that the existing infrastructure and housing built before 1950 in older cities was devalued, and often left to deteriorate, rather than being maintained. And already developed areas were being torn apart to build highways through them, and to provide housing for the poor and troubled people the growing suburbs did not want. It was only after the Reagan-era cutbacks in federal funding for new infrastructure, and Reagan era reforms that allowed a choice to use federal money for transit and to maintain existing infrastructure, that some of the existing cities such as New York began to recover.
Nonetheless, the infrastructure put in place before the peak of American wages in 1973 is now more than 40 years old. Rather than excessive investment in new infrastructure to benefit developers, the question is whether we can keep the infrastructure we already have. And what should be abandoned, and how we can live without it, if we can’t.
Identifying the level of public capital construction in New York City, the Rest of New York State, and New Jersey is difficult for the long term, because that means dividing up MTA and Port Authority spending over the decades. Whereas I only have Census Bureau data on the Port Authority, and Federal Transit Administration data on the MTA, for selected years. Given that caveat, I have already run into a surprise.
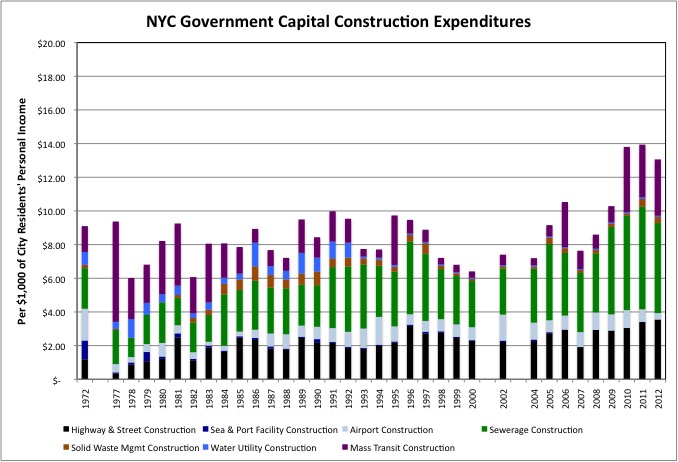
The only good news I had expected to find with regard to the effect of the past on New York City’s future was a high level of infrastructure construction over the past 30 years. I know the city and its separate transportation agencies are deep in debt, its taxes are high, its pension costs are high, and its pensions are underfunded. But given that all of the city’s the major bridges have been rebuilt over 30 years, along with large parts of its transit system, I had expected capital construction expenditures to have been a high share of city residents’ personal income over that period. Here, using the same scale as the U.S. chart, we see that isn’t so.
What NYC construction there has been, moreover, is heavily skewed toward Sewerage, unless some Water supply construction has been misclassified (Water seems low). In addition to all the sewage treatment plants and holding tanks, the city also finally built out its sewers during these years, serving Staten Island.
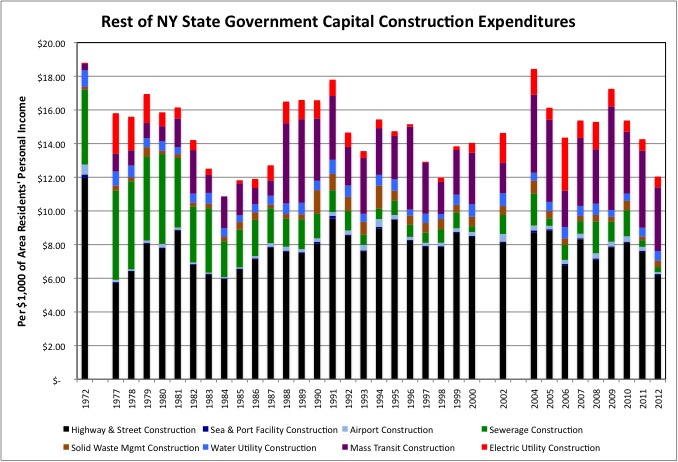
Meanwhile, although no new major roads have been built in New York State since the early 1970s, local government infrastructure construction expenditures have been relatively high since, particularly for roads, in the years since. I had expected infrastructure capital construction expenditures to be a low share of personal income in the rest of New York State.
Some of this may be a classification error. The PATH system and construction on Port Authority Bridges and Tunnels is ending up in the chart for Rest of New York, because I don’t have the data to property split it between New York City and New Jersey instead. I did so with Air Transportation construction expenditures and Sea and Port Transportation Expenditures by assuming the division of expenditures in all years were similar to the years I had. Some MTA Capital Construction expenditures by the relatively recently created MTA Capital Construction company may also end up in Rest of State, even when they are for the benefit of New York City Transit. Although East Side Access is expensive enough to create that bulge in transit expenses itself. In addition, the New York State Power Authority built some power plants in New York City in the late 1990s, but all its construction is assigned to “Rest of State.”
Even if I can improve on the allocation, however, I do get the feeling that NYC infrastructure construction expenditures over the long term is going to amount to a lower share of city residents’ personal income than I expected, with the Rest of New York State coming higher. What came in low, as I expected, is New Jersey’s capital construction expenditures per $1,000 of state residents’ personal income.
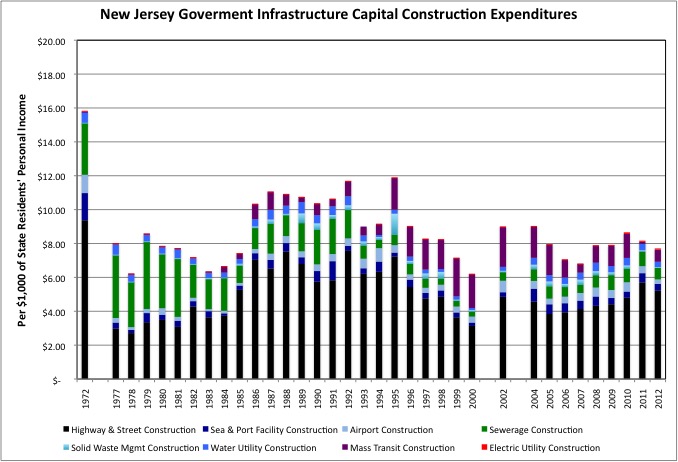
New York and New Jersey’s populations are growing very little, while other parts of the country have rapidly growing populations. Perhaps I need to apply some kind of factor to distinguish between fast growing places that both need to add new infrastructure and maintain what they have, and slow growing places that just require reinvestment. Nonetheless, if it was built 40-plus years ago, it probably requires reinvestment. And as we face this reality, there is already a lot of debt. Particularly in New York City.
If anyone wishes to work with the long term data and figure out ways to allocated it better, it is in this spreadsheet.
Infrastructure Construction 72-2012 NY-NJ-US
I’d appreciate it. It would allow me to focus on getting the data together for the other 48 states. Are there other states where Generation Greed has done as much damage to the collective future as in New York and New Jersey? Which are they? I’ll try to answer that question in a few weeks.
And so the game of chicken comes to an end. The Straphangers, with their fare cuts and “two sets of books” propaganda. The TWU, with its pension increases and strike for 20/50. The tax cut and toll cut panderers. The contractors with their escalating prices. And the city and state politicians with their withdrawal of general tax revenues in good times and bad.
Anyone who chose to be responsible and stepped to secure the future would have been the victim, so no one did. But if money kept being grabbed from the future who would be the victim then? Now we know the answer. Generation Greed is the robber. Those coming after are the victims. For all those involved five, ten, fifteen and 20 years ago there is only one question. What it is going to be for your and yours? Florida, North Carolina, or South Carolina? And who are you leaving behind in power to make sure you can keep sucking money out from down there?
Meanwhile, the next post will be about functions such as Parks and Recreation and Libraries.