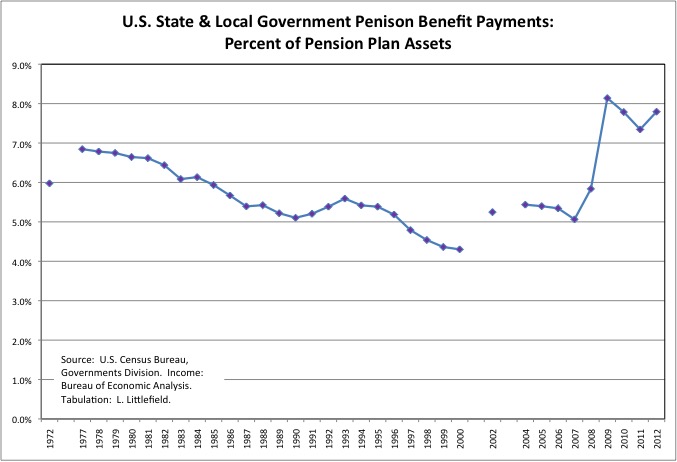
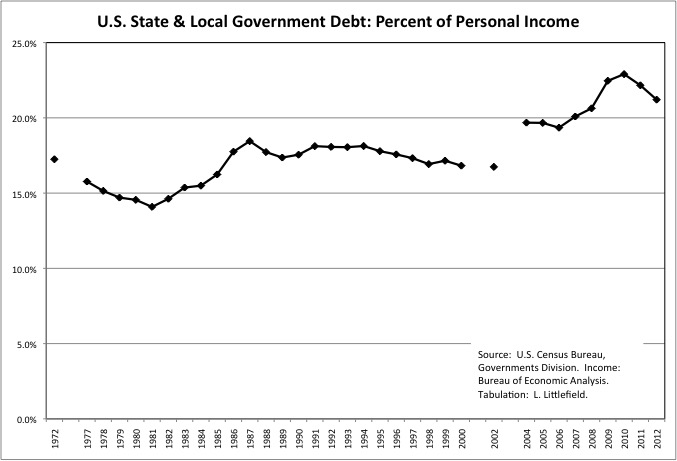
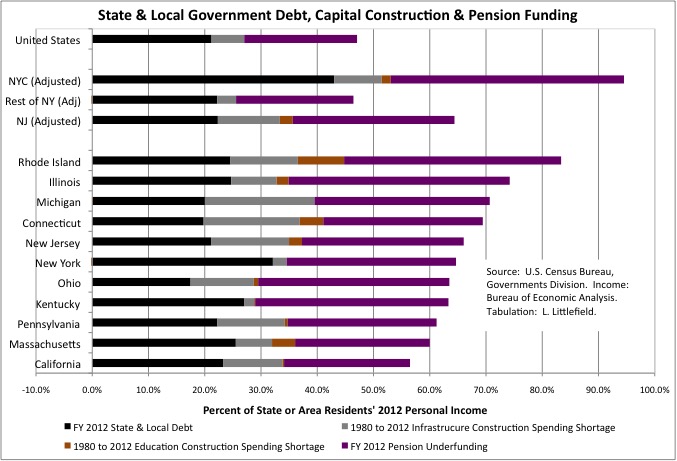
Sold Out Futures: A State By State Ranking Based on the Census of Governments

For nearly 30 years Americans, individually and collectively, have sold the future to live for today. In the private sector each generation of Americans since those born in the mid-1950s has been paid less on average, and yet has spent more, failing to save for retirement and borrowing to make up the difference. Corporate executives had their firms borrow, not to invest in income producing assets, but to buy back stock, temporarily increasing stock prices so they could cash in on bonuses and options. Despite future financial strains on Social Security and Medicare from the retirement of the large Baby Boom generation, the federal government cut taxes drastically in the early 1980s and again in the early 2000s, while spending with abandon on health care for older seniors, ultimately leaving behind a pile of IOUs that someone else will have to pay somehow.

At the state and local government level infrastructure investment was cut but debts were increased, leaving behind roads, bridges, water, sewer, and transit systems and schools in need of repair with no money to pay for this. And pensions for older public employees who were cashing in and moving out were retroactively increased even as pension funding was cut, leaving a financial disaster behind. The state and local government aspect of this future selling, however, varies in severity from place to place. Using an analysis of Census of Governments data from the U.S. Census Bureau, this post will rank the extent to which each state’s future has been sold by its current and past politicians and the interest groups that supported them.

Continue reading